- Overview
- User Interface
- Plan Objects
- Traffic Demand Modeling
- Simulation
- Simulation Analysis
- Traffic Forecasting
- IGP Simulation
- MPLS Simulation
- RSVP-TE Simulation
- Segment Routing Simulation
- Layer 1 Simulation
- Quality of Service Simulation
- BGP Simulation
- Advanced Routing with External Endpoints
- VPN Simulation
- Multicast Simulation
- Metric Optimization
- LSP Optimization
- RSVP-TE Optimization
- Explicit and Tactical RSVP-TE LSP Optimization
- Segment Routing Optimization
- Capacity Planning Optimization
- L1 Circuit Path Optimization
- Changeover
- Patch Files
- Reports
- Cost Modeling
- Plot Legend for Design Layouts
Cisco WAE Design 7.0.1 User Guide
Bias-Free Language
The documentation set for this product strives to use bias-free language. For the purposes of this documentation set, bias-free is defined as language that does not imply discrimination based on age, disability, gender, racial identity, ethnic identity, sexual orientation, socioeconomic status, and intersectionality. Exceptions may be present in the documentation due to language that is hardcoded in the user interfaces of the product software, language used based on RFP documentation, or language that is used by a referenced third-party product. Learn more about how Cisco is using Inclusive Language.
- Updated:
- May 4, 2017
Chapter: Cost Modeling
Cost Modeling
WAE Design provides basic cost modeling of network plans. Costs are specified for nodes and circuits, and these can be used to approximate infrastructure costs for the network or parts of the network. This allows for quick assessments of the costs of various upgrade alternatives, as well as for greenfield build-outs.
The specified circuit costs can also be used to estimate demand and demand grouping costs. This is the cost of routing traffic between particular locations or sets of locations in the network, taking into account the amount and cost of the circuit infrastructure used. This can be used to assess the cost of a customer, a particular service, or any other defined traffic source on the network.
Infrastructure Costs
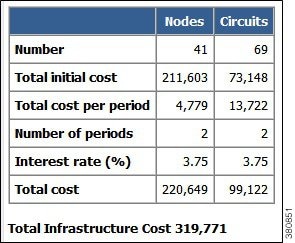
An Infrastructure Cost report can help you approximate the total monetary cost of a network design based on estimated costs assigned to nodes and circuits. These costs are calculated from initial costs and per-period costs, where per-period costs are amortized based on the specified number of periods and interest rates. The report gives an infrastructure cost based on sums of all node and circuit costs, as follows:
- Total initial cost—Sum of all initial costs for each object type.
- Total cost per period—Sum of all per-period costs for each object type before the amortization is applied.
- Total cost—Total initial cost + total cost per period after being amortized to a net present value.
- Total infrastructure cost—Sum of the total node and total circuit costs.
Cost Basis
Costs are based on any combination of Cost Initial and Cost Per Period properties that are assigned to nodes and circuits. A typical use case is to set nodes with an initial cost to identify the initial capital investment and to set circuit costs per period to analyze the operational cost of leasing circuits over time.
- Cost Initial—Static, one-time cost to which amortization and interest rates are not applied.
- Cost Per Period—Ongoing costs that are amortized based on the number of periods identified and on the interest rate specified when generating the Infrastructure Cost report.
You can set these properties manually. For circuits, you can also use the Cost Circuit Initializer to set the costs automatically based on circuit distance and capacity.
The total cost for each node and each circuit appears in its respective Cost Initial or Cost Per Period column in the Nodes table and Circuits table. The sum total of the node and circuit costs appears in the output of the Infrastructure Cost report and is used in its calculations.
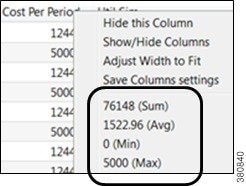
An easy way to see totals—as well as average, minimum, and maximum costs—without running the report is to right-click the Cost Initial or Cost Per Period column heading.
Setting Cost Properties
You can set these properties manually, as follows.

Step 1![]() Choose one or more nodes or one or more circuits. Right-click one of these objects and choose Properties, or double-click one of these objects.
Choose one or more nodes or one or more circuits. Right-click one of these objects and choose Properties, or double-click one of these objects.
Step 2![]() Click the appropriate tab:
Click the appropriate tab:
Step 3![]() Enter values in the Cost (initial) field, Cost (per period) field, or both, and click OK.
Enter values in the Cost (initial) field, Cost (per period) field, or both, and click OK.
Cost Circuit Initializer
The Cost Circuit initializer offers an automated way of setting circuit costs. For example, it lets you set realistic per-period circuit costs based on distance, capacity, or both.
The total cost for each circuit is the sum of the fixed cost plus the variable cost, where the variable cost is the result of multiplying the per-unit cost times the units selected (distance or capacity).
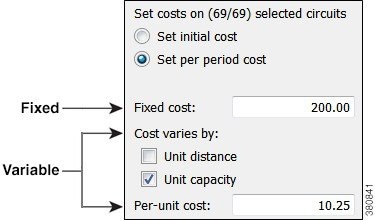
To access this initializer, choose Initializers > Circuit Cost. Options are as follows:
- Set cost—Set initial or per-period cost. The options that follow are applied to the choice selected here. Because initial and per-period costs are different values that do not overwrite each other, you can set one and then run the initializer again to set the other.
- Fixed cost—A static cost that is most often used when setting initial costs.
- Variable cost—A cost based on a circuit’s distance, capacity, or both. Whichever unit is selected (one or both), the value is multiplied by the “Per-unit cost” value.
–![]() Per-unit cost—Per-unit monetary cost.
Per-unit cost—Per-unit monetary cost.
–![]() Unit distance—Distance Sim value of the circuit.
Unit distance—Distance Sim value of the circuit.
Example: If only “Unit Distance” is selected, if the Distance Sim is 700, and if the “Per-unit cost” is 0.50, the variable value for this circuit is 700 x 0.50 = 350.00.
–![]() Unit capacity—Capacity Sim value of the circuit.
Unit capacity—Capacity Sim value of the circuit.
Example: If only “Unit Capacity” is selected, if the Capacity Sim is 400, and if the “Per-unit cost” is 0.25, the variable value for this circuit is 400 x 0.25 = 100.00.
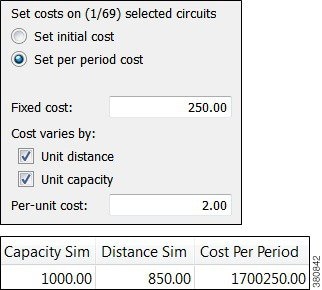
Example: This example sets a per-period cost for a circuit that has a fixed cost of 250, a per-unit cost of 2, circuit distance of 850, and a capacity of 1000. Including all of these options in the calculation, the cost of this circuit is:
Fixed + (Per-unit Cost x Distance Sim x Capacity Sim)
250 + (2 x 850 x 1000) = 250 + 1,700,250 = 1,700,250
Infrastructure Cost Report
To create an infrastructure cost report, follow these steps.
Step 1![]() For any node or circuits you want included in the report, set their initial or per-period costs. For more information, see Setting Cost Properties.
For any node or circuits you want included in the report, set their initial or per-period costs. For more information, see Setting Cost Properties.
Step 2![]() If creating a report for selected nodes or circuits, select them before opening the report dialog box.
If creating a report for selected nodes or circuits, select them before opening the report dialog box.
Step 3![]() Choose Tools > Reports > Cost Analysis.
Choose Tools > Reports > Cost Analysis.
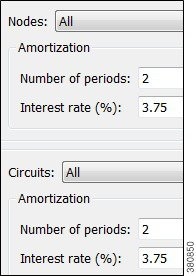
a.![]() Select whether to include all nodes, selected nodes, or specifically tagged nodes.
Select whether to include all nodes, selected nodes, or specifically tagged nodes.
b.![]() If you are calculating per-period costs, set the number of periods and the interest rate.
If you are calculating per-period costs, set the number of periods and the interest rate.
Using tags is a convenient way to determine costs for a specific region of the network or for specific customers.
a.![]() Select whether to include all circuits, selected circuits, or specifically tagged circuits.
Select whether to include all circuits, selected circuits, or specifically tagged circuits.
b.![]() If you are calculating per-period costs, set the number of periods and the interest rate.
If you are calculating per-period costs, set the number of periods and the interest rate.
Example Infrastructure Cost Workflow
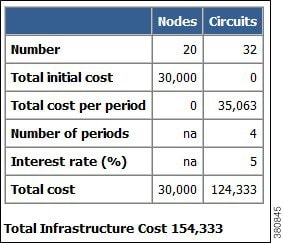
This example shows the generation of an Infrastructure Cost report based on a specific set of nodes and circuits, both tagged as the East Region. It sets initial costs on the nodes and per-period costs on the circuits based on their distance. The report is for 4 periods, and the interest rate is 5%.
Step 1![]() Set initial node costs in the node Properties dialog box.
Set initial node costs in the node Properties dialog box.
a.![]() Filter to the nodes containing the East Region tag.
Filter to the nodes containing the East Region tag.
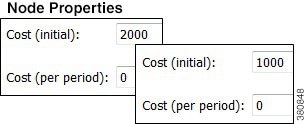
b.![]() In this example, there are 20 nodes with this tag. Set the 10 core nodes to an initial cost of 2000 each and the 10 edge nodes to an initial cost of 1000 each.
In this example, there are 20 nodes with this tag. Set the 10 core nodes to an initial cost of 2000 each and the 10 edge nodes to an initial cost of 1000 each.
The Nodes table lists these costs in the Cost Initial column. Right-click this column heading to see the total Cost Initial for all of these nodes (here, 30,000). Because we are only interested in initial node costs, this is the same value that the Infrastructure Cost report shows for total initial node cost.
Step 2![]() Run the Latency and Distance initializer to set Distance Sim values on the circuits (Initializers > Latency and Distance).
Run the Latency and Distance initializer to set Distance Sim values on the circuits (Initializers > Latency and Distance).
Step 3![]() Set per-period circuit costs using the Circuit Cost initializer on circuits tagged with East Region.
Set per-period circuit costs using the Circuit Cost initializer on circuits tagged with East Region.
a.![]() Filter to the circuits containing the East Region tag, and select these circuits.
Filter to the circuits containing the East Region tag, and select these circuits.
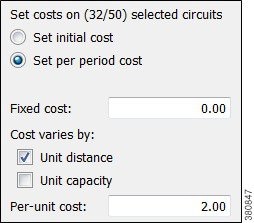
b.![]() Run the Circuit Cost initializer (Initializers > Circuit Cost). For this example, there are no fixed costs, a per-unit cost of 2, and the initializer is only using Distance Sim.
Run the Circuit Cost initializer (Initializers > Circuit Cost). For this example, there are no fixed costs, a per-unit cost of 2, and the initializer is only using Distance Sim.
The Circuits table lists these costs in the Cost Per Period column. Right-click this column heading to see the total Cost Per Period for all of these circuits. Here, it is 35,063.46, and this is the number that is amortized in the Infrastructure Cost report based on 4 periods with a 5% interest rate.
Step 4![]() Now that costs are set up for the region, generate the Infrastructure Cost report.
Now that costs are set up for the region, generate the Infrastructure Cost report.
a.![]() Choose Tools > Reports > Cost Analysis.
Choose Tools > Reports > Cost Analysis.
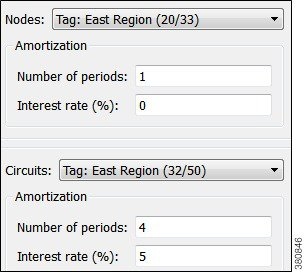
b.![]() Select the East Region nodes and circuits.
Select the East Region nodes and circuits.
c.![]() Because there are no per-period costs for nodes, no further node options are set.
Because there are no per-period costs for nodes, no further node options are set.
Set the circuits “Number of periods” to 4, and the “Interest rate (%)” to 5.
The resulting report performs these calculations:
- Sums the total initial costs for all nodes tagged with East Region to determine the total node cost.
- Sums the per-period costs for all circuits tagged with East Region to determine the total per-period circuit cost.
- Amortizes the per-period circuit costs across 4 periods using a 5% interest rate to determine the total circuit cost.
- Adds the total node cost to the total circuit cost to determine the total infrastructure cost.
Demand and Demand Grouping Costs
Two estimates of the monetary costs of demands are automatically derived when you set per-period costs for circuits, as follows. These appear as the following column headings in the Demands table:
- Cost by Capacity—Total of the Cost Per Period for the circuits using the demand as routed, scaled by proportion of demand traffic to the total interface capacity.
It is divided by two to share the circuit cost between the costs of traffic in two directions.
(Sum Cost Per Period of All Circuits Using the Demand) x (Demand Utilization on the Interface / 2)
Where demand utilization on the interface = (Interface Utilization / Capacity)
- Cost by Util—Total of the Cost Per Period for the circuits using the demand as routed, scaled by proportion of demand traffic to the total traffic through the circuit.
(Sum Cost Per Period of All Circuits Using the Demand) x (Demand Utilization on the Interface) / (Sum of the Utilizations on the Two Interfaces)
Where demand utilization on the interface = (Interface Utilization / Capacity)
If there is only one demand through the circuit, the full cost of that circuit is allocated to that demand.
Demand grouping costs are calculated when you run the Demand Grouping report (Tools > Reports > Demand Groupings). The Cost by Capacity and Cost by Util are the sum total of the costs of the demands within the demand grouping.
Example
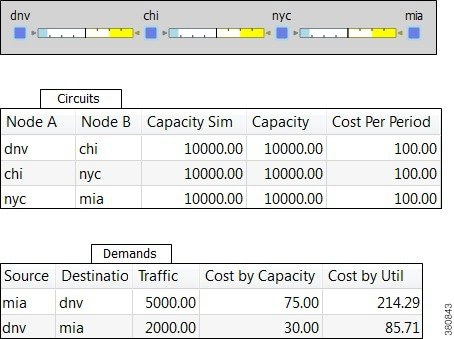
This example shows four nodes connected by three circuits.
- Each circuit has 10,000 Mbps capacity.
- Each circuit has a Cost Per Period of 100.
- There are two demands:
dnv-mia has 2000 Mbps of traffic.
mia-dnv has 5000 Mbps of traffic.

 Feedback