- Overview
- User Interface
- Plan Objects
- Traffic Demand Modeling
- Simulation
- Simulation Analysis
- Traffic Forecasting
- IGP Simulation
- MPLS Simulation
- RSVP-TE Simulation
- Segment Routing Simulation
- Layer 1 Simulation
- Quality of Service Simulation
- BGP Simulation
- Advanced Routing with External Endpoints
- VPN Simulation
- Multicast Simulation
- Metric Optimization
- LSP Optimization
- RSVP-TE Optimization
- Explicit and Tactical RSVP-TE LSP Optimization
- Segment Routing Optimization
- Capacity Planning Optimization
- L1 Circuit Path Optimization
- Changeover
- Patch Files
- Reports
- Cost Modeling
- Plot Legend for Design Layouts
Cisco WAE Design 7.0.1 User Guide
Bias-Free Language
The documentation set for this product strives to use bias-free language. For the purposes of this documentation set, bias-free is defined as language that does not imply discrimination based on age, disability, gender, racial identity, ethnic identity, sexual orientation, socioeconomic status, and intersectionality. Exceptions may be present in the documentation due to language that is hardcoded in the user interfaces of the product software, language used based on RFP documentation, or language that is used by a referenced third-party product. Learn more about how Cisco is using Inclusive Language.
- Updated:
- May 4, 2017
Chapter: Simulation Analysis
Simulation Analysis
The Simulation Analysis tool combines the simulation results of a large set of failure scenarios. These results are useful for determining how vulnerable a network is to congestion and high latencies under failures, thus allowing you to plan sufficient capacity for any given failure scenario.
Simulation Analysis is run across a set of failure scenarios that include selected objects, such as circuits, and traffic levels. WAE Design calculates these failure scenarios across all service classes. Each scenario is simulated and results in the following available analyses, which vary depending on whether the network has QoS parameters and depending on which options are selected when running the simulation.
- Worst-Case Traffic Utilization on interfaces per service class
- (Optional) VPN worst-case utilization and latency
- (Optional) Worst-Case Demand Latency
- Failure Impact, which analyzes the impact that each failed object has on interface utilizations throughout the network
Upon completion, a report window opens with a summary of each analysis, along with the list of simulations performed. Each time you run a simulation, this information is updated (replaced).
After performing a Simulation Analysis across multiple failure sets, you can fine-tune the analysis for a subset of failure scenarios and a subset of service classes without running a new analysis. For example, if you run a simulation for nodes, circuits, and ports, you can later go back and view the results for any one of those three objects. See Viewing Simulation Analysis on a Subset of Failure Scenarios or Service Classes.
Simulation Analysis can be performed under different simulation convergence modes (Fast Reroute, IGP and LSP Reconvergence, Autobandwidth Convergence, and Autobandwidth Convergence Including Failures), depending on which stage of the network recovery after failure is being investigated. The default simulation mode is IGP and LSP Reconvergence, and except where identified, the documentation describes this simulation mode. For more information, see RSVP-TE Simulation .
Worst-Case Traffic Utilization
The default analysis is to identify up to 10 failures for the worst-case utilization on each interface in the network.
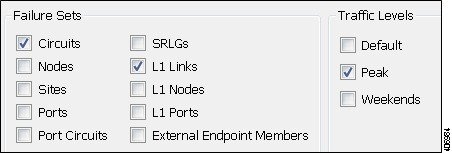
Worst case is the highest utilization that a particular interface experiences over all the failure sets and traffic levels that you selected. WAE Design also determines which combination of failures would cause this worst-case utilization.
Alternatively, you can record failures causing utilizations within a specified percent of the worst-case utilization.

Note![]() To control the number of threads that WAE Design processes in parallel when examining failure scenarios, set the “Maximum number of threads” field.
To control the number of threads that WAE Design processes in parallel when examining failure scenarios, set the “Maximum number of threads” field.
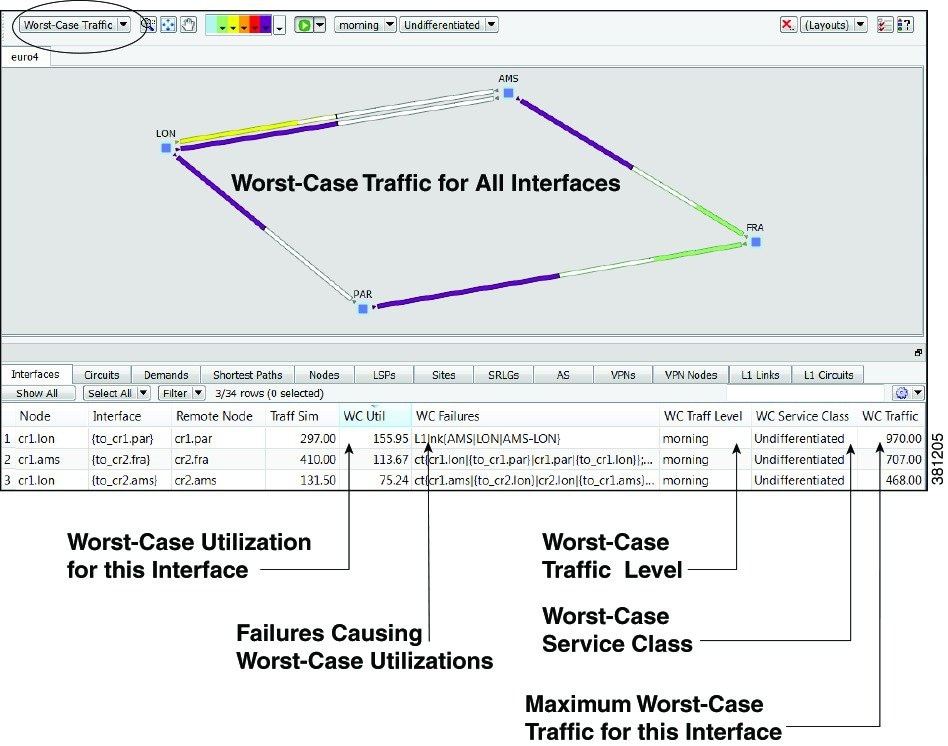
Upon finishing the analysis, WAE Design switches to the Worst-Case Traffic view and updates the plot to simultaneously display all worst-case failures (Figure 6-1). It also updates the following columns in the Interfaces and Circuits tables.
- WC Util—The worst-case utilization for that interface. The worst-case for a circuit is defined to be whichever of the worst cases of the two constituent interfaces results in the larger utilization. Thus, for circuits, this value is the larger of the WC Util values for the two interfaces in the circuit.
- WC Traffic—The actual traffic (Mbps) through the interface under the worst-case scenario.
- WC Traff Level—The traffic level under which this worst-case scenario occurs.
- WC Failure—List of one or more failures that cause the worst-case failure of the circuit. An easier way to read this list is to right-click an interface and choose Fail to WC.

Example: The circuit between cr1.lon to cr1.par, the cr1.lon node, and the L1 link between lon and par would all cause the worst-case utilization failure. ct{cr1.lon|to_cr1.par}|cr1.par|{to_cr1.lon}}; nd{cr1.lon};L1lnk{lon|par|lon-par}
If you record failures causing utilizations within a given percent of worst case, this column shows QoS violations as a percent. (See Worst-Case QoS Violations.) If the number is positive, then the allotted capacity has been surpassed. If negative, the capacity has not been surpassed. For example, if a circuit has 10,000 Mbps capacity, and if the amount of traffic on it as a result of three different failures is 11,000, 8000, and 4000 Mbps, the utilizations are 10%, –20%, and –60%, respectively and in descending order.

Example: The circuit between cr1.ams and cr2.lon is the worst-case failure and would cause this interface to exceed its capacity by 24.75%. The failure of the cr2.lon node would cause the interface traffic to go to its second highest utilization, which is 2.8% less than its capacity.
ct{cr1.ams|{to_cr2.lon}|cr2.lon|{to_cr1.ams}} (–24.75%);nd{cr2.lon} (2.8%)
For information on reading notation of objects within tables, see the Cisco WAE Design Integration and Development Guide.
- WC Service Class—The service class for which this worst-case scenario occurs. For information on running a Simulation Analysis with QoS, see Worst-Case QoS Violations.

Note![]() For information on worst-case calculations for VPNs, see VPN Simulation.
For information on worst-case calculations for VPNs, see VPN Simulation.
Figure 6-1 Worst-Case Traffic Utilization for All Interfaces
Worst-Case QoS Violations
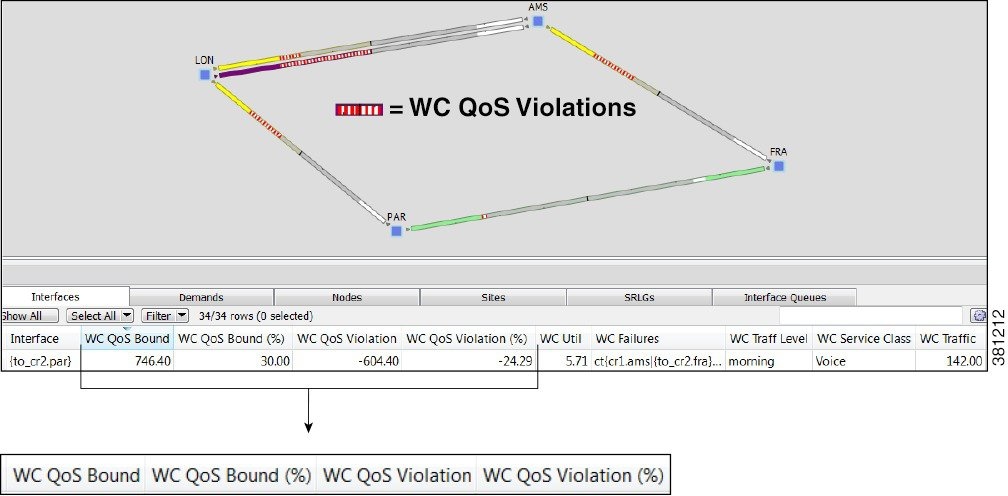
WAE Design includes QoS bound (maximum available capacity) as part of the worst-case calculations. If there are no QoS parameters set, then the QoS bound is 100% and violations occur if utilization goes over that 100%. However, if a worst-case policy has been set on a service class or if interface queue parameters have been set, then worst-case QoS violations are calculated. In these instances, WAE Design identifies the interface with the highest percentage of QoS violation as the worst-case possibility (Figure 6-2). The following columns are updated accordingly.
- WC QoS Bound—The worst-case interface capacity available without violating these QoS requirements. This value is based on available capacity, traffic utilization, worst-case policies set on service classes, and interface queue parameters. The WC QoS Bound (%) column identifies this same value as a percentage of the total capacity.
- WC QoS Violation—The worst-case traffic minus the worst-case capacity permitted (worst-case QoS bound). A violation occurs if the QoS capacity allotted through worst-case policies for service classes is exceeded or if QoS capacity allotted through interface queue parameters was exceeded. If the number appearing in the WC QoS Violation column is positive, then the allotted capacity has been surpassed. If negative, the capacity has not been surpassed. The WC QoS Violation (%) column identifies this same value as a percentage of total capacity.
To see the cause of worst-case QoS violations, right-click a circuit and choose Fail to WC. The table that appears lists all causes of this interface’s worst-case utilization and its worst-case QoS violations. Choose the worst-case failure to view, and click OK.
|
|
|
|---|---|
Figure 6-2 Worst-Case QoS Violations
Failing Circuits to Worst-Case Utilization
You have the option to selectively view each failure scenario that causes the worst-case utilization or worst-case QoS violation for a single interface.
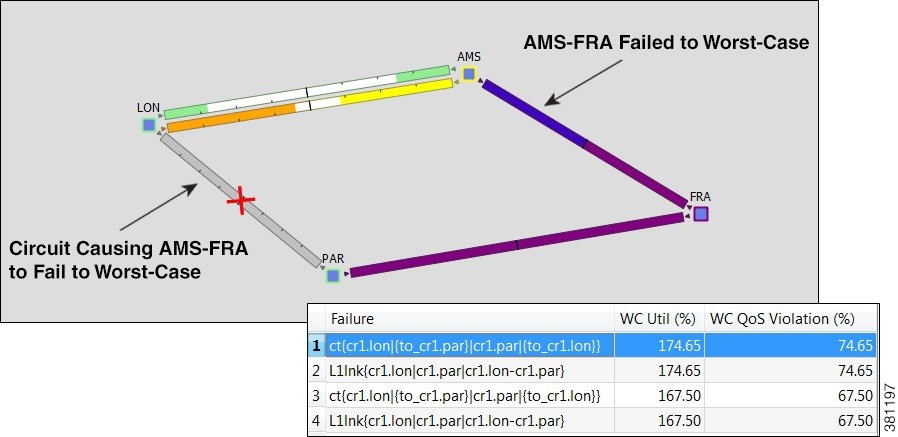
- Right-click an interface or a circuit and choose Fail to WC. If there is only one worst-case failure (listed in the WC Failure column), the object causing the worst-case utilization is listed. You can select it to fail it immediately.
If there are multiple possibilities for a worst-case failure, or if there is a range of failures within a percentage of the worst-case failure, a Worst-Case Failures dialog box lists each failure, its worst-case utilization percent, and its QoS violation percent (Figure 6-3). Choose the worst-case failure to view, and click OK. The network plot changes to show this particular failure scenario. If you choose to fail an L1 link or L1 node, switch to the L1 view to see the failure.

Note![]() If you choose an interface, you are actually failing its associated circuit to its worst case.
If you choose an interface, you are actually failing its associated circuit to its worst case.
- Alternatively, to filter to these worst-case failures for an interface without invoking a failure, right-click an interface or a circuit, choose Filter to > Filter to WC, and then choose the worst-case failure scenario of interest. If you fail this object from here, it achieves the same as if you had selected it from the Worst-Case Failures dialog box.
Figure 6-3 Failure of Single Circuit to Its Worst-Case
Worst-Case Demand Latency
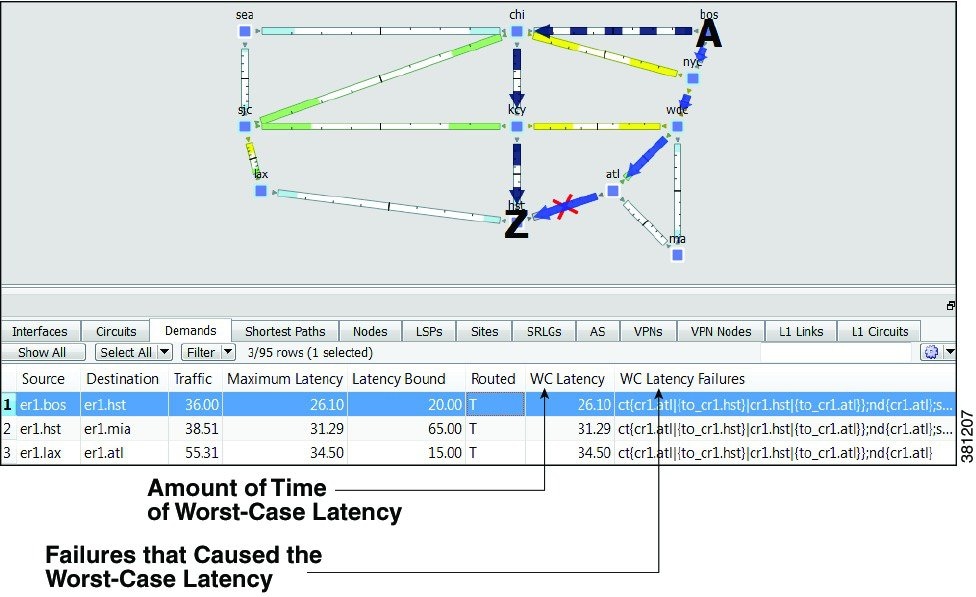
When running a Simulation Analysis, you have the option to simulate worst-case latency for each demand in the plan. WAE Design calculates the maximum latency of each demand under the failure scenarios selected. The result does not depend on service classes or traffic levels because demand routing is independent of these plans. The simulation also records the failures that cause this maximum latency.
The following columns in the Demands table are updated when you check Calculate demand worst-case latency for Simulation Analysis:
- WC Latency—The highest demand latency over all failure scenarios in the analysis.
- WC Latency Failures—The failures that caused this worst-case latency. Up to 10 failures are identified.
Failing Demands to Worst-Case Latency
After running Simulation Analysis to calculate demand worst-case latency, you have the option to fail a single demand to its worst-case latency. Right-click the demand and choose Fail to WC Latency (Figure 6-4).
Figure 6-4 Example of Worst-Case Demand Latency
Failure Impact
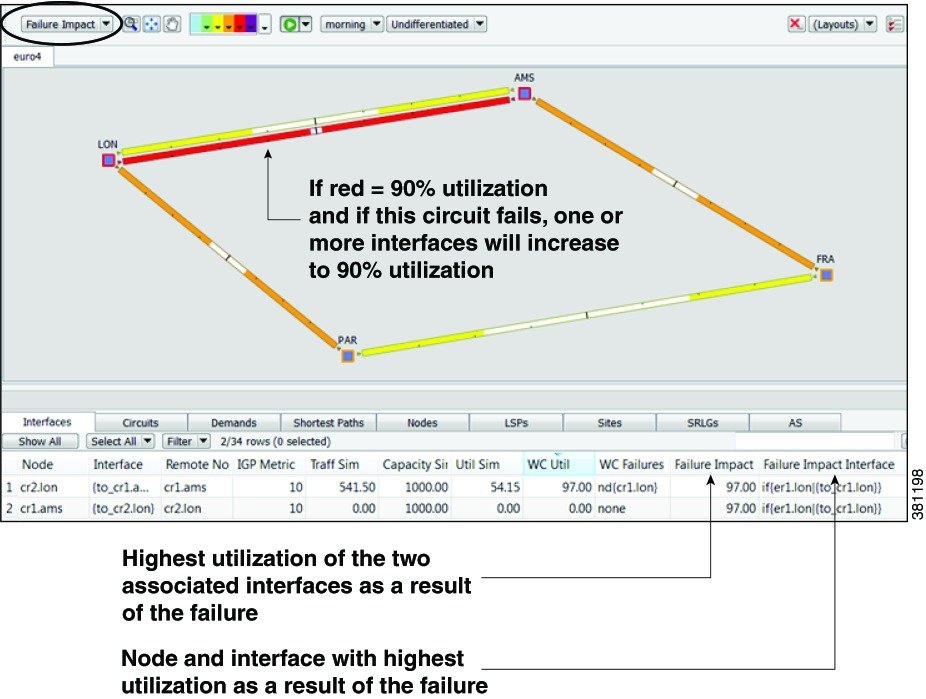
The Failure Impact view is available upon running a Simulation Analysis (Figure 6-5). The plot in this view colors the nodes and circuits according to the maximum utilization level that would be caused elsewhere in the network should the node or circuit fail. The color indicates the resulting utilization and severity of the congestion.
Example: In the Failure Impact view, a PAR-LON has a utilization of 90-100% and its color representation is red. This means that if If PAR-LON were to fail, one or more interfaces would react by exceeding a 90% utilization level and correspondingly, would turn red in the plot.
The Node, Interface, and Circuit tables contain the Failure Impact and Failure Impact Interface columns. In the Interfaces table, the information describes the failure impact of the circuit containing the interface.
- Failure Impact—The failure impact of each node or circuit. For example, if the value is 80%, it means that if this node or circuit failed, the resulting traffic utilization on one or more interfaces would exceed 80%.
- Failure Impact Interface—The interface that will experience the highest utilization as a result of the node or circuit going down.
Example: if{cr2.lon|to_cr1.ams} means if the circuit goes down, it will have the greatest traffic impact on the cr2.lon to cr1.ams interface.
If you are showing only an L3 view, site borders show the maximum utilization level that would be caused elsewhere in the network should nodes within it fail or should intrasite circuits within it fail. If you are showing a joint L3 and L1 view, site borders show the maximum utilization level that would be caused elsewhere in the network should a contained L3 node, L3 circuit, L1 node, or L1 link fail.

Note![]() The Failure Impact view only shows the impact of circuit and node failures. It does not show failures of other objects.
The Failure Impact view only shows the impact of circuit and node failures. It does not show failures of other objects.
Figure 6-5 Example Failure Impact
Simulation Analysis Reports
Each time Simulation Analysis is run, a report is automatically generated. You can access this information again by choosing Window > Reports. Note that new reports replace previous ones.
The Summary information details the options used in the analysis and summarizes the most important problems identified, such as QoS violations and latency bound violations.
The Simulations table lists each simulation that was performed in the Simulation Analysis ( Table 6-1 ).
Protecting Objects
To exclude an object from the list of those objects failed when performing a Simulation Analysis, you can mark it as Protected in its Properties dialog box. For example, if you want to run a Simulation Analysis only on core nodes, you could first protect all edge nodes. Note that you cannot protect an SRLG itself, though you can protect the objects within it.
You can protect nodes, sites, circuits ports, port circuits, external endpoint members, L1 links, and L1 nodes. You cannot protect SRLGs.
For information on protecting circuits from being failed as part of simple SRLG failures and as part of worst-case SRLG failure analysis, see Simulation Analysis .

Note![]() If you select an interface, you are actually protecting its associated circuit.
If you select an interface, you are actually protecting its associated circuit.
Step 1![]() Right-click one or more like objects from their respective tables.
Right-click one or more like objects from their respective tables.
Step 2![]() In the Properties dialog box, check the Protected check box to toggle it on or off. A check mark means the object is protected. Then click OK.
In the Properties dialog box, check the Protected check box to toggle it on or off. A check mark means the object is protected. Then click OK.
Running Simulation Analysis
The Simulation Analysis tool is the basis of four failure analysis options: worst-case utilization on interfaces, worst-case VPN utilization and latency, worst-case demand latency, and failure impact.
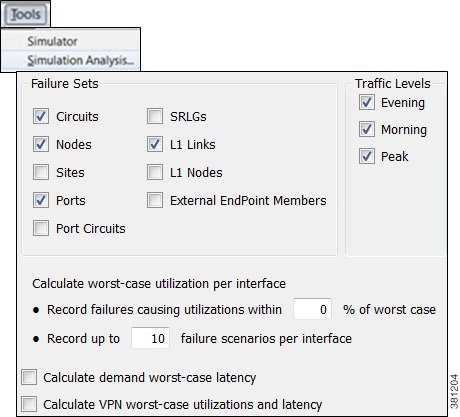

Note![]() Recording worst-case latencies or VPN worst-case utilizations increases the time it takes to perform a worst-case analysis.
Recording worst-case latencies or VPN worst-case utilizations increases the time it takes to perform a worst-case analysis.
Step 1![]() Choose Tools > Simulation Analysis.
Choose Tools > Simulation Analysis.
Step 2![]() Select one or more failure sets.
Select one or more failure sets.
Step 3![]() Select one or more traffic levels.
Select one or more traffic levels.
Step 4![]() In the Record failures causing utilizations within __% of worst case field, enter 0 to record only worst-case failures, or enter a number to find all failures causing utilizations within that percentage range of the worst-case failure.
In the Record failures causing utilizations within __% of worst case field, enter 0 to record only worst-case failures, or enter a number to find all failures causing utilizations within that percentage range of the worst-case failure.
Step 5![]() Define the maximum number of failure scenarios to record per interface. The default is 10.
Define the maximum number of failure scenarios to record per interface. The default is 10.
Example: If you record failures causing utilizations within 10% of the worst case, and if the worst-case utilization for an interface is 90%, then WAE Design records failures on this interface resulting in utilization of 81% or higher (90 -(90/10)). In this same scenario, if you record 10 failure scenarios per interface, and if there are failures that could cause utilizations of 90%, 85%, 82%, and 76% for an interface, WAE Design does not record the failure causing 76% utilization.
Step 6![]() Select whether or not to record demand worst-case latency calculations.
Select whether or not to record demand worst-case latency calculations.
Step 7![]() Select whether or not to record VPN worst-case utilizations and latencies. For more information, see VPN Simulation .
Select whether or not to record VPN worst-case utilizations and latencies. For more information, see VPN Simulation .
You can now use the Worst-Case Traffic view to analyze the worst-case traffic utilization, worst-case QoS violation, and worst-case latency information. Here you can also fail interfaces and nodes to their worst case, and fail demands to their worst-case latency. You can also use the Failure Impact view to identify the circuits that are responsible for worst-case traffic congestion.
Viewing Simulation Analysis on a Subset of Failure Scenarios or Service Classes
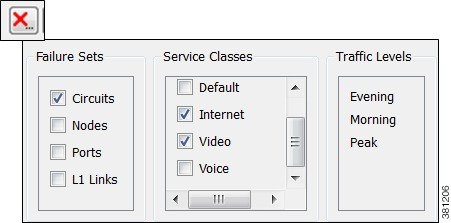
After running a Simulation Analysis, you can select a subset of failure scenarios or service classes, and view the results for just these subsets. This practice saves time because you do not have to rerun the analysis.
After running a Simulation Analysis, follow these steps:
Step 1![]() Click the red X in the top, right toolbar. A list of failure scenarios, service classes, and traffic levels appears. These are the options on which you last ran a Simulation Analysis.
Click the red X in the top, right toolbar. A list of failure scenarios, service classes, and traffic levels appears. These are the options on which you last ran a Simulation Analysis.
Step 2![]() Click one or more failure sets and service classes. Then click OK.
Click one or more failure sets and service classes. Then click OK.
If you need to change the traffic level selection, you must rerun a Simulation Analysis.
 Feedback