- Overview of Prime Network GUI clients
- Setting Up the Prime Network Clients
- Setting Up Change and Configuration Management
- Setting Up Vision Client Maps
- Setting Up Native Reports
- Setting Up Fault Management and the Events Client Default Settings
- Viewing Devices, Links, and Services in Maps
- Drilling Down into an NE’s Physical and Logical Inventories and Changing Basic NE Properties
- Manage Device Configurations and Software Images
- How Prime Network Handles Incoming Events
- Managing Tickets with the Vision Client
- Viewing All Event Types in Prime Network
- Cisco Path Tracer
- Managing IP Address Pools
- Monitoring AAA Configurations
- Managing DWDM Networks
- Managing MPLS Networks
- Managing Carrier Ethernet Configurations
- Managing Ethernet Networks Using Operations, Administration, and Maintenance Tools
- Monitoring Carrier Grade NAT Configurations
- Monitoring Quality of Service
- Managing IP Service Level Agreement (IP SLA) Configurations
- Monitoring IP and MPLS Multicast Configurations
- Managing Session Border Controllers
- Monitoring BNG Configurations
- Managing Mobile Transport Over Pseudowire (MToP) Networks
- Managing Mobile Networks
- Managing Data Center Networks
- Monitoring Cable Technologies
- Monitoring ADSL2+ and VDSL2 Technologies
- Monitoring Quantum Virtualized Packet Core
- VSS Redundancy System
- Icon Reference
- Permissions Required to Perform Tasks Using the Prime Network Clients
- Correlation Examples
- Managing certificates
- Ways You Can View Tickets and Events
- Interpreting the Badges and Colors of an NE
- Letting Others Know You Are Working on the Ticket (Acknowledging a Ticket)
- Troubleshooting a Ticket
- Getting a Ticket’s Troubleshooting Tips And Basic Information
- Checking the History of a Ticket and Its Associated Events
- Viewing a Ticket’s Affected Parties Tab (Resource Pairs)
- Viewing a Ticket’s Root Cause and Associated Events (Correlation Information)
- Finding Out How Many Devices Are Affected by a Ticket
- Viewing User-Entered Ticket Notes and Finding Out Who Changed the Ticket
- Checking the Online Documentation for Ticket Troubleshooting Information
- Using Built-in Troubleshooting Scripts and Tools
- Troubleshooting Device Reachability and Performance Issues
Managing Tickets with the Vision Client
Tickets represent attention-worthy fault scenarios that can consist of one event or a complete hierarchy of correlated events that all relate to the same fault. The Vision client provides extensive information on tickets and other network events of interest. These topics explain how to view and manage tickets and network events using the Vision client:
- Ways You Can View Tickets and Events
- Interpreting the Badges and Colors of an NE
- Letting Others Know You Are Working on the Ticket (Acknowledging a Ticket)
- Troubleshooting a Ticket
- Letting Others Know What is Being Done to Fix a Ticket
- Letting Others Know the Problem Was Fixed (Clearing a Ticket)
- Removing a Ticket from the Vision Client Display (Archiving a Ticket)
- Changing the Vision Client Behavior
Ways You Can View Tickets and Events
Tickets represent attention-worthy fault scenarios. Specifically, tickets are business objects that are created by Prime Network. A ticket can consist of one event, an event sequence (alarm), or a hierarchy of events and alarms that all correlate to a single root cause. A ticket uses the name of its root cause event—for example, a ticket with a Card Out root cause event would be named a Card Out ticket. When Prime Network receives an event—external events like traps and syslogs, or generated events that Prime Network detects when it polls the network—it verifies whether the new event can be correlated to (caused by) any existing alarms. If it can be correlated to an existing alarm and ticket, the alarm and ticket information is updated. If not, and the event is ticketable, Prime Network creates a new ticket. A ticket’s severity is equal to the highest-severity event associated with the root cause. A complete explanation of how Prime Network handles incoming events is provided in How Prime Network Correlates Incoming Events.
When you open a map, the tickets that apply to devices in the map are displayed at the bottom of the Vision client window under a Tickets tab. In addition, a Latest Events tab displays the most recent incoming events for devices in the map. For an example of this view, see Viewing Tickets and Latest Events for All Devices in a Map.
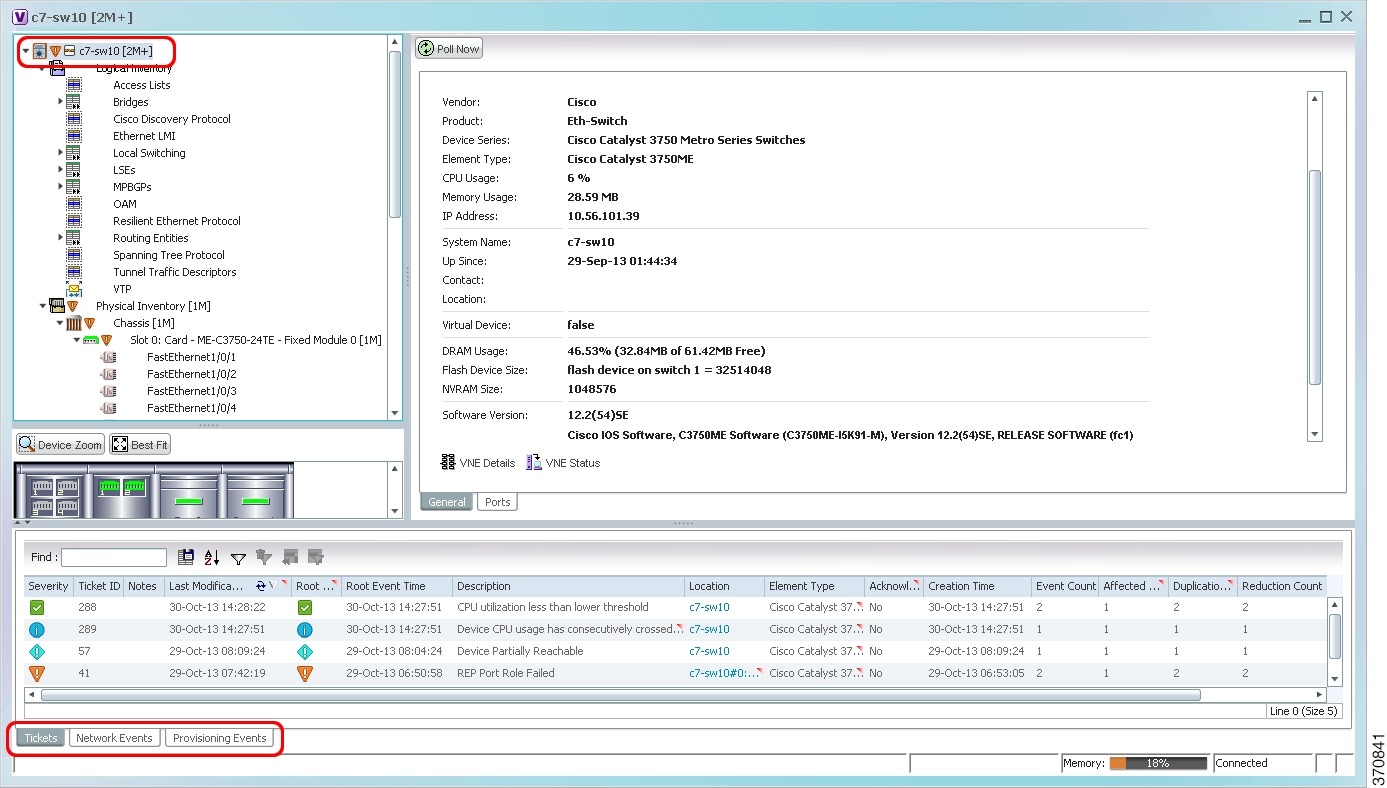
When you double-click a device in a map, the Vision client opens the device inventory view, and the view changes to display tickets only for the device. Next to the Tickets tab is a Network Events tab (for device Trap, Syslog, and Service events) and a Provisioning events tab (for changes made to the device). For an example of this view, see Viewing Tickets and Events for a Specific Device.
To view a ticket, double-click it, and the Vision client provides extensive details about the ticket. A series of tabs provide the ticket history, root cause and events correlated to the root cause, notes attached to the ticket, number of devices affected by the ticket, and more.
The following table provides some basic ways you can view tickets (and events), depending on what you are looking for. You can only view a device’s tickets if you have permission to view the device.
|
|
|
|
|---|---|---|
|
|
Open a map or list view in the Vision client and check the tabs at the bottom of the window. See Viewing Tickets and Latest Events for All Devices in a Map. |
|
The above information filtered according to location, description, last modification time, and many other variables |
Open a map in Vision client and, in the tickets table, create a filter. See The following table describes how regular and resynced events detail are displayed in Prime Network:. |
|
|
|
Double-click a device in Vision client and check the tabs at the bottom of the inventory window. |
Once a ticket is cleared (its root cause and all of the associated events are cleared), if no new events are associated to it for 1 hour, it is archived, which means it is no longer considered active. Only a subset of archived events can be viewed from the Vision client as described in these topics:
- Viewing Tickets and Latest Events for All Devices in a Map
- Viewing Tickets and Events for a Specific Device
For more information on archiving, see Clearing, Archiving, and Purging and the Oracle Database.
Viewing Tickets and Latest Events for All Devices in a Map
When you open a map, Prime Network displays a view similar to Figure 11-1. Note the Tickets tab and Latest Events tab at the bottom of the window (these tabs are also displayed in the List view).
Figure 11-1 Events Tabs for NEs in a Map
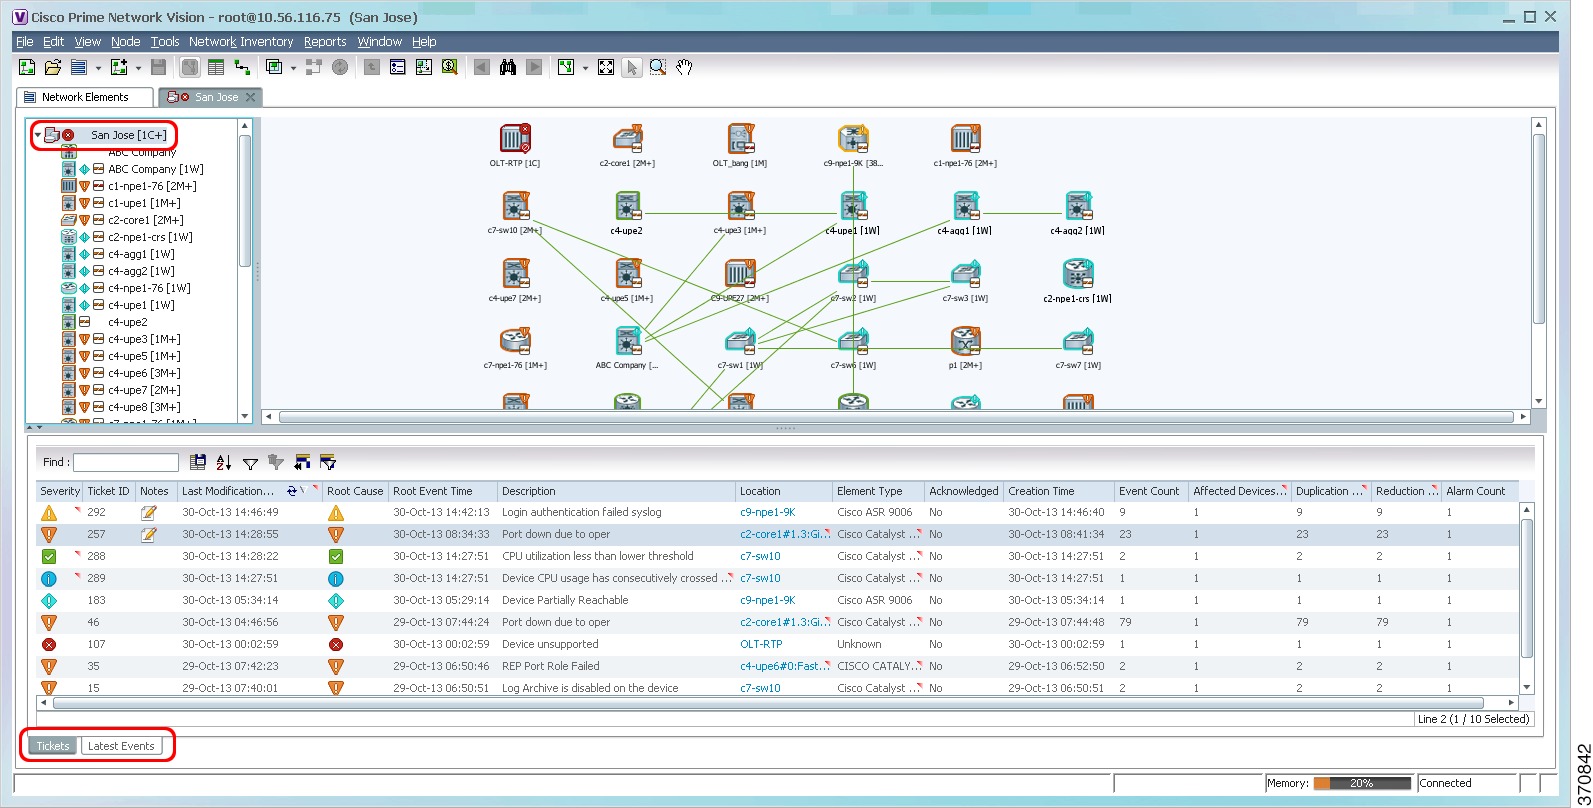
By default, the Vision client displays tickets and events from the past 6 hours. The Tickets tab lists the tickets for all devices in the map. You can find specific tickets using the robust ticket filter mechanism; see The following table describes how regular and resynced events detail are displayed in Prime Network:.
Tickets are listed according to their modification time, with the most recently modified ticket listed first. Events are stored in the database in Greenwich Mean Time (GMT) and are converted to match the time zone of the client location. The ticket table provides this information:
The Latest Events tab displays upgraded events (traps, syslogs, and Service events generated by Prime Network) as they occur. If an event is associated with a ticket, a hyperlink to the ticket properties is provided. If enabled (from the Administration client), the tab may also include standard events, which are events for which Prime Network only performs basic parsing; they are not processed for correlation. The Detection Type column tells you what kind of event it is (trap, syslog, and so forth). For information on those kinds of events, see Viewing Network Events (Service, Trap, and Syslog Events).
Viewing Tickets and Events for a Specific Device
To display the tickets related to a device and its components, double-click a device to open its inventory window, as shown in Figure 11-2. As you expand the inventory, colors and badges indicate any problems.
The tickets listed at the bottom of the window changes as you choose items from the navigation tree. For example, to view all of the device’s tickets, select the top-level device entry. If you select Physical Inventory, the Vision client only lists the tickets for any NEs in the physical inventory.
The Vision client also displays a Tickets, Network Events, and Provisioning Events tab at the bottom of the inventory window. Provisioning events reflect any device configuration operations or transactions (activation workflows) that have been executed on the device. The Network Events tab shows all traps, syslogs, and Service events for the device. For information on these other event types, see Viewing All Event Types in Prime Network.
In some cases, if an internal Prime Network component is stopped, or a device Prime Network is managing becomes unreachable, Prime Network will perform a resync when the component starts (or the device becomes reachable). The resync will capture the events that occurred during the down time and will include them in an Informational ticket. This behavior is currently supported for specific devices (for example, the Cisco ASR 5000 series running StarOS). For more information about the correlation and View/Access property for Resync alarm feature see, Viewing Resync Alarm Details in Prime Network
Figure 11-2 Vision Window Showing Device Inventory View and Events Tabs
The Tickets tab displays tickets for all devices in the map. To manage tickets, see Viewing Tickets and Events for a Specific Device. To create a ticket filter, see The following table describes how regular and resynced events detail are displayed in Prime Network:.
The Network Events tab displays incoming events that are being processed. Prime Network suspends processing for 2 minutes in order to allow correlation with incoming events. When correlation is finished, if an event is associated with a ticket, a hyperlink to the ticket properties is provided. This tab can also include standard events, which are events for which Prime Network only performs basic parsing; they are not processed for correlation. You can identify a standard event by its archive setting, which will be set to true.To create a filter for Network Events, see Permissions for Vision Client NE-Related Operations. For information on the traps, syslogs, and other network events displayed in this tab, see Viewing Network Events (Service, Trap, and Syslog Events).
If a ticket is not cleared for Resync Alarms, then you can manually clear the tickets.
The Provisioning Events tab displays events related to configuration changes that were made to the device. If you want to create a Provisioning Events filter, see Permissions for Vision Client NE-Related Operations. For more information on Provisioning events, see Provisioning Events (Device Configuration Results).
Viewing Resync Alarm Details in Prime Network
When full traps are created in Prime Network, events are processed as normal events. This allows the correlation information for all resynced events to be overwritten, and assigned to the resynced service alarm Ticket ID. The newly created events will have all the event properties similar to the original events rather than the standard event properties. You can view the Ticket ID in the Traps tab and the ticket history is displayed as a generic resync single event.

Note![]() On the Network Events tab, you can still view details of standard events that are created.
On the Network Events tab, you can still view details of standard events that are created.
The following table describes how events, traps, tickets details are displayed for Resync alarm tickets:
The following table describes how regular and resynced events detail are displayed in Prime Network:

Finding Tickets Using a Ticket Filter
A shown in Figure 11-3, the Vision client provides a robust filter tool to help you locate tickets using a variety of criteria. The filter locates tickets that meet the filter criteria. This procedure provides an overview of how to create a filter, and then remove it.
Note![]() The Vision client has global options that can affect filter behavior, such was how many events should be listed in the display. These settings are described in Setting Up Your Events View.
The Vision client has global options that can affect filter behavior, such was how many events should be listed in the display. These settings are described in Setting Up Your Events View.
Step 2![]() Click Tickets Filter in the ticket pane toolbar to open the Tickets Filter dialog box.
Click Tickets Filter in the ticket pane toolbar to open the Tickets Filter dialog box.
Figure 11-3 Ticket Filter Dialog Box
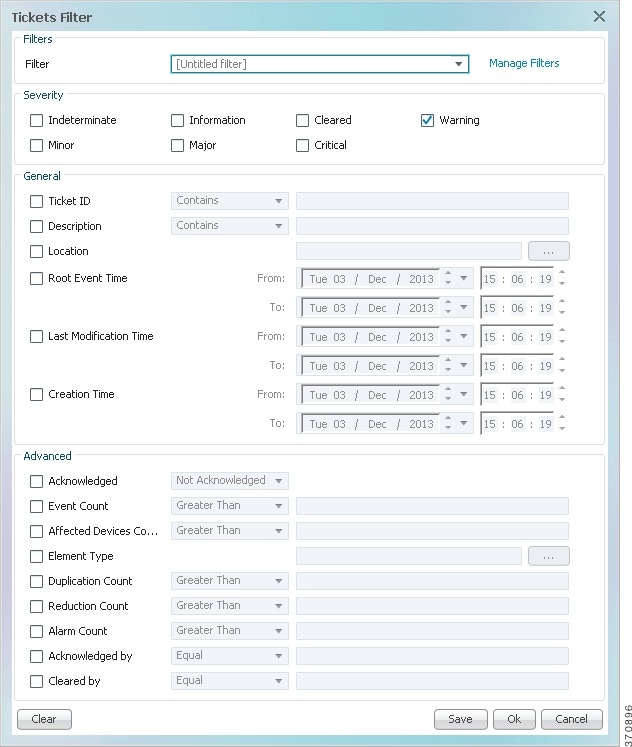
Step 3![]() To create a new filter, make sure that [Untitled filter] is chosen from the Filter drop-down list. (For an example of this list populated with filters, see Creating and Saving Filters for Tickets and Events.)
To create a new filter, make sure that [Untitled filter] is chosen from the Filter drop-down list. (For an example of this list populated with filters, see Creating and Saving Filters for Tickets and Events.)
a.![]() Check the check box for each criterion to use for filtering.
Check the check box for each criterion to use for filtering.
b.![]() As needed, choose the operator for the filter, such as Contains or Does Not Contain.
As needed, choose the operator for the filter, such as Contains or Does Not Contain.
c.![]() Supply the specific information to apply to the filter, such as the time, a string, or one or more IP addresses.
Supply the specific information to apply to the filter, such as the time, a string, or one or more IP addresses.
Step 4![]() If you want to save the filter so you can choose it from a drop-down list at another time, perform these steps:
If you want to save the filter so you can choose it from a drop-down list at another time, perform these steps:
Note![]() A filter is saved for later use only if you click Save. To simply apply the filter to the current display (without saving the filter), skip this step.
A filter is saved for later use only if you click Save. To simply apply the filter to the current display (without saving the filter), skip this step.
a.![]() Click Save and enter a name for the filter in the Save Filter dialog box. (Filters are listed alphabetically in the drop-down list; note that space is limited.)
Click Save and enter a name for the filter in the Save Filter dialog box. (Filters are listed alphabetically in the drop-down list; note that space is limited.)
b.![]() If you want other Vision client users to be able to use your filter, click Shared.
If you want other Vision client users to be able to use your filter, click Shared.
c.![]() Click OK in the Save Filter dialog box to save the filter for later use.
Click OK in the Save Filter dialog box to save the filter for later use.
Step 5![]() Click OK in the Tickets Filter dialog box to apply the filter to the current display.The tickets are displayed in the ticket pane according to the defined criteria, and Filter Enabled is displayed below the tickets table (see Determining Whether a Filter Is On and Turning It Off). Once you apply a ticket filter, it remains applied until you manually clear it.
Click OK in the Tickets Filter dialog box to apply the filter to the current display.The tickets are displayed in the ticket pane according to the defined criteria, and Filter Enabled is displayed below the tickets table (see Determining Whether a Filter Is On and Turning It Off). Once you apply a ticket filter, it remains applied until you manually clear it.
Note![]() An enabled filter stays enabled as you move between tabs. But if you log out of the client without saving the filter, it is discarded.
An enabled filter stays enabled as you move between tabs. But if you log out of the client without saving the filter, it is discarded.
Step 6![]() To remove the ticket filter:
To remove the ticket filter:
a.![]() Click Tickets Filter in the ticket pane toolbar.
Click Tickets Filter in the ticket pane toolbar.
For information on creating a filter for other events, see Creating and Saving Filters for Tickets and Events.
Interpreting the Badges and Colors of an NE
Color-coded icons reflect the severity of an NE’s ticket. Because multiple events can be associated with a ticket, ticket severity is determined by the associated event with the highest severity. You can view the severity for all of a ticket’s associated events in the ticket itself.
The following table shows the severity indicators.
|
|
|
|
|
|---|---|---|---|

|
Critical, Major, Minor, and Warning events are considered flagging events because they may require attention |
||

|
|||

|
|||

|
|||

|
|||

|
|||

|
These examples show how an NE with a Major ticket is displayed.
|
|
|
|
|
|---|---|---|---|

|

|
|
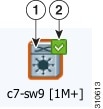
Example 1: Interpreting NE Badges and Colors
Figure 11-4 NE Colors and Badges—Example 1
|
|
|
|
|
|
|---|---|---|---|---|
| What is the most serious problem that has not been fixed yet? |
Icon color —Represents NE’s most serious ticket that has not been cleared |
The NE has at least one major ticket that has not been cleared. |
This MDS device has a major ticket that has not been cleared yet. |
|
Badge at top right of NE—Color represents NE’s most serious ticket that is unacknowledged (no one is aware of it) |
The most serious problem that no one is aware of has already been cleared. |
|||
To summarize Figure 11-4:
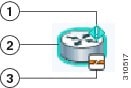
Example 2: Interpreting NE Badges and Colors
Figure 11-5 NE Colors and Badges—Example 2
|
|
|
|
|
|
|---|---|---|---|---|
Badge at top right of NE—Color represents NE’s most serious ticket that is unacknowledged (no one is aware of it) |
No one is aware that this Cisco 7600 router has a warning ticket. |
|||
Icon color —Represents NE’s most serious ticket that has not been cleared |
The NE still at least one warning ticket that has not been cleared. |
This Cisco 7600 router has a warning ticket, and it is still a problem. |
||
Badge at bottom right of NE—Represents device reachability and how fully the NE has been modeled |
NE is in the “Device Partially Reachable” communication state. |
Prime Network cannot fully communicate with the Cisco 7600 device. |
||
To summarize Figure 11-5:
- The Cisco 7600 router has a warning ticket that has not been cleared.
- The Cisco 7600 router has an unacknowledged warning ticket.
- The Cisco 7600 router is only partially reachable.
This tells you that someone needs to acknowledge the warning ticket and start fixing it (see Letting Others Know You Are Working on the Ticket (Acknowledging a Ticket)). It also tells you that the device reachability problem could be the cause of the warning ticket. For information on device reachability and communication states, see Troubleshooting Device Reachability and Performance Issues.
For troubleshooting steps, see Troubleshooting a Ticket.
For a complete list of all icons and badges, see Appendix A, “Icon Reference” .
Letting Others Know You Are Working on the Ticket (Acknowledging a Ticket)
When you acknowledge a ticket, it signals to other Vision client users that someone else is working on the problem. The easiest way to check whether a ticket has been acknowledged is from the ticket table (at the bottom of the Vision client window).
If a new event is correlated to an acknowledged ticket, the ticket status changes to Modified and the ticket must be acknowledged again.
To acknowledge a ticket, right-click the ticket and choose Acknowledge. The change is indicated in all clients connected to the gateway, and the ticket’s User Audit tab is updated to say you acknowledged the ticket.
If you acknowledge a ticket by mistake, you can undo it by right-clicking the ticket and choosing Deacknowledge.
Troubleshooting a Ticket
The following table provides a basic workflow for troubleshooting a ticket. Prime Network provides a variety of ways you can get more information about and troubleshoot a ticket. Some of these tools require special permissions; see Permissions Required to Perform Tasks Using the Prime Network Clients.
Note![]() Tickets are stored in the database in Greenwich Mean Time (GMT) but are converted to match the time zone of the client location.
Tickets are stored in the database in Greenwich Mean Time (GMT) but are converted to match the time zone of the client location.
|
|
|
|
|---|---|---|
Get any troubleshooting help that is embedded in the ticket and basic information (when the event was detected, its location, and so forth). |
Getting a Ticket’s Troubleshooting Tips And Basic Information |
|
View a chronological listing of all of the events in a ticket. |
||
Identify which service resources (pairs) are affected by the ticket. (Only populated for events that calculate impact analysis.) |
||
Display a hierarchy of events with the root cause at the top. |
Viewing a Ticket’s Root Cause and Associated Events (Correlation Information) |
|
Find out how many devices the ticket affected and view them on a map or in a list view. |
||
View any ticket notes entered by other users, and find out who changed the ticket (acknowledge, clear, and so forth). |
Viewing User-Entered Ticket Notes and Finding Out Who Changed the Ticket |
|
Check the Prime Network documentation site. It contains event-specific documentation that can be helpful. |
Checking the Online Documentation for Ticket Troubleshooting Information |
|
Check your deployment for built-in troubleshooting tools. If they are available, you should be able to launch them by right-clicking the NE and choosing Commands. |
||
If you have sufficient permissions to use the Events client, search in the database for similar tickets on the same NE. |
Finding Archived Tickets, Service Events, Syslogs, and Traps |
|
For reachability issues, check the device connectivity information provided in the client. This includes: Also check the VNE investigation state, which represents the extent to which the device and its components were discovered and modeled. |
||
Getting a Ticket’s Troubleshooting Tips And Basic Information
A ticket’s Details tab provides specific information about the probable cause, action to be taken, and clearing conditions for the ticket. This information is provided in the Details tab’s Troubleshooting field.
The Details tab also provides a snapshot of the ticket—where the problem is, when the problem was first detected, when the ticket was created, and how many alarms (event sequences) are associated with the ticket, and so forth.
This table describes some of the fields in the Details tab that may not be self-explanatory.
|
|
|
|---|---|
Hyperlink to the entity that triggered the root-cause alarm (the hyperlink is provided only if you have permission to view the location). |
|
Number of uncleared alarms associated with the ticket. For example, 3/4 means three of the ticket’s four alarms are still not cleared. |
|
Whether someone is aware of the ticket, with the user name in parentheses.
|
|
Checking the History of a Ticket and Its Associated Events
The History in chronological order, every instance of each event associated with a ticket. If the ticket has more than one alarm, you can also drill down to get the alarm details and history by double-clicking the alarm ID. The following table provides a subset of the information provided.
The Advanced tab provides the ticket’s totals for the same information:
|
|
|
|---|---|
(For flapping) Sum of the duplication counts for all events and alarms in the ticket. For example, a ticket with the following Link Down Flapping alarms on three different network elements would have a duplication count of 9: NE 1: Link down -> link up -> link down -> link up -> link down -> link up |
|
(For flapping) Sum of the reduction counts for all events and alarms in the ticket. Using the previous example, the ticket would have a reduction count of 18. |
|
Total number of devices affected by the ticket. To view the devices in a map, see the procedure in Troubleshooting a Ticket. |
|
Total number of alarms associated with the ticket (includes the root alarm) |
For more information about how Prime Network processes flapping events, see How Prime Network Correlates Incoming Events.
Viewing a Ticket’s Affected Parties Tab (Resource Pairs)
The Affected Parties tab lists service resources (pairs) that are affected by an event, alarm, or ticket. This information is only populated for events that calculate impact analysis. If it is calculated for the event, the tab lists of all the endpoints that are affected in the Source area and a Destination areas. This includes business tags and IP addresses. If the NE is an IP interface, the subinterface IP address is displayed.
The tab also reports affected status, which represents the degree of certainty that the pair will be impacted. Affected Status can be one of the following:
- Potential—The service might be affected (for example, rerouting may prevent any problem).
- Real—The service is affected.
- Recovered—The service has recovered. This state applies only to entries that were marked previously as potentially affected. It indicates only the fact that there is an alternate route to the service, regardless of the service quality level.
If any entries begin with the word Misconfigured, it means the flow has stopped unexpectedly between the source and destination points. (An unexpected termination point can be a routing entity, bridge, or VC switching entity.) Because the link does not terminate as expected, the link is not actually impacted. Check the configuration and status of the affected termination points to make sure there are no errors.
As time progresses and more information is accumulated from the network, Prime Network updates the information to indicate which of the potentially affected parties are real or recovered.
For more information on impact analysis, including how Prime Network reports events and alarms that affect the same resource pairs, see How Prime Network Calculates and Reports Affected Parties (Impact Analysis).
Viewing a Ticket’s Root Cause and Associated Events (Correlation Information)
The Correlation tab displays the root cause and all of the events it caused presented in a hierarchy with the ticket’s root cause at the top. The ticket takes the name of the root cause. If you want to view the historical chronology for the events and alarms in a ticket, click the ticket’s History tab.
From here you can also launch windows for individual alarms and events. Each alarm and event will have its own set of tabs: Details, History, Correlation, Affected Parties, and so forth.
Figure 11-6 shows a correlation tree for a Card Down ticket.
Figure 11-6 Correlation Tree for Card Out Ticket
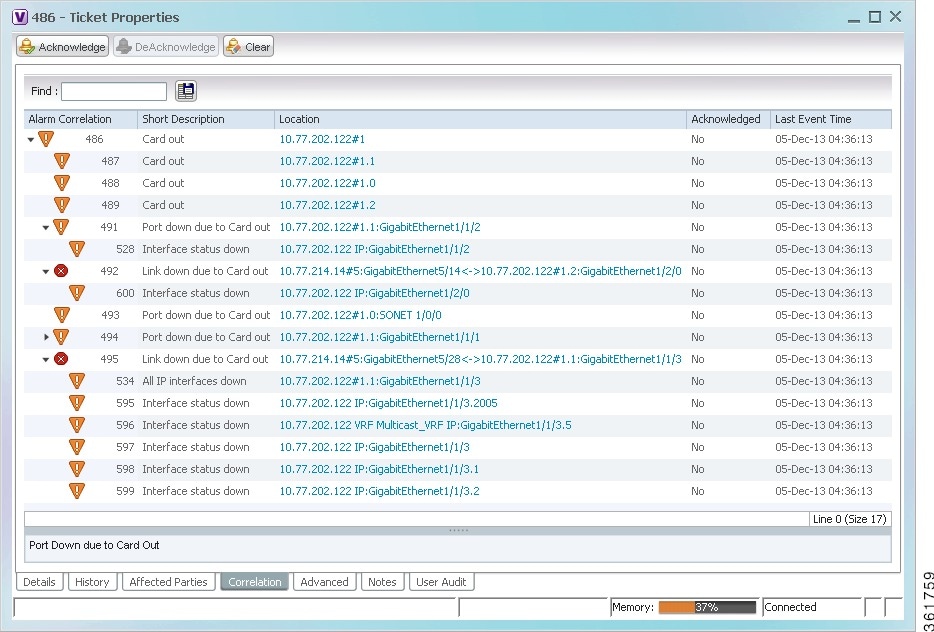
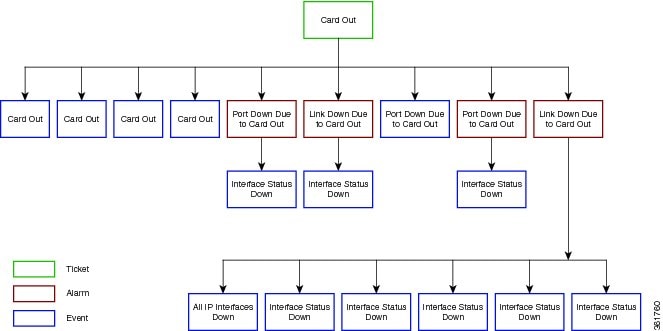
Figure 11-7 illustrates the same correlation tree. The Link Down Due to Card Out alarm is the cause of the Interface Status Down event, and the Card Out alarm is the cause of the Link Down Due to Card Out alarm. The Card Out alarm is also the root cause for all of the events; thus this is a Card Out ticket.
Figure 11-7 Alarms and Events in the Card Out Ticket
Finding Out How Many Devices Are Affected by a Ticket
When a fault occurs, Prime Network automatically calculates the affected devices and embeds this information in the ticket in the Advanced tab. If you want to get a quick visual representation of the affected NEs, use the Find Affected Elements feature, which is launched from the tickets table.
Right-click a ticket in the ticket pane and choose Find Affected Elements.
Viewing User-Entered Ticket Notes and Finding Out Who Changed the Ticket
The Notes tab can contain any free text entered by other users. Once a user has added some notes, the notes cannot be deleted. If used correctly, it can contain helpful information that is not automatically collected by Prime Network.
The User Audit tab lists any users who have acknowledged, deacknowledged, cleared the ticket, or added notes to the ticket, and when the operation was performed. This is a good way to find out who may have already worked with this ticket.
Checking the Online Documentation for Ticket Troubleshooting Information
In addition to checking the Troubleshooting field in the Details tab, you may find additional information as follows:.
- Check the correlation examples in Event Correlation Examples. Even if the event you are experiencing is not described, these examples can help you understand how faults are correlated.
- Check the event-specific reference documentation on Cisco.com :
Using Built-in Troubleshooting Scripts and Tools
The NE may have some built-in troubleshooting scripts that can be launched by right-clicking the NE and choosing Commands. Helpful scripts and commands may be available from that menu. These commands are documented throughout this guide under the technology or topology they apply to. For information on which devices and device software support the commands, see the Addendum: Additional VNE Support for Cisco Prime Network 5.2.
For example, to check device reachability, you can use the NE right-click Tools menu to run a ping or Telnet. These tools contact the device from the client machine.The devices that support the following commands are listed in the Addendum: Additional VNE Support for Cisco Prime Network 5.2. Whether you can run these commands depends on your permissions. See Permissions for Vision Client NE-Related Operations.
If you are using Windows 7, you must enable the windows telnet client before you can use the Prime Network telnet option. The telnet communicates with the device using the telnet window from the client station.
To enable the windows telnet client:
Step 1![]() From the Start menu, choose Control Panel > Turn Windows features on or off.
From the Start menu, choose Control Panel > Turn Windows features on or off.
The Turn Windows features on or off dialog box appears.
Step 2![]() Check the Telnet Client check box.
Check the Telnet Client check box.
The devices that support the following commands are listed in the Addendum: Additional VNE Support for Cisco Prime Network 5.2. Whether you can run these commands depends on your permissions. See Permissions for Vision Client NE-Related Operations.
|
|
|
|
|---|---|---|
Performs a traceroute to a destination address, showing how many hops were required and how long each hop takes. |
||
Pings a specified IP address to see if the IP address is accessible. |
||
OAM > Traceroute VRF1 |
Performs a traceroute from selected VRF to a destination address, showing how many hops were required and how long each hop takes. |
|
|
|
Troubleshooting Device Reachability and Performance Issues
These topics provide some guidance for responding to problems with reachability and performance:
Checking the Device State
These topics explain how to troubleshoot reachability issues and identifying the source of a communication problem:
Checking the VNE Management State Badge
Tickets can result from device connectivity issues, or if Prime Network cannot fully discovery a device for various reasons. These kinds of problems are signaled by a badge at the bottom right of the device icon. For example, a router that is partially reachable by the Vision client is displayed as illustrated in Figure 11-8.
Figure 11-8 Element with Device Partially Reachable Badge

This badge represents the VNE management state. In the Prime Network model, each device is represented by one Virtual Network Element (VNE) that contains a complete model of the device. VNEs are created by system administrators using the Administration client. After a VNE is created and started, Prime Network investigates the network element and automatically builds a live model of it including its physical and logical inventory, configuration, and status. As different VNEs build their model, a complete model of the network is created.
This VNE managements state badge represents:
- VNE communication state, which represents the status of connectivity between the device and Prime Network.
VNE investigation state, which represents the extent to which the device and its components were discovered. Table 11-3 lists the VNE communication states and their icons. The table describes the default behavior. (Administrators can change the settings that determine when a device is considered partially or fully unreachable; refer to the Cisco Prime Network 5.2 Administrator Guide.) In most cases, rectifying these problems will require the support of your system administrator.


Table 11-4 lists the VNE investigation states, which describe the degree to which Prime Network could discover and model the device.
|
|
|
|
|---|---|---|

|
The device type is either not supported by Prime Network or is misconfigured. |
|

|
The VNE model is inconsistent with the device because a required device command failed, even after repeated retries. A common cause of this state is that the device contains an unsupported module. |
|

|
The VNE model is inconsistent with the device; however, this is often recoverable, or may indicated a small inconsistency (such as a minor inventory component not being properly modeled). It could also be due to a more serious issue, such as an inability to reach a configured protocol on the device. Because this state can be due to a variety of reasons, check the VNE Status Details window for more information (see Checking the Communication Between the VNE and the Device). |
|

|
The VNE is building the model of the device (the device type was found and is supported by Cisco Prime Network). A VNE remains in this state until all device commands are successfully executed at least once, or until there is a discovery timeout. |
|

|
VNE polling was suspended because it was manually moved to this state by an Administration client user. The VNE remains in this state until it is manually restarted. A VNE in the maintenance state has the following characteristics:
The VNE is moved to the Stopped state if there are changes in other Prime Network components (for example, Prime Network is restarted). |
|

|
The VNE has been stopped or deleted by the user, and the VNE is terminating its connection to the device. |
|
The VNE has a stable model of the device. Modeling may not be fully complete, but there is enough information to monitor the device and make its data available to other applications, such as transactions (activation workflows). A VNE remains in this state unless it is stopped or moved to the maintenance state, or there are device errors. |
||
The VNE process has terminated (it will immediately move to Defined Not Started). |
||
The VNE is managed and support of its device type is being validated. |
||
A new VNE was created (and is starting); or an existing VNE was stopped. A VNE remains in this state until it is started (or restarted). |
Checking the VNE Status to See If It Is an Internal Prime Network Problem
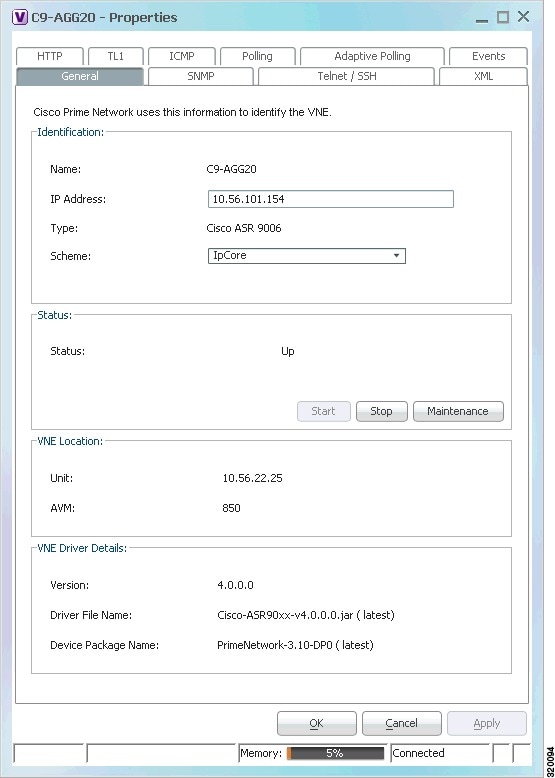
To check the status of the device’s VNE, open the inventory window and click VNE Status in the properties pane. Figure 11-9 provides an example of a VNE properties window. This VNE is modeling a Cisco 3620 router.
Note![]() VNE status is not the same as device status. A device may be fully reachable and operating even though a VNE status is Down, Unreachable, or Disconnected.
VNE status is not the same as device status. A device may be fully reachable and operating even though a VNE status is Down, Unreachable, or Disconnected.
If the VNE status is down, the device may still be fully operational. This indicates a problem in Prime Network, not the device.
Figure 11-9 VNE Properties Window
Checking the Communication Between the VNE and the Device
To check the status of the communication between the device and the VNE that is modeling it, open the inventory window and click VNE Details in the properties pane. Figure 11-10 provides an example of a VNE Status Details window.
Figure 11-10 VNE Status Details Window
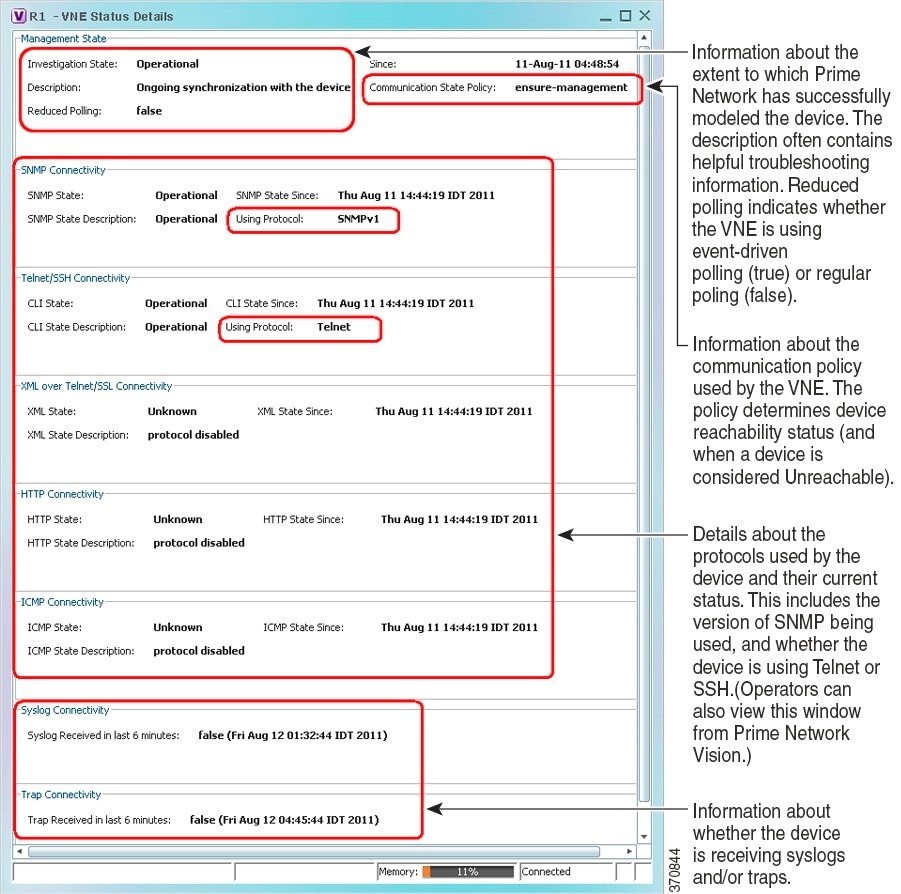
The VNE Status Details window provides this information about the VNE:
- Its management connectivity state, which has to do with how the VNE was configured
- The protocols the VNE is using to communicate with the device and the status of each
- Whether the device is generating syslogs or traps
In the Management State area, if the Reduced Polling field is true, this means updates are driven by incoming events. If the Investigation State is Currently Unsynchronized, perform a manual device poll by clicking Poll Now in the inventory window.
For more information on this topic, see the Cisco Prime Network 5.2 Administrator Guide.
Using Ping, Telnet, and Trace Route
To check device reachability, you can use the NE right-click Tools menu to run a ping or Telnet. These tools contact the device from the client machine. The devices that support these commands are listed in the Addendum: Additional VNE Support for Cisco Prime Network 5.2. Whether you can run these commands depends on your permissions. See Permissions for Vision Client NE-Related Operations.
Note![]() If you are using Windows 7, you must enable the windows telnet client before you can use the Prime Network telnet option. See Using Built-in Troubleshooting Scripts and Tools.
If you are using Windows 7, you must enable the windows telnet client before you can use the Prime Network telnet option. See Using Built-in Troubleshooting Scripts and Tools.
|
|
|
|
|---|---|---|
Performs a traceroute to a destination address, showing how many hops were required and how long each hop takes. |
||
Pings a specified IP address to see if the IP address is accessible. |
||
OAM > Traceroute VRF2 |
Performs a traceroute from selected VRF to a destination address, showing how many hops were required and how long each hop takes. |
|
|
|
Checking Device Memory and CPU Usage
The Vision client provides a tool that displays memory and CPU usage information for a device or network element, including its history. To open the CPU usage graph:
Step 1![]() Right-click a network element in the navigation tree and choose Tools > CPU Usage.
Right-click a network element in the navigation tree and choose Tools > CPU Usage.
The CPU Usage dialog box displays the following information:
Step 2![]() If desired, click Save to CSV File to export the displayed data.
If desired, click Save to CSV File to export the displayed data.
Step 3![]() Click the upper right corner to close the CPU Usage dialog box.
Click the upper right corner to close the CPU Usage dialog box.
Prime Network also provides a web-based Monitoring tool for administrators that tracks how the gateway, units, and individual AVMs are operating—Java heap, dropped messages, CPU usage, and so forth. This information is provided in graphical form and you can use it to locate and diagnose problems. This tool is described in the Cisco Prime Network 5.2 Administrator Guide.
Letting Others Know What is Being Done to Fix a Ticket
Update the ticket notes to advise others of any actions you performed towards fixing the ticket. When you add a note, a note icon appears next to the ticket so that other users can see that a note is available. If a ticket affects several devices, you must have sufficient permissions on the device that contains the ticket’s root alarm.
Note![]() You cannot remove notes once you have added them to a ticket.
You cannot remove notes once you have added them to a ticket.
When you update a ticket’s notes, earlier content is moved to the Previous Notes section (with the name of the user who added the note and the time it was added). If the user is an external user (for example, a Netcool user), the username will be displayed in the following format:
Letting Others Know the Problem Was Fixed (Clearing a Ticket)
Tickets can be cleared manually or automatically, as described in the following topics. Once a ticket is cleared, it remains active for 1 hour (default). If any incoming events are correlated to the ticket during this time, the ticket is reopened. If no incoming events are correlated to it, the ticket is removed from the display and archived. (The optional ticket locking mechanism can also affect whether new events can be associated with a ticket; see How Events and Tickets are Purged from the Oracle Database.) Once a ticket is archived, it is considered to be inactive. Archived tickets cannot be reopened; if an event recurs, a new ticket is opened
For more details about these actions, see Clearing, Archiving, and Purging and the Oracle Database.
Manually Clearing Tickets
You can manually clear a ticket by right-clicking it and choosing Clear. The ticket description changes to Cleared due to Force Clear and all events are marked as acknowledged. The ticket’s User Audit tab will display the name of the user who cleared the ticket. Whether you can manually clear a ticket depends on your permissions; see Permissions for Business Tags and Business Elements (Vision and Events Clients).
Note![]() Do not choose Clear and Remove unless you are sure you want to archive the ticket. The remove operation cannot be reversed.
Do not choose Clear and Remove unless you are sure you want to archive the ticket. The remove operation cannot be reversed.
By default, cleared tickets are removed from the display (and archived) if no new events have associated to the tickets for 1 hour. This archive setting is not overriden by the ticket locking mechanism (which, if enabled, specifies at how many minutes a cleared ticket will be locked, meaning no new events can associate to it—for example, 20 minutes). Choosing Clear and Remove does override the 60-minute auto-archive setting. If you remove the ticket and one of its events recur, Prime Network will open a new ticket. See Removing a Ticket from the Vision Client Display (Archiving a Ticket).
Automatically Clearing Tickets
Every 60 seconds, a clearing mechanism checks all tickets to see if the ticket’s root cause is cleared. If the root cause and all of the ticket’s associated events are cleared, the mechanism clears (and acknowledges) the entire ticket.
Situations can occur in which a ticket’s root cause is cleared, but one of the ticket’s associated events is not cleared—for example, because of a missed syslog or a device reachability problem. For this reason, events have an auto-cleared registry setting. (The registry contains configuration settings for Prime Network components and features.) If the uncleared event’s auto-cleared setting is true, the mechanism clears the event. Then the entire ticket can be cleared.
Prime Network has an additional ticket auto-clear mechanism, but it is disabled by default. It clears tickets depending on their severity. This mechanism is controlled from the Administration client and is described in the Cisco Prime Network 5.2 Administrator Guide.
Removing a Ticket from the Vision Client Display (Archiving a Ticket)
When a cleared ticket is removed from the Vision client, it is archived and is no longer considered active. Archiving means the ticket and all of its associated events are moved from an active partition to an archive partition in the database. Once a ticket is archived, if any of the archived ticket’s associated events recur, a new ticket is opened. Archived tickets are never reopened. Details about the Prime Network archiving and purging mechanism are provided in Clearing, Archiving, and Purging and the Oracle Database.
Automatically Archiving Tickets
By default, cleared tickets are automatically removed from the Vision client when they have remained clear (no new events have associated to them) for 1 hour. Prime Network has an auto-archiving mechanism that runs every 60 seconds and archives any tickets that meet any of the following criteria.
|
|
|
|---|---|
No new events were associated to the cleared ticket in the past 1 hour. Note Manually removing a ticket overrides this setting and archives the ticket immediately. However, the ticket locking mechanism does not override this setting. The locking mechanism specifies the interval at which new events can no longer associate to a cleared ticket (for example, if the ticket has been cleared for 20 minutes) The locking mechanism is disabled by default. See How Events and Tickets are Purged from the Oracle Database. |
|
The ticket has more than 150 events associated with one of its alarms. (Prime Network also generates a System event 15 minutes before it archives the ticket.) |
|
Prime Network found more than 1500 large tickets. (Prime Network also generates a System event as it approaches this number.) |
|
Manually Removing Tickets
Note![]() Do not choose Remove unless you are sure you want to archive the ticket. The remove operation cannot be reversed.
Do not choose Remove unless you are sure you want to archive the ticket. The remove operation cannot be reversed.
You can manually remove cleared tickets from the display by right-clicking a ticket and choosing Remove. This removes the ticket and all of its associated events, and archives them. This operation overrides the 60-minute auto-archive setting described in the previous topic.
Remember that if you remove a ticket:
- The remove operation cannot be reversed.
- If any of the ticket’s associated events recur, Prime Network will open a new ticket instead of updating the ticket your removed.
Whether you can manually remove a ticket depends on your permissions; see Permissions for Business Tags and Business Elements (Vision and Events Clients).
Changing the Vision Client Behavior
All users can change their Vision client defaults. The defaults apply only to the client machines—that is, the machine from which you launch the Vision client. You can change the following ticket-related behavior:
- Enabling audio alerts and sounds
- Adjusting the ticket severity information that is displayed with an NE icon
- Controlling the age of tickets that are displayed in the Vision client
To change these settings, see Changing Vision Client Default Settings (Sound, Display, Events Age).
If Prime Network is being used with Prime Central, it is possible to disable ticket management operations from the Vision client. When these operations are disallowed, users can only manage the ticket lifecycle through BQL or the external OSS. For more information, see the discussion about setting up event monitoring in the Cisco Prime Network 5.2 Administrator Guide.
 Feedback