- Overview of Prime Network GUI clients
- Setting Up the Prime Network Clients
- Setting Up Change and Configuration Management
- Setting Up Vision Client Maps
- Setting Up Native Reports
- Setting Up Fault Management and the Events Client Default Settings
- Viewing Devices, Links, and Services in Maps
- Drilling Down into an NE’s Physical and Logical Inventories and Changing Basic NE Properties
- Manage Device Configurations and Software Images
- How Prime Network Handles Incoming Events
- Managing Tickets with the Vision Client
- Viewing All Event Types in Prime Network
- Cisco Path Tracer
- Managing IP Address Pools
- Monitoring AAA Configurations
- Managing DWDM Networks
- Managing MPLS Networks
- Managing Carrier Ethernet Configurations
- Managing Ethernet Networks Using Operations, Administration, and Maintenance Tools
- Monitoring Carrier Grade NAT Configurations
- Monitoring Quality of Service
- Managing IP Service Level Agreement (IP SLA) Configurations
- Monitoring IP and MPLS Multicast Configurations
- Managing Session Border Controllers
- Monitoring BNG Configurations
- Managing Mobile Transport Over Pseudowire (MToP) Networks
- Managing Mobile Networks
- Managing Data Center Networks
- Monitoring Cable Technologies
- Monitoring ADSL2+ and VDSL2 Technologies
- Monitoring Quantum Virtualized Packet Core
- VSS Redundancy System
- Icon Reference
- Permissions Required to Perform Tasks Using the Prime Network Clients
- Correlation Examples
- Managing certificates
Monitoring Quality of Service
Quality of Services (QoS) is the technique of prioritizing traffic flows and specifying preferences for forwarding packets with higher priority. It prioritizes traffic flow for different applications, users, or data flows and ensures certain level of performance to a data flow. This service plays an important part when the network capacity is insufficient, especially for real time streaming multimedia applications such as VoIP, online games, and IP-TV.
In Prime Network, you can view all the services configured for the selected network element in the QoS node under logical inventory.
The QoS Node under logical inventory is made up of two sub-nodes—the Policy Container and the Class of Service container. Both these sub-nodes are explained in greater detail in the following sections.
Viewing the Service Policy and Policy Group Profiles
The Policy Container node in the logical inventory lists all the available service groups and service policies that are associated with service templates, BBA groups, and subscriber access points.
To view the service policy and policy group profiles:
Step 1![]() Right-click on the required device and choose the Inventory option.
Right-click on the required device and choose the Inventory option.
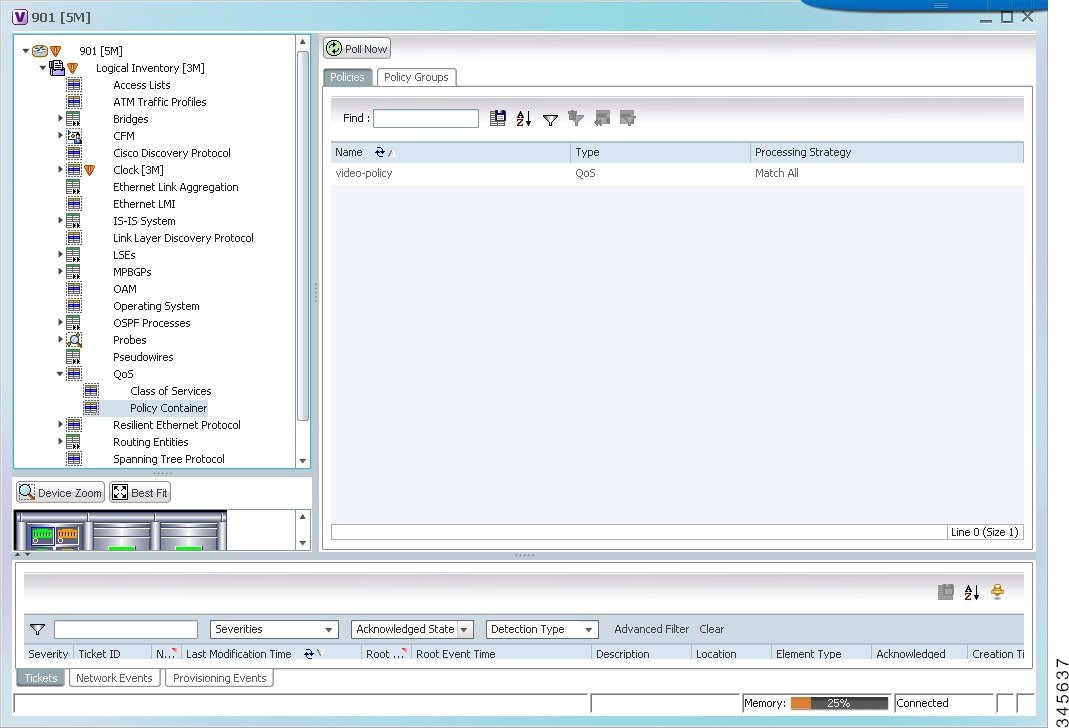
Step 2![]() In the Inventory window, choose Logical Inventory> QoS> Policy Container. The Policies tab is displayed by default in content pane, which lists the existing policies are displayed as shown in Figure 21-1.
In the Inventory window, choose Logical Inventory> QoS> Policy Container. The Policies tab is displayed by default in content pane, which lists the existing policies are displayed as shown in Figure 21-1.
Step 3![]() Right-click the policy and choose Properties. The Service Policy Properties window is displayed.
Right-click the policy and choose Properties. The Service Policy Properties window is displayed.
Table 21-1 describes the fields that are displayed in the Service Policy Properties window.
Step 4![]() Close the Service Policy Properties window.
Close the Service Policy Properties window.
Step 5![]() In the content pane, click the Policy Group tab. A list of existing groups are displayed.
In the content pane, click the Policy Group tab. A list of existing groups are displayed.
Step 6![]() Right-click the policy group and choose Properties.
Right-click the policy group and choose Properties.
Table 21-2 describes the fields in the Policy Group tab.
Step 7![]() In the Policies tab, Right-click the policy from the list and choose Properties. The Service Policy Properties dialog box is displayed. See Table 21-1 for more details.
In the Policies tab, Right-click the policy from the list and choose Properties. The Service Policy Properties dialog box is displayed. See Table 21-1 for more details.
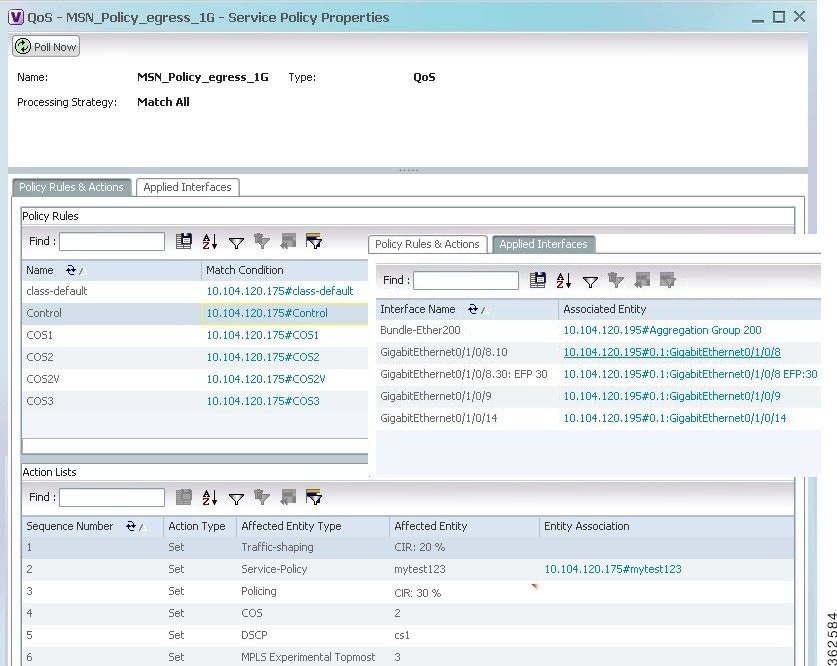
Figure 21-2 shows the association between the policy and interface.
Figure 21-2 Policy and Interface Association
Viewing the Class of Services Profile
Step 1![]() Right-click on the device and choose the Inventory option.
Right-click on the device and choose the Inventory option.
Step 2![]() In the Inventory window, choose Logical Inventory > QoS > Class of Services. A list of existing policies are displayed in the content pane.
In the Inventory window, choose Logical Inventory > QoS > Class of Services. A list of existing policies are displayed in the content pane.
Step 3![]() Right-click a service in the list and choose Properties. The Class of Services Properties dialog box is displayed. You can click on the tabs to view more details.
Right-click a service in the list and choose Properties. The Class of Services Properties dialog box is displayed. You can click on the tabs to view more details.
Table 21-3 describes the fields that are displayed in the Class of Services Properties dialog box.
Viewing Ingress and Egress Speed Details
Traffic shaping technique is used to match device and link speeds, thereby controlling packet loss, variable delay, and link saturation, which can cause jitter and delay. Traffic shaping must be applied to all outgoing traffic on a physical interface or on a VLAN. Traffic shaping is implemented when packets are ready to be transmitted on an interface. Traffic shaping is applied on the subinterfaces of the layer 2 and layer 3 when QoS policy is applied.
To view the ingress and egress details when QoS policy is applied on the subinterfaces:
Step 1![]() In the Inventory window, choose Physical Inventory.
In the Inventory window, choose Physical Inventory.
Step 2![]() Select an interface in layer 2 or layer 3.
Select an interface in layer 2 or layer 3.
Step 3![]() Select a subinterface for which you want to view the ingress and egress speed details.
Select a subinterface for which you want to view the ingress and egress speed details.
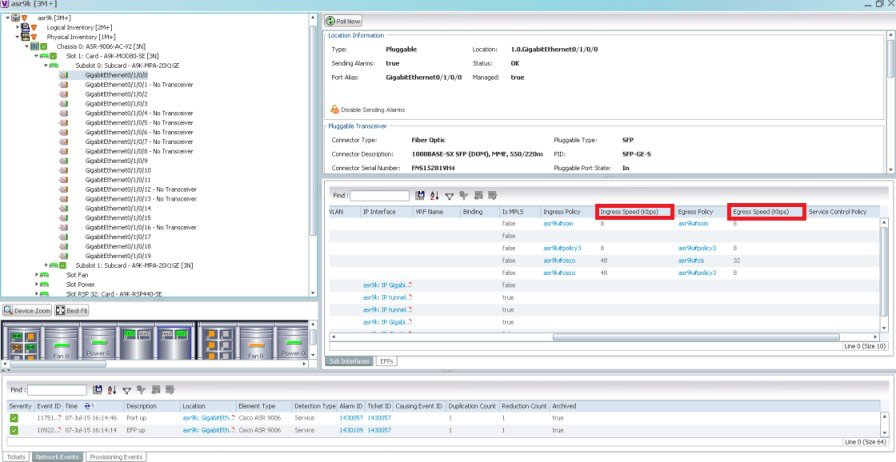
Step 4![]() Click the EFP tab or Sub Interface tab to view the speed details of the subinterface mapped on layer 2 or layer 3 respectively. Figure 21-2 shows the speed details on a subinterface.
Click the EFP tab or Sub Interface tab to view the speed details of the subinterface mapped on layer 2 or layer 3 respectively. Figure 21-2 shows the speed details on a subinterface.
The following table provides information about the fields that are not self-explanatory.
Table 21-4 describes the fields that are not self-explanatory
|
|
|
|---|---|
The traffic shaping of the outgoing packets in an interface. |
|
The traffic shaping of the incoming packets in an interface. |

Note![]() Ingress policy, egress policy, ingress speed, and egress speed are supported in Cisco ASR 9000 devices but ingress policy and ingress speed are not supported in Cisco ASR 903 device and egress policy and egress speed are not supported in Cisco ASR 901 device
Ingress policy, egress policy, ingress speed, and egress speed are supported in Cisco ASR 9000 devices but ingress policy and ingress speed are not supported in Cisco ASR 903 device and egress policy and egress speed are not supported in Cisco ASR 901 device
 Feedback