- Overview of Prime Network GUI clients
- Setting Up the Prime Network Clients
- Setting Up Change and Configuration Management
- Setting Up Vision Client Maps
- Setting Up Native Reports
- Setting Up Fault Management and the Events Client Default Settings
- Viewing Devices, Links, and Services in Maps
- Drilling Down into an NE’s Physical and Logical Inventories and Changing Basic NE Properties
- Manage Device Configurations and Software Images
- How Prime Network Handles Incoming Events
- Managing Tickets with the Vision Client
- Viewing All Event Types in Prime Network
- Cisco Path Tracer
- Managing IP Address Pools
- Monitoring AAA Configurations
- Managing DWDM Networks
- Managing MPLS Networks
- Managing Carrier Ethernet Configurations
- Managing Ethernet Networks Using Operations, Administration, and Maintenance Tools
- Monitoring Carrier Grade NAT Configurations
- Monitoring Quality of Service
- Managing IP Service Level Agreement (IP SLA) Configurations
- Monitoring IP and MPLS Multicast Configurations
- Managing Session Border Controllers
- Monitoring BNG Configurations
- Managing Mobile Transport Over Pseudowire (MToP) Networks
- Managing Mobile Networks
- Managing Data Center Networks
- Monitoring Cable Technologies
- Monitoring ADSL2+ and VDSL2 Technologies
- Monitoring Quantum Virtualized Packet Core
- VSS Redundancy System
- Icon Reference
- Permissions Required to Perform Tasks Using the Prime Network Clients
- Correlation Examples
- Managing certificates
- Who Can Launch the Events Client
- Ways You Can View Events
- Interpreting Event Severity Indicators
- Creating and Saving Filters for Tickets and Events
- Finding Archived Tickets, Service Events, Syslogs, and Traps
- Viewing Network Events (Service, Trap, and Syslog Events)
- Viewing Tickets
- Viewing Non-Network Events (Audit, Provisioning, System and Security Events)
- Viewing Standard Traps and Syslogs Not Recognized by Prime Network
- Changing How Often Event Information is Refreshed
- Exporting Events Data
- Changing the Events Client Defaults
Viewing All Event Types in Prime Network
An event is a distinct incident that occurs at a specific point in time. Some events can indicate an error, failure, or exceptional condition in the network. How Prime Network responds to fault events is described in How Prime Network Correlates Incoming Events. Prime Network also provides extensive details about other events it receives—device configuration changes, activations, and changes in Prime Network components. Advanced users can use the Events client to view all event types—Traps, Syslogs, Tickets, Service events, Provisioning and Audit events, and System and Security events.
These topics explain how to view all of the event types in Prime Network:
- Who Can Launch the Events Client
- Ways You Can View Events
- Interpreting Event Severity Indicators
- Creating and Saving Filters for Tickets and Events
- Determining Whether a Filter Is On and Turning It Off
- Viewing Network Events (Service, Trap, and Syslog Events)
- Viewing Tickets
- Viewing Non-Network Events (Audit, Provisioning, System and Security Events)
- Changing How Often Event Information is Refreshed
- Exporting Events Data
- Changing the Events Client Defaults
Who Can Launch the Events Client
By default, only users with Administrator privileges can use the Events client. Users with lesser privileges can log into the Events client only if the required privileges have been reset from the Administration client. For more information, see the description of the Registry Controller in the Cisco Prime Network 5.2 Administrator Guide.
Events are sorted by date, with the newest item displayed first. Tickets are listed according to their modification time, with the most recently modified ticket listed first. Events are stored in the database in Greenwich Mean Time (GMT) but are converted to match the time zone of the client location.
By default, the Events client displays events from the past 2 hours. This is controlled from the Events client Options dialog. To protect performance, do not change the display time frame to more than 2 hours. For information on this and other client options, see Setting Up Your Events View.
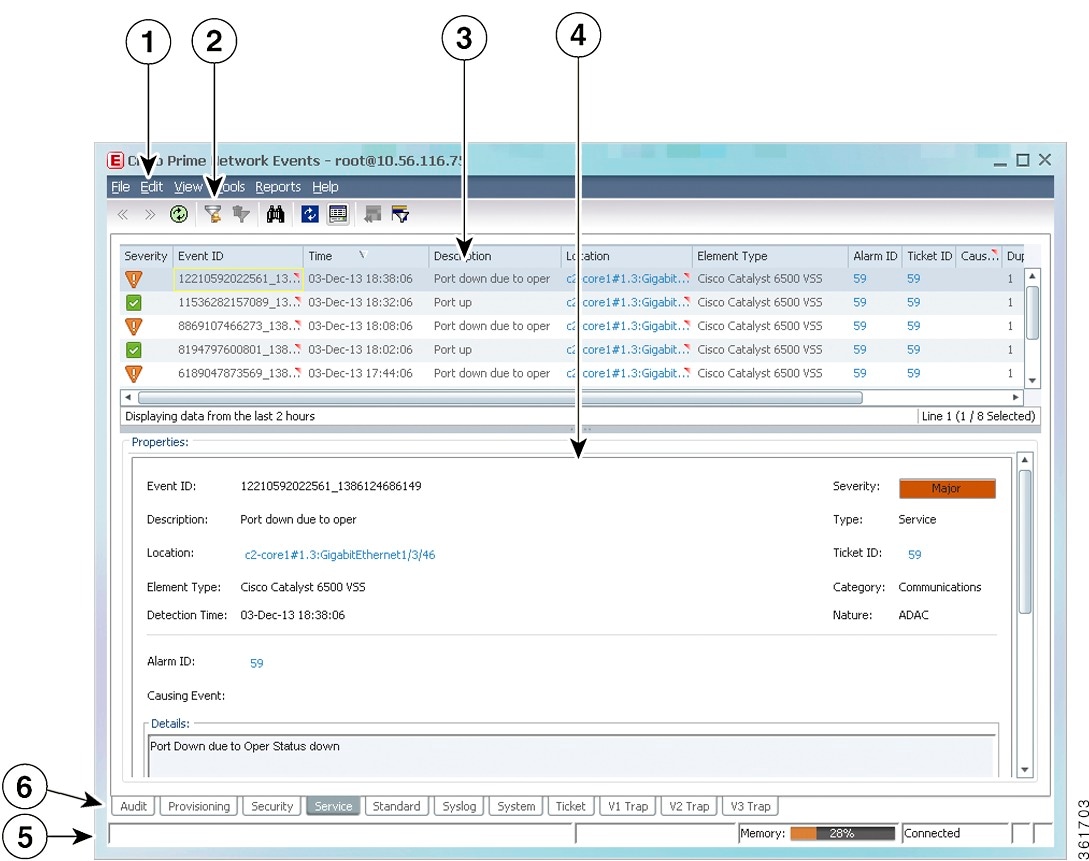
Figure 12-1 provides an overview of the Events client window.
Figure 12-1 Events Client Window
Ways You Can View Events
Events are displayed according to event categories, which are represented by tabs in the Events client. By default, the Events client displays events that occurred in the last 2 hours (or up to 50 events per table).
The following table provides some examples of the ways you can use the Events client.
Event Types and Categories
Each event tab displays basic information, including severity, event ID, time, and description. In addition, most event tabs show the Location parameter, which indicates the entity that triggered the event, with a hyperlink to the entity’s properties. The following table describes the event categories in the Events client.
You can also open the optional All tab that displays a flat list of all events and tickets by choosing File > Open All Tab).
|
|
|
|
|
|---|---|---|---|
|
|
An attention-worthy root cause alarm handled by Prime Network. |
||
|
|
|||
Syslogs received from devices (IOS syslogs, ACE syslogs, Nexus syslogs, ASR syslogs, UCS syslogs, and so forth) and handled by Prime Network. These syslogs are parsed and Prime Network attempts to correlate them. |
|||
| SNMPv1, v2, and v3 traps received from devices (ASR traps, IOS, traps, MIB 2 traps, Nexus traps, CPT traps, and so forth). These traps are parsed and Prime Network attempts to correlate them. |
|||
Traps and syslogs that Prime Network cannot match with any of the rules that define events of interest; they are not processed for correlation. |
|||
|
|
Configuration commands that are executed on the Prime Network gateway (NE right-click commands, CCM and Compliance Audit operations, and so forth). |
Viewing Non-Network Events (Audit, Provisioning, System and Security Events) |
|
Configuration and provisioning activities, including CCM, Command Manager, and Transaction Manager. |
|||
Client login and user activities related to manage the system and the environment (user accounts, device scopes, logging in and out, password issues, unit changes. |
|||
Prime Network and its components (for example, reachability events, database-related events, system overload prevention steps, and so forth. |
Interpreting Event Severity Indicators
Prime Network clients use the same indicators and colors to signal events and tickets in the network. The following example shows a Service events table in the Events client. The colors and badges in the Severity column indicate the seriousness of the event.
Figure 12-2 Events Client with Event Severity Indicators
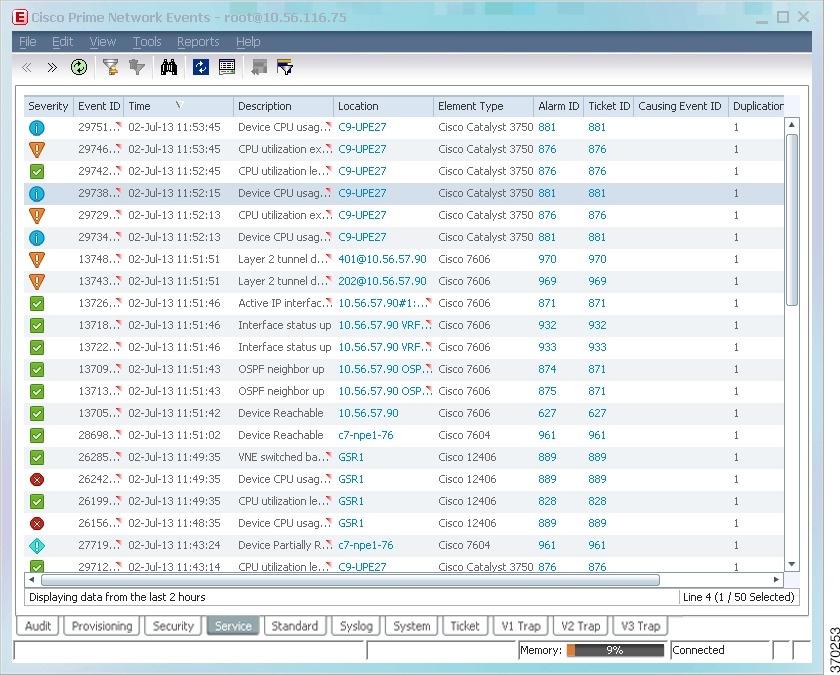
The following table shows the event severity indicators. The same colors and indicators are used for all event types—System, Audit, Tickets, Syslogs, and so forth.
|
|
|
|
|
|---|---|---|---|

|
Critical, Major, Minor, and Warning events are considered flagging events because they may require attention |
||

|
|||

|
|||

|
|||

|
|||

|
|||

|
Creating and Saving Filters for Tickets and Events
These topics explain how to create and manage filters:
- Creating a New Filter and Saving It
- Determining Whether a Filter Is On and Turning It Off
- Modifying Saved Filters and Managing the Filter List
Both the Events client and Vision client provide a robust framework for creating filters that can be applied against ticket and event data. Filters are applied to the current display (the defaults are 6 hours for the Vision client and 2 hours for the Events client), but you can specify a different date range using the filter settings.
Filters apply only to their event category. In other words, if you create a filter for Service events, it cannot be used for Ticket events. In addition, filters apply only to their client. Filters created in the Vision client cannot be used in the Events client, and vice versa.
When you apply a filter to a display and then navigate to another part of the client, the filter remains enabled when you return to the original display (by default). Unless you save a filter, it is discarded when you log out of the client.
You can also save your filters for later use and, if desired, make them public so that other client users can apply them. If a filter is not shared, only the creator can use it. Shared filters can be accessed by all client users, regardless of their user privileges, but can only be edited or deleted by the filter creator, or users that have the same (or higher) user privileges as the filter creator. If users with lesser privileges want to create a similar filter, then can save a copy of the filter under a different name.

Note![]() The Events client global options that can affect filter behavior, such whether filtered content should be saved when you move between tabs. These settings are described in Setting Up Your Events View.
The Events client global options that can affect filter behavior, such whether filtered content should be saved when you move between tabs. These settings are described in Setting Up Your Events View.
These topics explain how to create new and change existing filters:
Creating a New Filter and Saving It
Use this procedure to create filters in the Vision client and Events client.
When you consider a filter name, remember that filters are listed alphabetically. Space is limited, so use concise names.
Step 1![]() Make sure you are working from the desired filter category. The filters you can create and the devices you can choose depend on your user account permissions.)
Make sure you are working from the desired filter category. The filters you can create and the devices you can choose depend on your user account permissions.)
Step 2![]() Open the filter dialog.
Open the filter dialog.


Step 3![]() Configure your filter. Links to topics that describe the filter options are provided after this procedure.
Configure your filter. Links to topics that describe the filter options are provided after this procedure.
In this example, a ticket filter is created to find unacknowledged Critical, Major, Minor, and Warning tickets created in a 24-hour period. This particular filter is launched from the Events client (the Vision client does not support the Archive criteria for tickets).
Figure 12-3 Ticket Filter Example
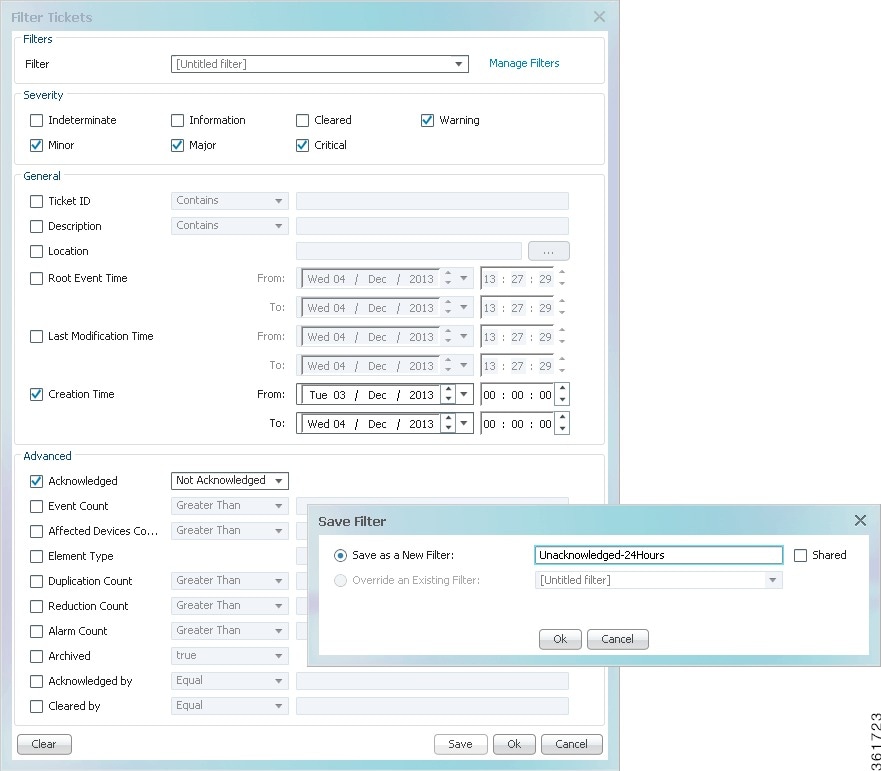
Step 4![]() Click Save and do the following in the Save Filter dialog box:
Click Save and do the following in the Save Filter dialog box:
a.![]() Enter a name (for example, Unacknowledged-24hours).
Enter a name (for example, Unacknowledged-24hours).
b.![]() Check Share to make the filter available to other users of the same client (filters created in the Vision client cannot be used from the Events client). If you share a filter, users with the same or higher privileges will be permitted to edit your filter.
Check Share to make the filter available to other users of the same client (filters created in the Vision client cannot be used from the Events client). If you share a filter, users with the same or higher privileges will be permitted to edit your filter.
c.![]() Click OK to close the Save Filter dialog box.
Click OK to close the Save Filter dialog box.
d.![]() In the Filter or Find dialog box, click OK to apply your filter to the current display. The filter name is displayed under the table; for example, Filter Enabled: Unacknowledged-24hours.
In the Filter or Find dialog box, click OK to apply your filter to the current display. The filter name is displayed under the table; for example, Filter Enabled: Unacknowledged-24hours.
If you move to another tab in the client, the filter is still enabled when you return to the Tickets tab. (You can change this and other filter behaviors by choosing Tools > Options. See Setting Up Your Events View.)
Step 5![]() To clear a filter, choose Edit > Clear Filter (or click
To clear a filter, choose Edit > Clear Filter (or click  ).
).
When log out and log back into the client, your filter will be available from the Filter drop-down list, as shown in the following figure.
Figure 12-4 Filter Drop-Down List
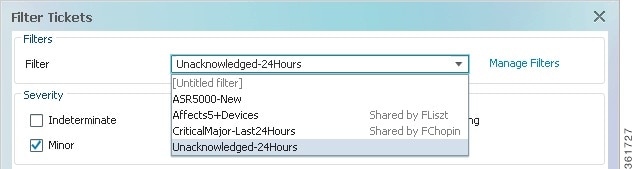
Figure 12-4 shows the new filter along with these pre-existing filters:
- ASR500-new (created by the current user, JSBach).
- Affects5+Devices, a shared filter created by user FLiszt.
- CriticalMajor-Last24Hours, a shared filter created by FChopin.
Any filters created by other users but not shared are not displayed. Only the filter creators can see those filters.
For information on the different filter criteria you can use, see:
Determining Whether a Filter Is On and Turning It Off
If the icon appears above a table, a filter is enabled. To turn the filter off, click the icon or choose Edit > Clear Filter or Edit > Clear Find.
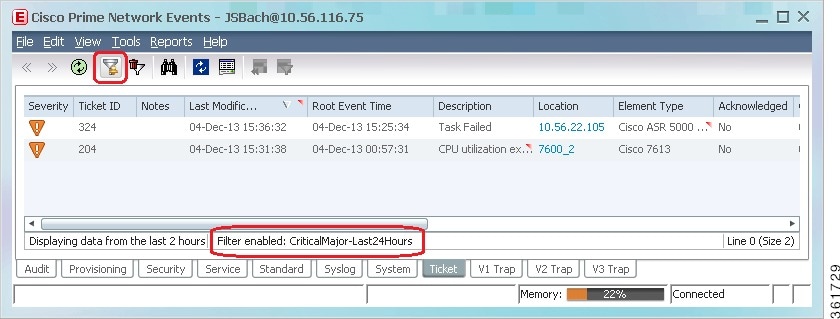
If a basic filter is applied, the client displays Filter Enabled at the bottom of the events table. If the display is using a saved filter, the filter name is also displayed, as in Figure 12-7. In this example, a user has applied a saved filter named Unacknowledged-24Hours to the display.
Figure 12-5 Basic Filter—Saved Filter Applied to Display
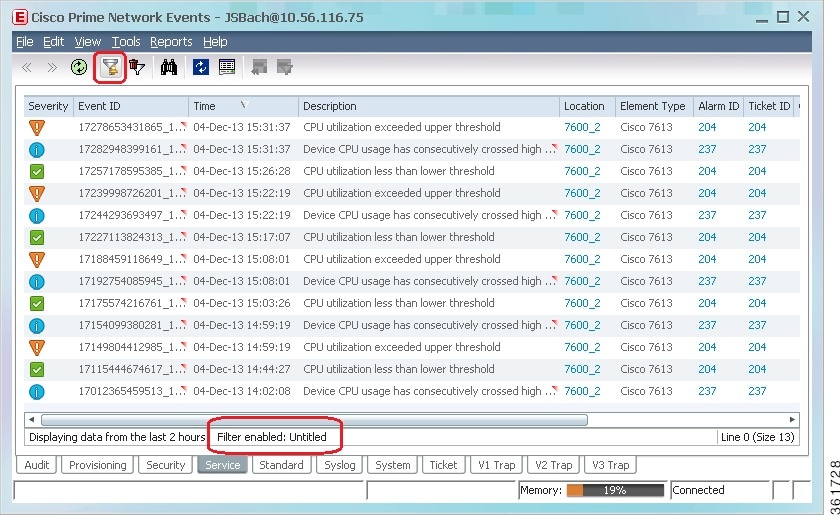
If the display is using a basic filter that was not saved, the client displays Filter Enabled: Untitled, as illustrated in Figure 12-6.
Figure 12-6 Basic Filter—(Unsaved) Filter Applied to Display
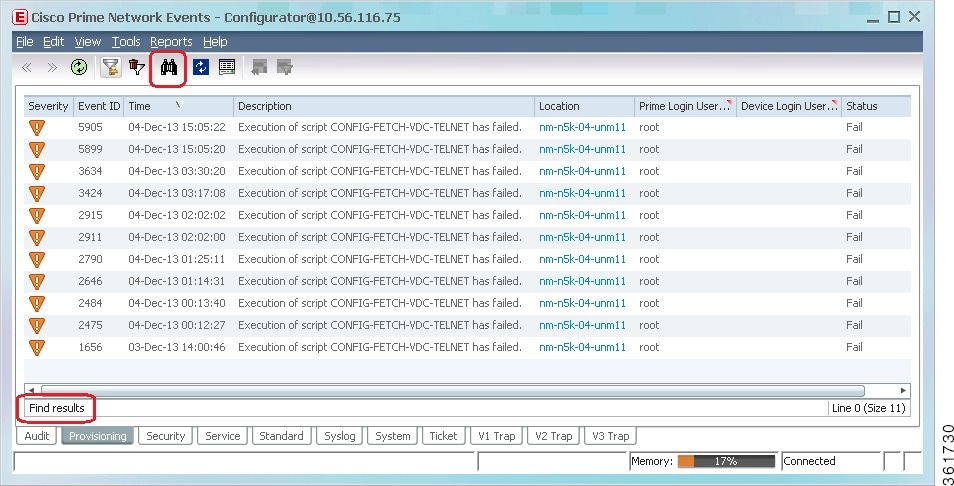
If a Find in Database filter is applied to an Events client display, the client displays Find Results at the bottom of the events table as illustrated in Figure 12-7.
Figure 12-7 Find in Database—Filter Applied (Events Client Only)
To disable any type of filter, do the following:
|
|
|
|
|---|---|---|
|
|
|
|
|
|
||
To clear the Find in Database filter, click the Find in Database filter icon in the toolbar and choose Clear.
Modifying Saved Filters and Managing the Filter List
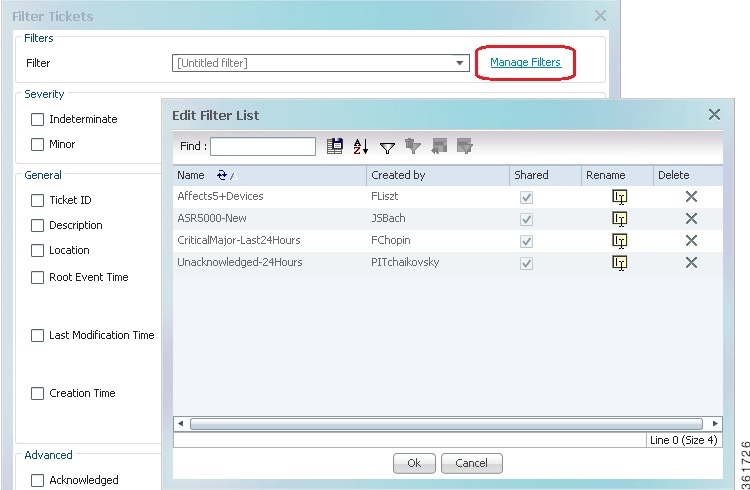
To manage existing filters, open a filter dialog and click Manage Filters. In addition to filters created by the user, the Edit Filter List dialog provides an alphabetical lists of all shared filters. You can only rename or delete a filter you are the filter creator or if you have the same or higher permissions as the filter creator. If a filter is shared, the name of the filter creator is also displayed.
In this example, the current user has lesser permissions than the filter creators, so the user can employ the filters, but cannot edit or delete the filters. However, the user could create a similar filter by saving it under another name.
Figure 12-8 Managing Saved Filters
Finding Archived Tickets, Service Events, Syslogs, and Traps
The Prime Network database contains active and archive partitions. When a ticket or event is archived, it is moved to the archive database partition and is considered inactive, which means Prime Network will not perform any more actions on the ticket or event. In most cases, once a ticket is archived, you need to use a filter to view it and its associated events. Tickets are normally archived if they have been clear for 1 hour (no new events have been associated to the ticket). Cleared tickets can be archived sooner using the remove operation. For detail about the Prime Network clearing and archiving mechanism, see Clearing, Archiving, and Purging and the Oracle Database.
Some archived events are displayed in the clients, but only if those events fall within the GUI client’s display parameters (by default, the last 2 hours for the Events client and the last 6 hours for the Vision client).
- Standard events—Standard events are events for which Prime Network only performs basic parsing; they are not processed for correlation. Standard events are archived as soon as they are received but are displayed in the Standard tab in the Events client, and in the Network Events tab in the Vision client map (or list view). If enabled, standard events are also shown in the Latest Events tab in the Vision client NE inventory window.
- Events associated with recently archived tickets—Tickets are normally archived after being cleared for 1 hour, but the Vision client reflects events from the past 6 hours. For this reason, some archived events may appear in the Network Events tab in the Vision client map or list view, and in Latest Events tab in the Vision client NE inventory window.
- Events that were not correlated to other events—These events are archived and displayed in the Latest Events tab in the Vision client NE inventory window.
Archived events that fall outside of the Events client and Vision client display parameters can only be viewed from the Events client using a filter. To find an archived ticket or network events, use the standard filters and set the Archive setting to true . See these topics for more information:
- Creating and Saving Filters for Tickets and Events for a description of how to create filters using these tools
- Viewing Network Events (Service, Trap, and Syslog Events)
- Viewing Tickets
- Viewing Non-Network Events (Audit, Provisioning, System and Security Events)
- Viewing Tickets
Viewing Network Events (Service, Trap, and Syslog Events)
You can view all active and archived Service, Trap, and Syslog events using Events client filters. All network events provide the following information (other information is also supplied but those fields are self-explanatory). You can use this and other criteria for event filters as described in Creating and Saving Filters for Tickets and Events.
|
|
|
|---|---|
– – |
|
Service resources (pairs) that are affected by the event. It lists of all the endpoints that are affected. See Viewing a Ticket’s Affected Parties Tab (Resource Pairs). (This tab is only provided for events that calculate impact analysis. It has no relation to the Affected Devices count.) |
|
link down -> link up -> link down -> link up -> link down -> link up For tickets, this number is the sum of the duplication counts for all events and alarms in the ticket.
Using the previous example, the Link Down Flapping alarm would have a reduction count of 6 (with 6 events listed in the History tab). For tickets, this number is the sum of the reduction counts for all events and alarms in the ticket. |
|
For information on the other fields that are displayed, see:
Service Events
Service events are generated by the Prime Network system in response to changes in the network. In response to these events, Prime Network will generate Service events, such as BGP Neighbor Loss, MPLS TP Tunnel Down, Link Down, Adaptive Polling (for high CPU issues), and so forth.
If you are looking for specific Service events, use the Events filters. You can search for events based on location (devices), a string included (or not included) in the description, and other common filter criteria (severity, description, and so forth). Once you create the filter, you can search for recent events or all events that are stored in the Oracle database. To create a filter, see Creating and Saving Filters for Tickets and Events. To find archived Service events, see Finding Archived Tickets, Service Events, Syslogs, and Traps.
Refer to these documents for extensive explanations about supported Service events, descriptions, whether they are ticketable, whether they auto-clear, and so forth, Cisco Prime Network 5.2 Supported Service Alarms.
Syslogs and Traps
When a device generates a syslog or trap, Prime Network attempts to match it to a predefined set of rules to determine if it is of interest to Prime Network. If it is of interest, Prime Network generates a syslog or a trap event. If not, it is saved to the database. These are other ways to view traps:
- Syslogs and traps handled by Prime Network but not processed for correlation—Click the Standard tab. (See Viewing Standard Traps and Syslogs Not Recognized by Prime Network).
- Archived syslogs and traps—Create a filter and set the Archive field to true.
In Prime Network, all syslogs and traps are configured to clear automatically, except:
- Syslogs and traps that are ticketable.
- A few important syslogs and traps that do not have a corresponding Service event. For example, a device that suddenly loses power does not send a Down event. Instead, it sends a cold start trap when it subsequently recovers. This trap is not cleared automatically because no corresponding Down event exists. If the cold start trap is automatically cleared, the device-recovery notification will be lost.
When you double-click a trap event, the Events client displays the Details, Affected Parties, and Advanced Tabs. These details provide the same information that is provided for tickets (see Getting a Ticket’s Troubleshooting Tips And Basic Information).
Trap events also display a Trap tab with the following information (depending on the trap version):
Note![]() If a SNMP agent is enabled in a VM, then all the traps that are generated from the VM should be associated to IManagedElement node of the VNE.
If a SNMP agent is enabled in a VM, then all the traps that are generated from the VM should be associated to IManagedElement node of the VNE.
If you are looking for specific traps, create a trap filter as described in Creating and Saving Filters for Tickets and Events.
Note![]() For IPv6, we need to configure device to send events on specific ports (1514,1162 and 1161). For example, to configure on device: snmp-server host 10.105.39.217 version 2c public udp-port 1162
For IPv6, we need to configure device to send events on specific ports (1514,1162 and 1161). For example, to configure on device: snmp-server host 10.105.39.217 version 2c public udp-port 1162
Refer to these documents for extensive explanations about supported traps and syslogs, including their descriptions, whether they are ticketable, whether they auto-clear, whether they are considered flapping events, and so forth:
Viewing Tickets
The Events and Vision client display the same ticket information, and the same operations can be performed from both clients. However, if you want to view archived tickets, use the Events client filters. See Viewing Non-Network Events (Audit, Provisioning, System and Security Events). To view Resync service alarm ticket information, see the topic Viewing Resync Alarm Details in Prime Network
Refer to Managing Tickets with the Vision Client for complete information on how to find and manage tickets.
Viewing Non-Network Events (Audit, Provisioning, System and Security Events)
Audit Events (Executed Commands)
Audit events provide information about configuration commands that are executed on the Prime Network gateway. This can include NE right-click commands, CCM and Compliance Audit operations, and so forth. For example, if a CCM user activated an IOS-XR image, the Events client would display an event Activation was executed by user on the device device for the image image.
The Provisioning tab provides the results of the command. You would find an associated Provisioning event that would list the results (Execution of script !NEIMActivateIOSXRPackage status) along with the exact commands sent to and received from the device.
Audit events also provide the following information, which you can also use as criteria for an Audit event filter:
When you double-click the event, Prime Network displays the commands that were sent from Prime Network to the device.
If you are looking for specific Audit events, use the Events filters. You can search for events based on the originating IP address, strings included (or not included) in the command name, signature, or parameters, and other common filter criteria (severity, description, and so forth). Once you create the filter, you can search for recent events or all events that are stored in the Oracle database. To create a filter, see Creating and Saving Filters for Tickets and Events.
Provisioning Events (Device Configuration Results)
Provisioning events display the results of device configuration operations. For example, if a Vision client user right-clicks an NE and chooses Commands > Show > Users (Telnet sessions), the Provisioning tab creates a new event called E xecution of script !Device_ShowUser_xr succeeded. The event includes the device the command was executed on and the status of the command (Configuring, Success, Fail). It also includes this information, which you can use as criteria for a Provisioning event filter:
|
|
|
|---|---|
Username that was used to access the device. It can be either of the following: |
Provisioning events display the results of operations performed by other Prime Network features such as Change and Configuration Management, Command Manager, and Transaction Manager. When you double-click the event, Prime Network displays the results returned from the device and the operation status.
If you are looking for specific Provisioning events, use the Events filters. You can search for events based on location (devices), the Prime or device username, the status (success, fail, configuring, unknown), and other common filter criteria (severity, description, and so forth). Once you create the filter, you can search for recent events or all events that are stored in the Oracle database. To create a filter, see Creating and Saving Filters for Tickets and Events.
Prime Network Security Events
Security events are related to user authentication, session management, and information about who is making system changes (disabling and enabling AVMs, adding new VNEs to the system, and so forth). An example is User user authenticated successfully. If you double-click the event, you can find out which client the user logged into.
If you are looking for specific Security events, use the Events filters. You can search for events based on a string that is included (or not included) in the username, the IP address where the event was triggered, and other common filter criteria (severity, description, and so forth). Once you create the filter, you can search for recent events or all events that are stored in the Oracle database. To create a filter, see Creating and Saving Filters for Tickets and Events.
For information on how to respond to specific Security events (including their probable cause), refer to Cisco Prime Network Supported System and Security Events.
Prime Network System Events
System events represent the everyday working of Prime Network and its components. Examples are:
- State or reachability changes in Prime Network components
- Database events (ticket archiving, disk space, dropped events, synchronization issues)
- Unit protection (standby unit) events
Most System events occur on AVM 11 (the gateway). If an event occurs on device, a hyperlink to the device is provided in the event details. For information on how to respond to specific System events (including their probable cause), refer to Cisco Prime Network Supported System and Security Events.
If you are looking for specific System events, use the Events filters. You can search for events based on a string that is included (or not included) in the description, specific devices, and other common filter criteria (severity, time, and so forth). Once you create the filter, you can search for recent events or all events that are stored in the Oracle database. To create a filter, see Creating and Saving Filters for Tickets and Events.
Viewing Standard Traps and Syslogs Not Recognized by Prime Network
Standard events are events that Prime Network could not match with any of the rules that define events of interest. Prime Network does a best effort at extracting information from these syslogs and traps, but does not process them for correlation. Standard events are saved to the database and can be viewed in the Standard tab. You can also create an event filter for Standard syslog and trap events using the same criteria for events displayed in the Syslogs tab and the V1 Trap, V2 Trap, and V3 Trap tabs. See Viewing Network Events (Service, Trap, and Syslog Events) for more information.
Changing How Often Event Information is Refreshed
By default, the Events client displays event information from the last 2 hours (up to 50 records per table). Data is refreshed when you log into the Events client, and when you move between the Events tabs. To refresh the data in a table you are viewing, click Refresh Now. You can also enable the auto-refresh mechanism which will update the data every 60 seconds. The manual and auto refresh buttons are shown below.


The following table shows the default settings for data display and refresh, and how you can adjust them.
|
|
|
|
|---|---|---|
Switch to Find in Database mode (see Creating a New Filter and Saving It) |
||
Updating events data whenever you move between Events tabs (“Find” mode) |
||
How much data to display in the events tables (age and number of records per page) |
Note Increasing the interval beyond 2 hours can adversely affect the display performance. |
Exporting Events Data
When you export data, it is saved as a CSV file. Prime Network will export all of the data listed in the table, up to the number of records specified in the Events client Options dialog. You can check the setting by choosing Tools > Options from the main menu.
To export an Events table to a CSV file:
Step 2![]() Browse to the directory where you want to save the file and enter a name for the file.
Browse to the directory where you want to save the file and enter a name for the file.
Step 3![]() Click Save. The displayed records are saved in a CSV file.
Click Save. The displayed records are saved in a CSV file.
Changing the Events Client Defaults
Events client users can change their default settings. This includes:
- Saving filters and using them by default when you open Events
- How many records to display in the Events client
- How many records can be exported at one time
- How often data should be refreshed
- The age of data to display
- Enabling manual event retrieval (so that events are not retrieved immediately when you first log in or when you switch between tabs)
To change these settings, see Setting Up Your Events View.
 Feedback