Syslog Analysis
Available Languages
Table Of Contents
Viewing the Severity Level Summary
Viewing the Unexpected Device Report
Viewing Syslog Collector Status
Syslog Analysis
The syslog analysis features provide a central error-message logging system for classifying, sorting, and integrating device error messages and exceptions. You can perform the following procedures with Syslog Analysis:
•
Set options to specify how much message data to store.
•
•
•
•
•
All Essentials users can generate message log reports, custom reports and summaries, and severity alert reports and summaries:
•
•
•
•
•

Note
The following sections are presented in this chapter:
•
•
•
For additional information about Syslog Analysis, refer to the online help.
Configuring a Custom Report
Scenario: You want to configure a custom report to monitor several alert types.To configure a custom report, perform the following steps:
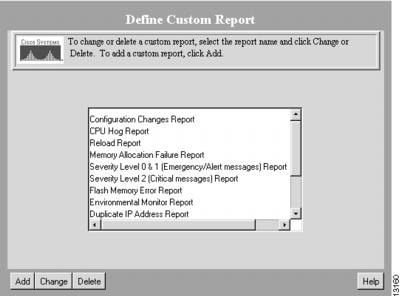
Step 1
The Define Custom Report dialog box appears. (See .)
Figure 7-1 Define Custom Report Dialog Box
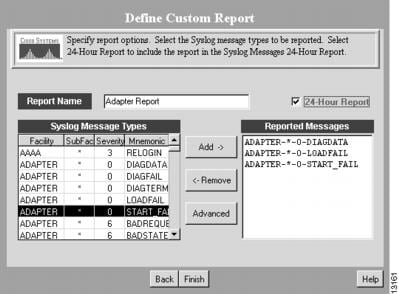
Step 2
The Define Custom Report dialog box is modified to include message types. (See .)
Figure 7-2 Define Custom Report Dialog Box
Step 3
Step 4
Step 5
Step 6
Step 7
A confirmation message appears.
Viewing Custom Reports
Scenario: You want to determine which routers on your network have changed running configurations over a specified period.To view a custom report, perform the following steps:
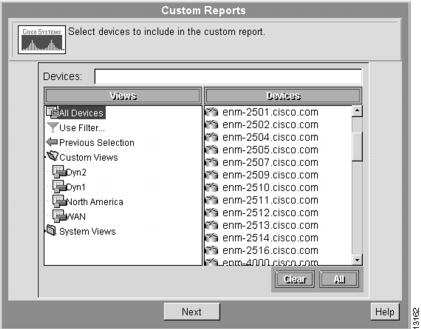
Step 1
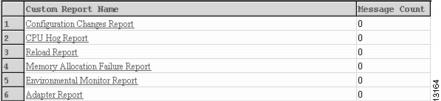
The Custom Reports dialog box appears. (See .)
Figure 7-3 Custom Reports Dialog Box
Step 2
Step 3
The Select Report Name and Dates dialog box appears. (See .)
Figure 7-4 Select Report Name and Dates Dialog Box
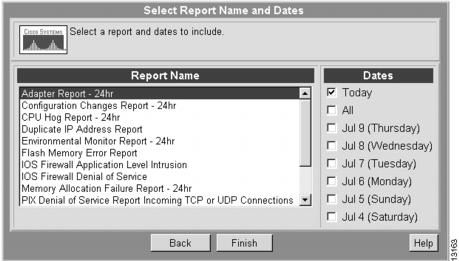
Step 4
The Configuration Changes Report appears. Print the report and save it as a CSV or plain text file.
Using 24-Hour Reports
Use 24-hour reports to identify the syslog messages generated over the last 24 hours.
You can add 24-hour reports by performing the procedure for Configuring a Custom Report.
Scenario: You just came in from the field or arrived for your shift and you want a status report for the most recent syslog messages.
Step 1
The Syslog 24-Hour Report appears. (See .)
Figure 7-5 Syslog 24-Hour Report
Step 2
Figure 7-6 Reload Report
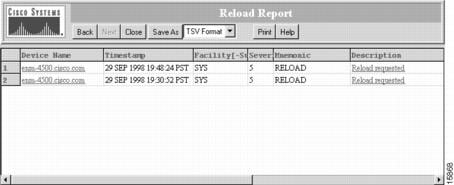
Step 3
Viewing the Severity Level Summary
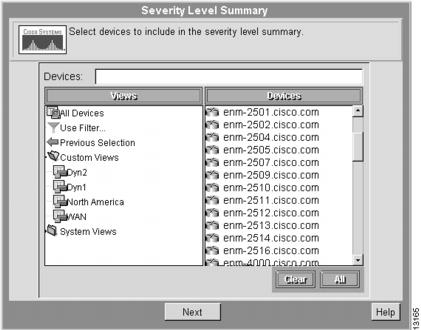
Scenario: You want to obtain a snapshot of the error-message severity levels for the routers on your network.To view the severity-level summary, perform the following steps:
Step 1
The Severity Level Summary dialog box appears. (See .)
Figure 7-7 Severity Level Summary Dialog Box
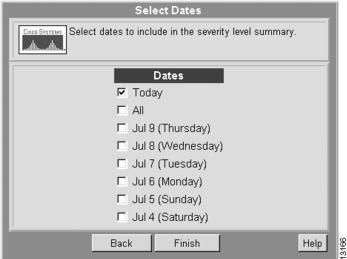
Step 2
The Select Dates dialog box appears. (See .)
Figure 7-8 Select Dates Dialog Box
Step 3
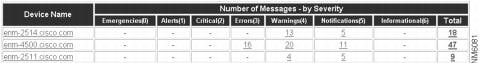
The Severity Level Summary appears. (See .)
Step 4
Figure 7-9 Severity Level Summary
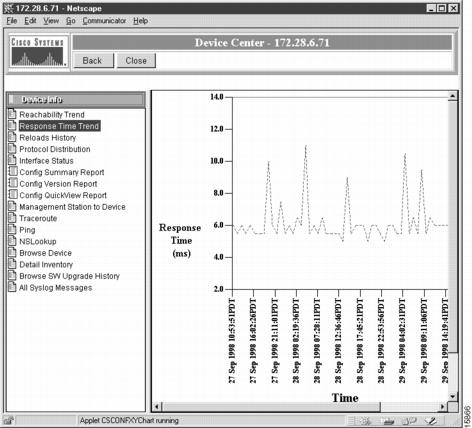
Step 5
Figure 7-10 Device Center
Step 6
Defining an Automatic Action
Scenario: You want Essentials to automatically send e-mail to a group of employees whenever certain syslog messages are filtered.To define an automatic action, perform the following steps:
Step 1
The Define Automated Action dialog box appears.
Step 2
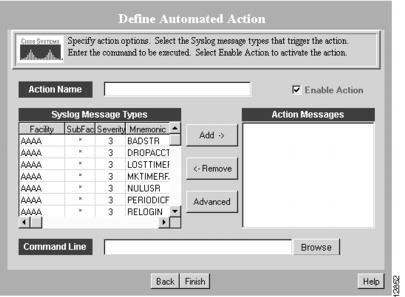
The Define Automated Action dialog box appears. (See .)
Figure 7-11 Define Automatic Action Dialog Box
Step 3
Step 4
Step 5
Step 6
Step 7
A confirmation message appears.
Note
Viewing the Unexpected Device Report
Scenario: You want to view messages for new devices that have been added to the network but are not yet managed by Essentials. You will use this report to determine which unexpected devices you need to add to your inventory.To generate an unexpected device report, perform the following steps:
Step 1
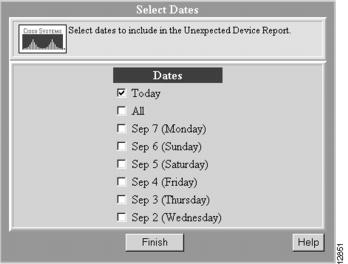
The Select Dates dialog box appears. (See .)
Figure 7-12 Select Dates Dialog Box
Step 2
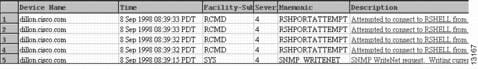
The Unexpected Device Report appears. (See .)
Figure 7-13 Unexpected Device Report
Step 3
Step 4
Changing Storage Options
Scenario: You want to store network syslog information for 7 days to use in the reports.To set syslog storage options, perform the following steps:
Step 1
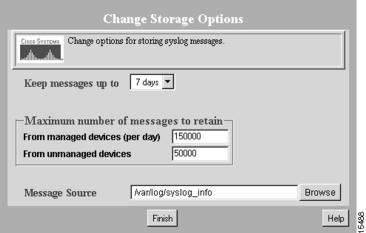
The Change Storage Options dialog box appears. (See .)
Figure 7-14 Change Storage Options Dialog Box
Step 2
Note
Step 3
A confirmation message appears.
Defining Message Filters
Scenario: You want to view messages that pertain to firewall status and filter out other types of messages.To define message filters, perform the following steps:
Step 1
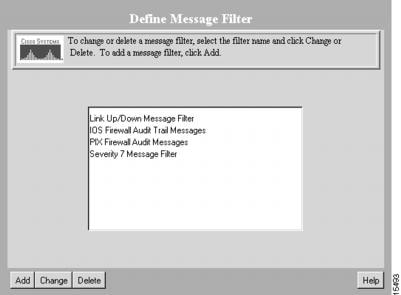
The Define Message Filter dialog box appears. (See .)
Figure 7-15 Define Message Filter Dialog Box
Step 2
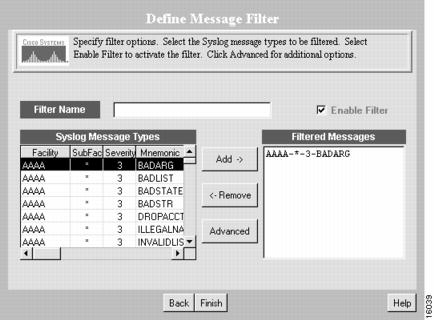
The Define Message Filter Dialog Box again appears. (See .)
Figure 7-16 Define Message Filter Dialog Box
Step 3
Step 4
Step 5
A confirmation message appears.
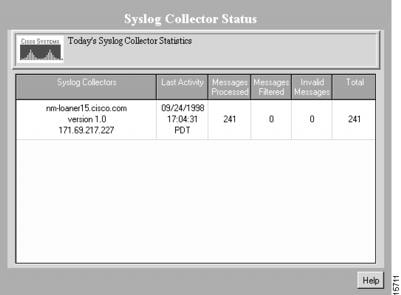
Viewing Syslog Collector Status
To view syslog collection information, perform the following steps:
Step 1
The Syslog Collector Status window appears. (See .)
Figure 7-17 Syslog Collector Status Window
Step 2
This completes the chapter on Syslog Analysis.
 Feedback
Contact Cisco
- Open a Support Case

- (Requires a Cisco Service Contract)
This Document Applies to These Products
- Collaboration Endpoints - Retired Products
- Conferencing - Retired Products
- Contact Center - Retired Products
- Optical Networking - Retired Products
- Routers - Retired Products
- Security - Retired Products
- Servers - Unified Computing (UCS) Retired Products
- Storage Networking Retired Products
- Switches - Retired Products
- Video - Retired Products
- Wireless - Retired Products