Availability Management
Available Languages
Table Of Contents
Setting Views and Polling Options
Viewing the Reachability Dashboard
Determining Current Network Availability
Viewing Stack Decoder Trace and Analysis
Determining the Protocol Distribution of Devices
Availability
You have added devices to your network and created some views with which to generate reports. You have also generated the reports you need. Now you want to monitor the devices in your network inventory and determine their availability.
You can use Availability features to do the following:
•
Monitor network availability and response time for a set of user-configurable critical devices.
•
•
The following sections are presented in this chapter:
•
•
•
•
•
For detailed information on Availability, refer to the online help.
Setting Views and Polling Options
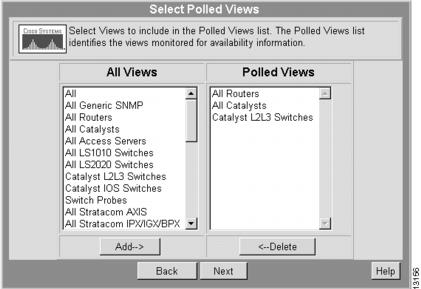
Scenario: You want to monitor device availability, but first you must select Availability views.To set views and polling options, perform the following steps:
Step 1
The Select Polled Views dialog box appears. (See .)
Figure 6-1 Select Polled Views Dialog Box
Step 2
Step 3
Step 4
The Change Polling Options dialog box appears. (See .)
Figure 6-2 Change Polling Options Dialog Box
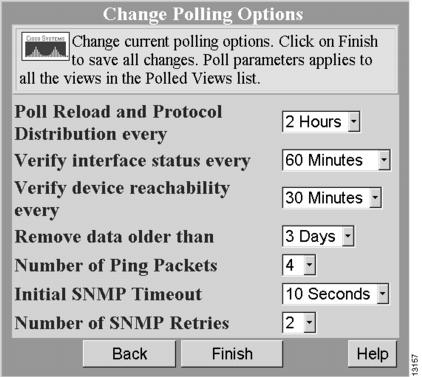
Step 5
Viewing the Reachability Dashboard
You can use the Reachability Dashboard to view device reachability and learn when a device last responded. The Dashboard window is updated every minute.
Scenario: You want to determine the availability (or reachability) of the devices in all your views.To view the Reachability Dashboard, perform the following steps:
Step 1
The Reachability Dashboard displays a report for each of the views. (See .)
Figure 6-3 Reachability Dashboard
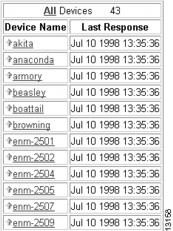
The Reachability Dashboard refreshes automatically every minute. Therefore, you can keep it on your desktop to receive constant updates. The down arrows indicate unreachable devices and the up arrows indicate reachable devices.
Step 2
Figure 6-4 Device Center
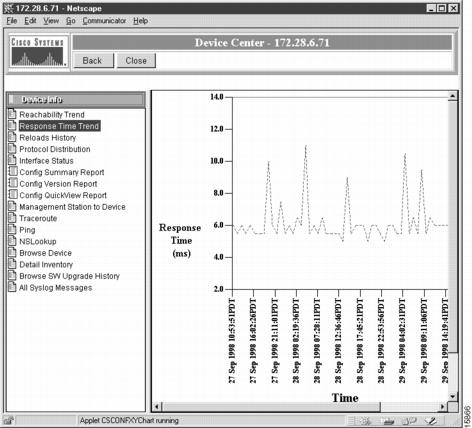
Step 3
Determining Current Network Availability
Scenario: You want to determine the overall availability of your network devices.To determine network availability, perform the following steps:
Step 1
The Select Devices dialog box appears. (See .)

Note
Figure 6-5 Select Devices Dialog Box
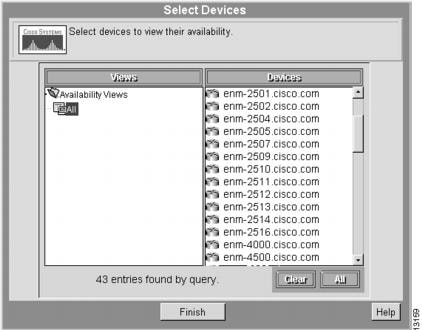
Step 2
The Availability Monitor report appears. (See .)
Figure 6-6 Availability Monitor Report
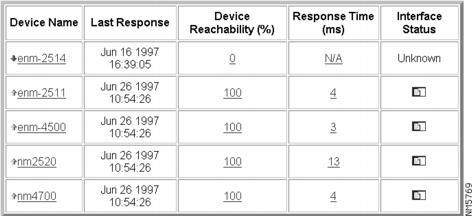
The down arrows on the Availability Monitor report indicate unreachable devices; the up arrows indicate reachable devices.
Availability Monitor information is updated at half the SNMP polling rate.
Step 3
•
•
•
Figure 6-7 Device Reachability Graph
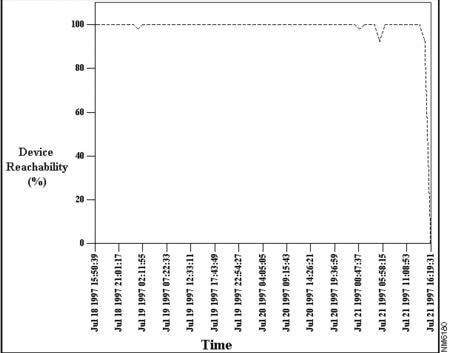
Figure 6-8 Response Time Report

Step 4
Viewing Device Reloads
Scenario: Several devices on the network have crashed and reloaded overnight. You want to determine which devices reloaded and why.To view your reload history, perform the following steps:
Step 1
The Select Devices dialog box appears. (See .)
Step 2
Step 3
The Reloads Report appears. (See .)
Figure 6-9 Reloads Report
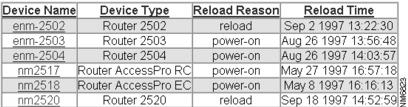
Step 4
A results window displays information for the last 24 hours.
Viewing Stack Decoder Trace and Analysis
Scenario: One of the devices in your reloads report has a hyperlinked entry in the Reload Reason column. You view the Stack Decoder analysis to find out why the device reloaded.To view the Stack Decoder analysis, perform the following steps from a reloads report:
Step 1
The Stack Decoder Trace and Analysis window displays error information.
Step 2
Determining the Protocol Distribution of Devices
Scenario: You are preparing for a network rollout and want to determine the protocol distribution of devices on the network.To determine the protocol distribution of a region, perform the following steps:
Step 1
The Select Devices dialog box appears. (See .)
Step 2
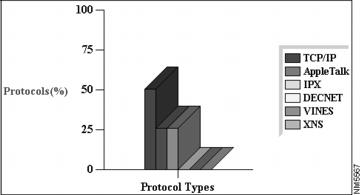
The protocol distribution bar chart appears. (See .)
Figure 6-10 Protocol Distribution Bar Chart
Step 3
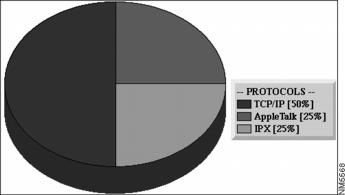
The Protocol Distribution pie chart appears. (See .)
Figure 6-11 Protocol Distribution Pie Chart
Step 4
This completes the chapter on Availability.
 Feedback
Contact Cisco
- Open a Support Case

- (Requires a Cisco Service Contract)
This Document Applies to These Products
- Collaboration Endpoints - Retired Products
- Conferencing - Retired Products
- Contact Center - Retired Products
- Optical Networking - Retired Products
- Routers - Retired Products
- Security - Retired Products
- Servers - Unified Computing (UCS) Retired Products
- Storage Networking Retired Products
- Switches - Retired Products
- Video - Retired Products
- Wireless - Retired Products