Table Of Contents
Assigning and Unassigning Alarms
Downloading Location Server Log Files
Creating a System Utilization Report
Viewing a System Utilization Chart
Monitoring Mobility Services Engine Status
Viewing Mobility Services Engine Current Information
Enabling Tagged Asset Location Status
Monitoring the System
This chapter describes how to monitor the mobility services engine by configuring and viewing alarms, events, and logs as well as how to generate reports on system utilization and element counts (tags, clients, rogue clients and access points).
It also describes how to use Cisco WCS to view system, client, and asset tag status as well as status on chokepoints and locations sensors.
This chapter contains the following sections:
•
"Working with Alarms" section
•
"Working with Events" section
•
"Monitoring Mobility Services Engine Status" section
•
"Monitoring Tagged Assets" section
•
"Monitoring Chokepoints" section
•
"Monitoring Location Sensors" section
Working with Alarms
This section describes how to view, assign, and clear alarms and events on a mobility services engine using Cisco WCS. Details on how to have email notifications for alarms sent to you is described as well as how to define those types (all, critical, major, minor, warning) of alarm notifications that are sent to you.
Viewing Alarms
To view mobility services engine alarms, follow these steps:
Step 1
In Cisco WCS, click Monitor > Alarms.
Step 2
Click New Search. A configurable search panel for alarms appears (Figure 8-1).
Figure 8-1 Search Alarm Panel
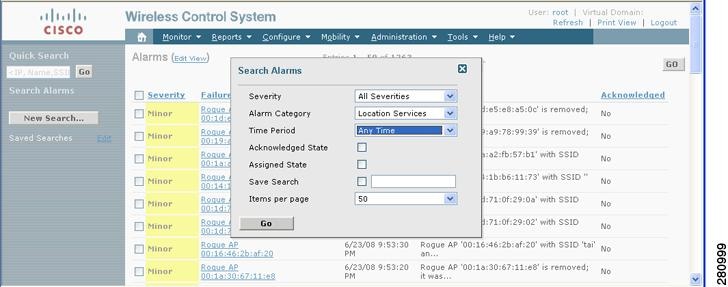
![]()
Step 3
Select the Severity of Alarms to display. Options are All Severities, Critical, Major, Minor or Warning.
Step 4
Select Location Services from the Alarm Category.
Options are: All Types, Access Points, Controller, Coverage Hole, Config Audit, Location Notifications, Location Services, Interference, Mesh Links, Rogue AP, Rogue Adhoc, Security and WCS.
Step 5
Select the time frame for which you want to review alarms by selecting the appropriate option from the Time Period drop-down menu.
Options range from minutes (5, 15 and 30) to hours (1 and 8) to days (1 and 7). To display all select Any time.
Step 6
Check the Acknowledged State check box to exclude the acknowledged alarms and their count from the Alarm Summary window.
Step 7
Check the Assigned State check box to exclude the assigned alarms and their count from the Alarm Summary window.
Step 8
To save the search criteria for later use, check the Save Search box and enter a name for the search.
![]()
Note
The search is then accessible from the Saved Searches drop-down menu (left-panel) of the Monitor > Alarms window.
Step 9
Select the number of alarms to display on each window from the Items per Page drop-down menu.
Step 10
Click GO. Alarms summary panel appears with search results.
![]()
Note
Click the column headings (Severity, Failure Object, Owner, Date/Time and Message) to sort alarms.
Step 11
Repeat Step 2 to Step 10 to see notifications for the mobility services engine by entering Location Notifications as the alarm category in Step 4.
Assigning and Unassigning Alarms
To assign and unassign an alarm to yourself, follow these steps:
Step 1
Display the Alarms window as described in the "Viewing Alarms" section.
Step 2
Select the alarms that you want to assign to yourself by checking their corresponding check boxes.
![]()
Note
To unassign an alarm assigned to you, uncheck the box next to the appropriate alarm. You cannot unassign alarms assigned to others.
Step 3
From the Select a command drop-down menu, choose Assign to Me (or Unassign) and click GO.
If you choose Assign to Me, your username appears in the Owner column. If you choose Unassign, the username column becomes empty.
Deleting and Clearing Alarms
To delete or clear an alarm from a location appliance, follow these steps:
Step 1
Display the Alarms window as described in the "Viewing Alarms" section.
Step 2
Select the alarms that you want to delete or clear by checking their corresponding check boxes.
![]()
Note
If you delete an alarm, Cisco WCS removes it from its database. If you clear an alarm, it remains in the Cisco WCS database, but in the Clear state. You clear an alarm when the condition that caused it no longer exists.
Step 3
From the Select a command drop-down menu, choose Delete or Clear, and click Go.
Emailing Alarm Notifications
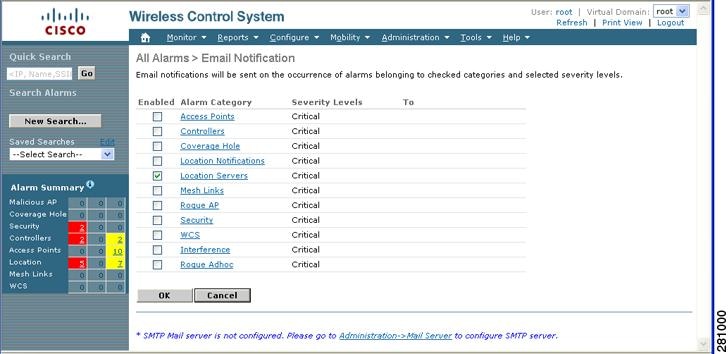
Cisco WCS lets you send alarm notifications to a specific email address. Sending notifications through email enables you to take prompt action when needed.
You can select the alarm severity types (critical, major, minor and warning) that are emailed to you.
To send alarm notifications, follow these steps:
Step 1
Display the Alarms window as described in the "Viewing Alarms" section.
Step 2
From the Select a commands drop-down menu, choose Email Notification, and click GO. The Email Notification window appears.
Figure 8-2 All Alarms > Email Notification Window
![]()
![]()
Note
A SMTP Mail Server must be defined prior to entry of target email addresses for email notification. Choose Administrator > Settings > Mail Server to enter the appropriate information. You can also select the Administration > Mail Server link, if displayed, on the Email Notification window noted above.
Step 3
Click the Enabled box next to the Location Servers.
![]()
Note
Enabling the Location Servers alarm category sends all alarms related to location services and the mobility services engine system to the defined email address.
Step 4
Click the Location Services link. The panel for configuring the alarm severity types (critical, major, minor and warning) that are reported for the mobility services engine appears.
Step 5
Check the check box next to all the alarm severity types for which you want email notifications sent.
Step 6
In the To field, enter the email address or addresses to which you want the email notifications sent. Email addresess are separated by commas.
Step 7
Click OK.
You are returned to the Alarms > Notification window. The changes to the reported alarm severity levels and the recipient email address for email notifications are displayed.
Working with Events
You can use Cisco WCS to view mobility services engine and location notification events. You can search and display events based on their severity (critical, major, minor, warning, clear, info) and event category.
You can search by the following event categories:
•
By network coverage: coverage holes and interference
•
By link: mesh links
•
By notifications: location notifications
•
By product type: access points (rogue and non-rogue), clients, controllers, and location servers
![]()
Note
The product type: location servers reports events for mobility services engines.
•
By security
Additionally, you can search for an element's events by its IP address, MAC address or name.
A successful event search displays the event severity, failure object, date and time of the event, and any messages for each event.
To display events, follow these steps:
Step 1
In Cisco WCS, click Monitor > Events.
Step 2
In the Events window:
•
If you want to display the events for a specific element and you know its IP address, MAC address, or Name, enter that value in the Quick Search field (left panel). Click GO.
•
To display events by severity and category, select the appropriate options from the Severity and Event Category drop-down menus (left panel). Click Search.
Step 3
If Cisco WCS finds events that match the search criteria, it displays a list of these events.
![]()
Note
For more information about an event, click the failure object associated with the event. Additionally, you can sort the events summary by each of the column headings.
Working with Logs
This section describes how to configure logging options and how to download log files.
Configuring Logging Options
You can use Cisco WCS to specify the logging level and types of messages to log.
To configure logging options, follow these steps:
Step 1
In Cisco WCS, click Mobility > Mobility Service Engines.
Step 2
Click the name of the mobility services engine that you want to configure.
Step 3
From the System menu (left panel) click Advanced Parameters. The advanced parameters for the selected mobility services engine appears.
Step 4
Scroll down to the Logging Options section and choose the appropriate option from the Logging Level drop-down menu.
There are four logging options: Off, Error, Information, and Trace.
![]()
CautionUse Error and Trace only when directed to do so by Cisco Technical Assistance Center (TAC) personnel.
Step 5
Check the Enabled check box next to each element listed in that section to begin logging of its events.
Step 6
Click Save to apply your changes.
Downloading Location Server Log Files
If you need to analyze mobility services engine log files, you can use Cisco WCS to download them to your system. Cisco WCS downloads a zip file containing the log files.
To download a zip file containing the log files, follow these steps:
Step 1
In Cisco WCS, click Mobility > Mobility Service Engines.
Step 2
Click the name of the mobility services engine to view its status.
Step 3
Click Logs (left panel).
Step 4
Click Download Logs.
Step 5
Follow the instructions in the File Download dialog box to save the zip file on your system.
Generating Reports
In Cisco WCS, you can generate a utilization report for a mobility services engine. By default, reports are stored on the Cisco WCS server.
The location utilization report summarizes and charts the following information in two separate charts for a prescribed period of time:
•
Chart 1 summarizes and graphs CPU and memory utilization
•
Chart 2 summarizes and graphs client count, tag count, rouge client count, rogue access point count, and ad hoc rogue count
You can generate a utilization report for a mobility services engine. Once defined, the report can be saved for future diagnostic use and run on either an ad hoc or scheduled basis.
You can define the following in a utilization report:
•
What mobility services engine or mobility services engines are monitored
•
How often the report is generated
•
How the data is graphed on the charts
•
Whether the report is emailed or exported to a file
Creating a System Utilization Report
Step 1
In Cisco WCS, click Reports > Performance Reports.
Step 2
Select Location Server Utilization from the listing under the Performance Reports heading (left panel).
![]()
Note
Selecting the location server utilization report addresses statistics for mobility services engines when you select a mobility services engine in Step 6.
The Location Server Utilization summary window appears.
Step 3
Select New from the Select a command drop-down menu. Click GO.
A tabbed panel appears (see Figure 8-3).
Figure 8-3 Reports > Performance Reports > Location Server Utilization
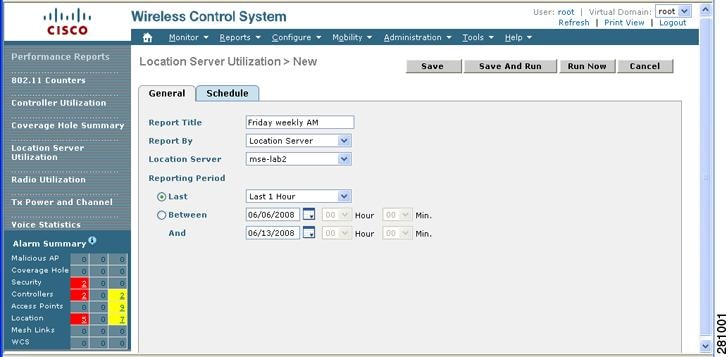
![]()
Step 4
Enter a report title.
Step 5
The Report By selection is always location server.
![]()
Note
Although location server is selected in this step, you can still view reports for mobility services engines by selecting a specific mobility services engine in Step 6.
Step 6
Select either a specific mobility services engine or All Location Servers from the drop-down location server menu.
![]()
Note
Select a mobility services engine from the location server drop-down menu to display utilization information for a specific mobility services engine. If you select All Location Servers, a mix of mobility services engines and location appliances appears (if location appliances are installed on the network).
Step 7
Enter the reporting period for the report. You can define the report to collect data on either an hourly or weekly basis or at a specific date and time.
![]()
Note
The reporting period uses a 24-hour rather than a 12-hour clock. For example, select hour 13 for 1:00 PM.
Step 8
To define how collected data is grouped and displayed (hourly, daily, weekly) on the report (x-axis), select an option from the Aggregation Frequency drop-down menu. Select the Schedule tab when complete.
For example, if you want to graph data daily on your report, you select daily. Additionally, you must select daily as the Recurrence value in the schedule tab.
![]()
Note
The Recurrence parameter defines how often a report is generated.
Step 9
At the Schedule window, check the Enable Schedule check box to enable the report.
Figure 8-4 Location Server Utilization > New > Schedule Tab
![]()
Step 10
Select the export format from the drop-down menu.
Step 11
Select either the Save To File or the Email To option.
–
If you select the Save To File option, a destination path must first be defined at the Administration > Settings > Report window. Enter the destination path for the files in the Repository Path field.
–
If you select the Email To option, an SMTP Mail Server must be defined prior to entry of target email address. Choose Administrator > Settings > Mail Server to enter the appropriate information.
Step 12
Enter a start date (MM:DD:YYYY) or click the calendar icon to select a date.
Step 13
Specify a start time using the hour and minute drop-down menus.
Step 14
Click one of the Recurrence buttons to select how often the report is run.
![]()
Note
The days of the week appear only on the screen when the weekly option is chosen.
Step 15
When complete with all of the above steps, do one of the following:
•
Click Save to save edits.
•
Click Save and Run to save the changes and run the report now. The report is run and the results are either emailed or saved to a designated file as defined in the Schedule tab. The report runs again at the scheduled time.
•
Click Run Now if you want to run the report immediately and review the results in the WCS window. The report runs regardless of any scheduled time associated with the report. If the report is too large to display in the WCS window, you are referred to the history tab to download the file for viewing. Click Save if you want to save the report scenario you entered.
![]()
Note
You can also click the Run Now command to check a report scenario before saving it or to run reports as necessary.
Viewing a System Utilization Chart
To view results of a defined report, do the following:
Step 1
In Cisco WCS, click Reports > Performance Reports.
Step 2
Select Location Server Utilization from the listing under the Performance Reports heading.
The Location Server Utilization summary window appears. Any pre-defined reports, previously created and saved, are listed.
![]()
Note
You can select one of the listed reports or you can define a new report. For details on creating a new report, see the "Creating a System Utilization Report" section.
Step 3
Select a listed report.
Step 4
Review or modify the report parameters on the General tab window. When finished, select the Schedule tab.
Step 5
Check the Enable Schedule check box to enable the report.
Step 6
Review and edit other parameters, as necessary. When you are finished with your review or edit, do one of the following:
•
Click Save to save edits.
•
Click Save and Run to save the changes and run the report now. The report is run and the results are either mailed or saved to a designated file as defined in the Schedule tab. The report runs again at the scheduled time.
•
Click Run Now if you want to run the report immediately and review the results in the WCS window. The report runs regardless of any scheduled time associated with the report. If the report is too large to display in the WCS window, you are referred to the history tab to download the file for viewing. Click Save if you want to save the report scenario you entered.
![]()
Note
You can also use the Run Now command to check a report scenario before saving it or to run reports as necessary.
Monitoring Mobility Services Engine Status
This section describes how to view mobility services engine status and how to enable status information polling.
Viewing Mobility Services Engine Current Information
To view the current status of a location server, follow these steps:
Step 1
In Cisco WCS, click Mobility > Mobility Service Engines.
Step 2
Click the name of a mobility services engine to view its status.
Step 3
Click System (left panel).
Step 4
Click Advanced Parameters.
Information displayed for the selected mobility services is summarized in Table 8-1.
Table 8-1 Advanced Parameters for Mobility Services Engine
Monitoring Clients
You can configure Cisco WCS to display the name of the access point that generated the signal for a client, its strength of signal and how often the location information for that client is updated. This information is display by simply passing the cursor over the client icon on the map. Additionally, you can click on the icon to open the Client Properties window.
To provide this functionality, you must first enable location status for the client.
To enable client location status for a specific client, follow these steps:
Step 1
In Cisco WCS, click Monitor > Clients
The Clients Summary window displays.
Step 2
Click the Total Clients link for the appropriate mobility services engine listed under Clients Detected by Location Servers.
A summary of all clients for the chosen mobility services engine displays noting its user, vendor, IP address, MAC address, Access Point, Detecting Controller, Port, System Name, 802.11 state, Profile name, SSID, Authenticated state (yes or no), Protocol, Map location, Automated Test Run (yes or no).
![]()
Note
To search for a client by a specific parameter such as by MAC address or controller, click New Search and select the appropriate search criteria. If you searched for the client by its MAC address, only one entry is listed.
Step 3
Click on the appropriate client.
Step 4
Click the Location tab.
Step 5
Check the Enabled check box for Location Debug under Asset Info.
Step 6
Click Update and close the window.
Step 7
At the map, click Refresh Heatmap to activate the feature on the map.
![]()
Note
At the Monitor > Maps window, both the Refresh Heatmaps and Clients check boxes must be checked in the Layers menu for the RSSI and client icons to display on the map.
Monitoring Tagged Assets
You can configure Cisco WCS to display the name of the access point that generated the signal for a tagged asset, its strength of signal and when the location information was last updated for the asset. This information is display by simply passing the cursor over the asset tag icon on the map. Additionally, you can click on the icon to open the Tag Properties window.
To provide this functionality, you must first enable location status for the tagged asset.
Enabling Tagged Asset Location Status
To enable tag location status, follow these steps:
Step 1
In Cisco WCS, click Monitor > Tags.
The Tags Summary window appears.
Step 2
Click the Total Tags link for the appropriate mobility services engine.
A summary of all tags for the chosen mobility services engine appears noting MAC address, Asset Name, Asset Category, Asset Group, Vendor, Location, Controller, Battery Status, and Map location for each of the tags.
![]()
Note
You can also search for a specific tag by criteria such as MAC address, controller, or Tag Vendor. See the "Querying of Tags" section for more details.
Step 3
Click the appropriate tag. The Tag Properties window appears.
Step 4
Check the Enabled check box for Location Debug under Asset Info.
Step 5
Click Update and close the window.
Step 6
Click Monitor > Maps to return to the map.
Step 7
In the Layers drop-down menu, check the check boxes for Refresh Heatmap and 802.11 Tags to activate the feature on the map.
Querying of Tags
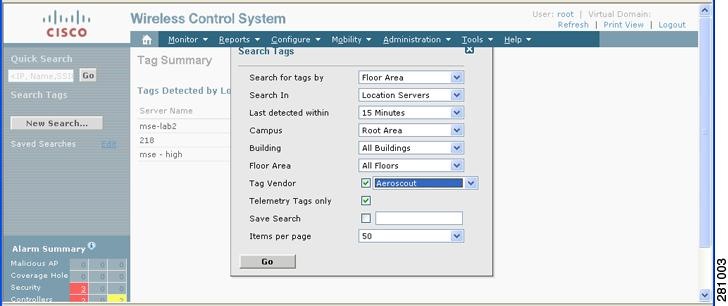
You can query tags by asset type (name, category and group), by MAC address, by system (controller or location appliance), and by area (floor area and outdoor area).
You can further refine your search by tag vendor and type (telemetry) and save the search criteria for future use. Saved search criteria can be retrieved from the Saved Searches drop-down menu on the Tag Summary window (Monitor > Tags).
The following details are displayed on the Tag Properties window for each tag:
•
Tag vendor
•
Controller to which tag is associated
•
Battery Life
•
Asset Information (Name, Category, Group)
•
Statistics (bytes and packets received)
•
Location (Floor, Last Located, Location Server)
![]()
Note
The location server heading summarizes both location servers and mobility services engines.
•
Location Notifications
•
Telemetry Data (Cisco CX v1 compliant tags only)
![]()
Note
Telemetry data displayed is vendor-specific; however, some commonly reported details are GPS location, battery extended information, pressure, temperature, humidity, motion, status, and emergency code.
•
Emergency Data (Cisco CX v1 compliant tags only)
To query tags, follow these steps:
Step 1
Click Monitor > Tags. The Tag Summary window appears.
Step 2
To initiate a search for tags, click New Search (side panel) to open the tag search window (Figure 8-5).
Figure 8-5 Search Tags Panel
![]()
Step 3
Select the appropriate search criteria. Table 8-2 lists search criteria and their possible values.
Step 4
Click Go when all search criteria are selected. A listing of all tags that match the search criteria appears.
![]()
Note
If no tags are found based on the selected search criteria, a message appears noting this as well as reasons why the search was unsuccessful and possible actions.
Step 5
Select a MAC Address link from the listing to display details for that specific tag. The Tag Properties window appears (Figure 8-6).
Figure 8-6 Tag Properties Window (top)
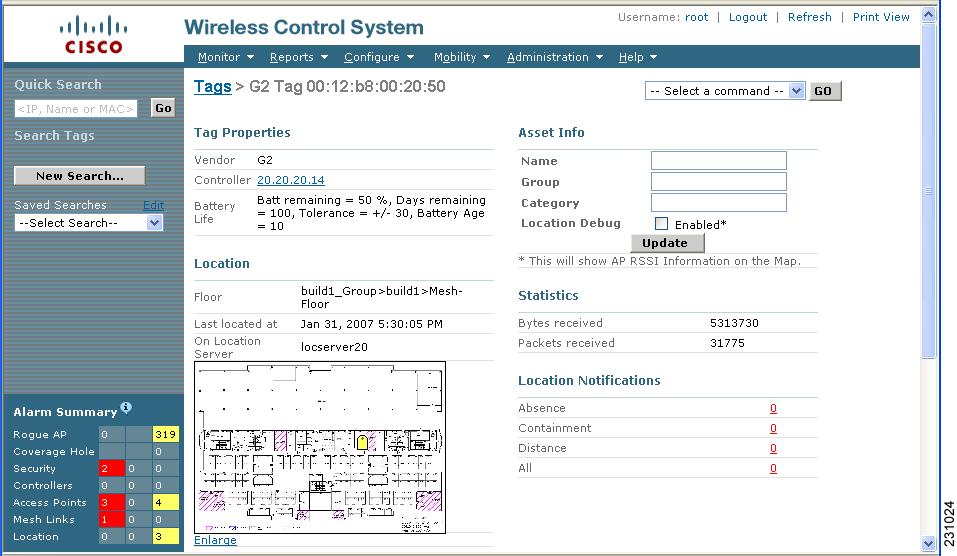
![]()
![]()
Note
Scroll down to the bottom of the window to see Telemetry and Emergency details for the tag (Figure 8-7).
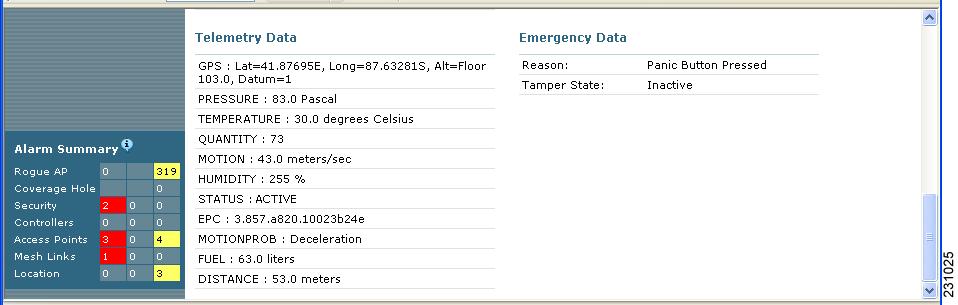
Figure 8-7 Tag Properties Window (bottom)
![]()
Overlapping Tags
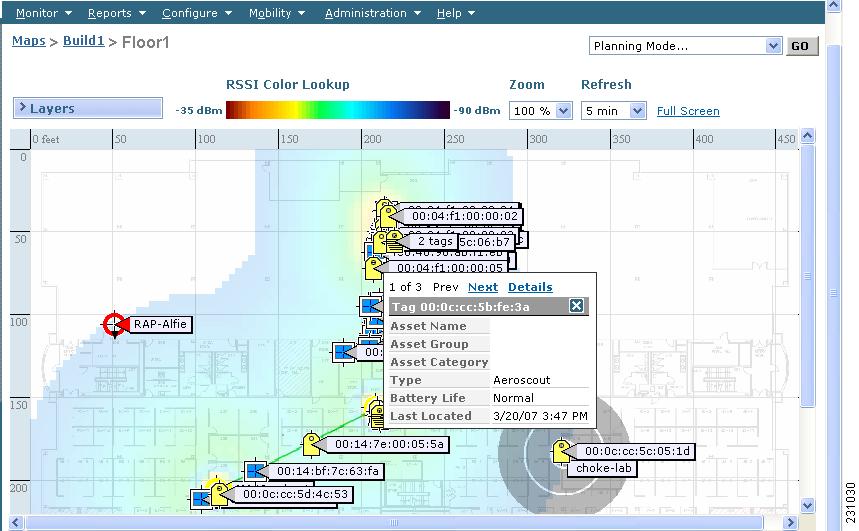
When multiple tags are within close proximity of one another a summary tag is used to represent their location on a WCS map (Monitor > Maps). The summary tag is labeled with the number of tags at that location.
When you move the mouse over the overlapping tag on the map, a panel appears with summary information for the overlapping tags (see Figure 8-8).
Select the Prev and Next links to move between the individual tag summary panels. To see detailed information on a specific tag, select the Details link while viewing the tag's summary information.
![]()
Note
•
Summary information for tags includes: Tag MAC address, Asset Name, Asset Group, Asset Category, Vendor (Type), Battery life and Last Located data (date and time). If the tag is Cisco CX v.1 compliant, telemetry information also appears.
•
Detailed information for tags includes this additional information: IP address of associated controller, statistics, location notifications, location history and whether the location debug feature is enabled.
–
To view location history for a tag, select that option from the Select a command drop-down menu and click GO.
–
To return to the details screen from the location history window, select the Tag Detail option and click GO.
Figure 8-8 Overlapping Tags Window
![]()
Monitoring Chokepoints
To monitor chokepoints, follow these steps:
Step 1
Click Monitor > Chokepoints. The Chokepoint > Search Results summary window appears showing all mapped chokepoints.
Step 2
To refine the search criteria when an extensive lists appears, you can search by MAC address or chokepoint name.
a.
To initiate a search for a chokepoint by its MAC address, select MAC address from the Search for Chokepoints by drop-down menu and enter the MAC address of the chokepoint in the field below. Click Search.
b.
To initiate a search for a chokepoint by its name, select Chokepoint Name from the Search for Chokepoints by drop-down menu and enter the chokepoint name in the field below. Click Search.
If no match exists, then a message indicating that appears in the window. Otherwise the search result displays.
Monitoring Location Sensors
To monitor location sensors, follow these steps:
Step 1
Click Monitor > Location Sensors. The Location Sensors > Search Results summary window appears showing all mapped location sensors.
Step 2
To refine the search criteria when an extensive lists appears, you can search by MAC address or location sensor name.
a.
To initiate a search for a location sensor by its MAC address, select MAC address from the Search for Location Sensor by drop-down menu and enter the MAC address of the location sensor in the field below. Click Search.
b.
To initiate a search for a location sensor by its name, select Location Sensor Name from the Search for Location Sensor by drop-down menu and enter the location sensor name in the field below. Click Search.
If no match exists, then a message indicating that appears in the window. Otherwise the search result displays.