Requirements and prerequisites for health monitoring
This reference provides the requirements and prerequisites needed to implement health monitoring functionality.
Model support
Any
Supported domains
Any
The documentation set for this product strives to use bias-free language. For the purposes of this documentation set, bias-free is defined as language that does not imply discrimination based on age, disability, gender, racial identity, ethnic identity, sexual orientation, socioeconomic status, and intersectionality. Exceptions may be present in the documentation due to language that is hardcoded in the user interfaces of the product software, language used based on RFP documentation, or language that is used by a referenced third-party product. Learn more about how Cisco is using Inclusive Language.
The following topics describe how to use health monitoring:
This reference provides the requirements and prerequisites needed to implement health monitoring functionality.
Any
Any
Health monitoring is a system capability that
tracks various health indicators to ensure hardware and software are working correctly,
checks the status of critical functionality across your deployment, and
enables configuration of test frequency for alerting and time series data collection.
Health monitoring includes two key capabilities: health status monitoring through health policies and health modules, and time series data collection for metrics analysis.
With time series data collection, you can configure how frequently metric data is collected for the device and its health modules. The device monitor reports these metrics in several predefined health monitor dashboards by default. This metric data is collected for analysis. Some alerts are generated from metric values when they cross the thresholds specified in the health policy.

You can use the health monitor to create a collection of tests, referred to as a health policy, and apply the health policy to one or more appliances. The tests, referred to as health modules, are scripts that test for the criteria you specify. You can modify a health policy by enabling or disabling tests or by changing test settings, and you can delete health policies that you no longer need. You can also suppress messages from selected appliances by excluding them.
The health monitoring system run the tests in a health policy at the configured intervals. You can also run all tests, or a specific test, on demand. The health monitor collects health events based on the test conditions configured.
Note |
All appliances automatically report their hardware status via the Hardware Alarms health module. The Cloud-Delivered Firewall Management Center also automatically reports status using the modules configured in the default health policy. Some health modules, such as the Appliance Heartbeat module, run on the Cloud-Delivered Firewall Management Center and report the status of the Cloud-Delivered Firewall Management Center's managed devices. For the health modules to provide managed device status, you must deploy all health policies to the device. |
You can use the health monitor to access health status information for the entire system and for a particular appliance. In a multi-domain deployment, you can view the health status summary for a device in the domain where the device is located.
A hexagon-shaped widget and status tables on the Health Status page provide a visual summary of the status of all appliances on your network, including the Cloud-Delivered Firewall Management Center. Individual appliance health monitors let you drill down into health details for a specific appliance.
Fully customizable event views allow you to quickly and easily analyze the health status events gathered by the health monitor. These event views allow you to search and view event data and to access other information that may be related to the events you are investigating. For example, if you want to see all the occurrences of CPU usage with a certain percentage, you can search for the CPU usage module and enter the percentage value.
You can also configure alerting in response to health events. A health alert is an association between a standard alert and a health status level. SNMP and syslog are not supported as the primary methods for sending health alerts to external systems. Use email or webhook alert responses for external health alerting. For example, if you want to make sure an appliance never fails due to hardware overload, you can set up an email alert. You can then create a health alert that triggers an email alert whenever CPU, disk, or memory usage reaches the Warning level you configure in the health policy applied to that appliance. You can set alerting thresholds to minimize the number of repeating alerts you receive.
Note |
The health monitoring can take 5–6 minutes from the occurrence of the health event to generate the health alert. |
You can also generate troubleshooting files for an appliance if you are asked to do so by Support.
In a Cloud-Delivered Firewall Management Center high availability deployment, the active peer creates a health monitor page that uses REST APIs to show detailed metric-based information. The standby peer creates the health monitor page that shows the alert information and provide a visual summary of the status of all appliances on your network using pie charts and status tables. The standby peer does not display the metric-based information.
Describes health modules that monitor system conditions and provide alerts or metrics for managing device health and performance.
Health modules, or health tests, test for the conditions that you specify in a health policy.
Health monitoring includes both health alerts or tests and metric or time series data collection. The two types of health modules are alert modules and metrics modules. Alerts modules (sometimes called legacy modules) monitor system infrastructure and report only the health status. When the conditions specified in the health policy for these monitored systems are met, these modules raise health alerts. Metrics modules (sometimes called telegraf modules) collect statistics (sometimes called time series data) that you can view on the health monitoring dashboard. Some alerts are also generated from metric values when they cross the thresholds specified in the health policy. You can create custom dashboards with your preferred health metrics, allowing you to monitor statistics or troubleshoot appliance health issues.
Note |
The health alerts generated from the Secure Firewall 200 series device is limited to the essential health modules, to optimize performance and ensure effective resource utilization. For more information about the available health modules, refer to Health alerts for Secure Firewall 200 Series device. |
|
Module |
Type |
Description |
||
|---|---|---|---|---|
|
AMP Connection Status |
Metrics |
The module alerts if the device cannot connect to the AMP cloud or Cisco AMP Private Cloud after an initial successful connection, or if the private cloud cannot contact the public AMP cloud. Disabled by default. |
||
|
AMP Threat Grid Connectivity |
Metrics |
The module alerts if the device cannot connect to the AMP Threat Grid cloud after an initial successful connection. |
||
|
ASP Drop |
Metrics |
Monitors the connections dropped by the data plane accelerated security path. |
||
|
Automatic Application Bypass |
Alert |
Monitors bypassed detection applications. |
||
|
Certificate Monitoring |
Alert |
Alerts when service authentication certificates are near expiration or have expired, based on a configurable threshold (in days). This alert helps you to identify certificates that are about to expire and renew them before a service disruption occurs. |
||
|
Chassis Environment Status |
Alert |
Monitors chassis parameters such as fan speed and chassis temperature, and enables you to set a warning threshold and critical
threshold for temperature. The Critical Chassis Temperature (Celsius) default value is |
||
|
Cluster/HA Failover Status |
Alert |
For threat defense clusters, alerts when a unit joins, leaves, or is elected primary. |
||
|
Configuration Resource Utilization |
Alert |
Alerts if the size of your deployed configurations puts a device at risk of running out of memory. The alert shows you how much memory your configurations require, and by how much this exceeds the available memory. If this happens, reevaluate your configurations. You may be able to reduce the number or complexity of access control rules or intrusion policies. |
||
|
Connection Statistics |
Metrics |
Monitors connection statistics and NAT translation counts. For standby Firewall Threat Defense devices in a high availability pair, this widget reflects only the statistics of connections replicated from the active device. |
||
|
CPU Usage (per core) |
Metrics |
Alerts when CPU core use exceeds a configurable threshold. |
||
|
Critical Process Statistics |
Metrics |
Monitors the state of critical processes, their resource consumption, and the restart counts. |
||
|
CPU Usage Date Plane |
Metrics |
Alerts when data plane CPU use exceeds a configurable threshold. |
||
|
Memory Usage Data Plane |
Metrics |
Alerts when data plane memory use exceeds a configurable threshold. |
||
|
Deployed Configuration Statistics |
Metrics |
Monitors statistics about the deployed configuration, such as the number of ACEs and IPS rules. |
||
|
Disk Status |
Alert |
Alerts if there is an issue with the hard disk or RAID controller. If this module alerts, contact Cisco TAC. This will prevent upgrade. |
||
|
Disk Usage |
Metrics |
This module compares disk usage on the appliance’s hard drive to the limits configured for the module and alerts when usage exceeds the thresholds configured for the module. This module also alerts when the system excessively deletes files in monitored disk usage categories, or when disk usage excluding those categories reaches excessive levels, based on module thresholds. Use the Disk Usage health status module to monitor disk usage for the Use the Clear disk space option to free up disk space by removing the temporary files from your threat defense device. For more information, refer to Clear disk space |
||
|
File System Integrity Check |
Alert |
This module performs a file system integrity check and runs if the system has CC mode or UCAPL mode enabled, or if the system runs an image signed with a DEV key. |
||
|
Firewall Threat Defense HA |
Alert |
Alerts if a threat defense high availability pair is split brain. |
||
|
Firewall Threat Defense Platform Faults |
Alert |
Monitors Secure Firewall 1000 /3100 /4200 platform faults and generate health alerts for the faults. A platform fault represents a failure in the Firewall Threat Defense instance or an alarm threshold that has been raised. During the lifecycle of a platform fault, it can change from one state or severity to another. Each fault includes information about the operational state of the affected object at the time the fault was raised. If the fault is transitional and the failure is resolved, then the object transitions to a functional state. For more information, refer to Cisco Firepower 1000/2100 FXOS Faults and Error Messages Guide. |
||
|
Flow Offload Statistics |
Metrics |
Monitors hardware flow offload. |
||
|
Hardware Alarms |
Alert |
This module determines if hardware needs to be replaced on a physical managed device and alerts based on the hardware status. It also reports on the status of hardware-related daemons. |
||
|
Identity Limits Monitor (supported only on Secure Firewall 200 Series devices) |
Alert |
Alerts when the device identity-related mappings and user-to-group mappings exceed the normal limit. Device identity-related mappings include user sessions, SGT Exchange Protocol (SXP) mappings, and dynamic object mappings. For more information, refer to Identity-limits-monitor. |
||
|
Inline Link Mismatch Alarms |
Alert |
Alerts if inline pair interfaces negotiate different speeds. |
||
|
Interface Status |
Alert |
Determines if the device currently collects traffic and alerts based on the traffic status of physical interfaces and aggregate interfaces. For physical interfaces, the information includes interface name, link state, and bandwidth. For aggregate interfaces, the information includes interface name, number of active links, and total aggregate bandwidth.
|
||
|
Intrusion and File Event Rate |
Alert |
Alerts if intrusion events per second exceed a configurable threshold. We recommend a warning threshold of 1.5 times your average intrusion event rate, and a critical threshold of 2.5 times. For example, for an average event rate on network segment of 20 events per second, we recommend a warning value of 30 and a critical value of 50. The critical limit must be lower than 1000, and higher than the warning limit. Event rates for your devices are available on System ( |
||
|
Link State Propagation |
Alert |
For the ISA 3000, alerts when an interface in a inline set fails. |
||
|
Memory Usage |
Alert |
Alerts when memory use exceeds configurable thresholds. For appliances with more than 4 GB of memory, the preset alert thresholds are based on a formula that accounts for proportions
of available memory likely to cause system problems. On >4 GB appliances, because the interval between Warning and Critical
thresholds may be very narrow, it is recommended that you manually set the Warning Threshold % value to Complex access control policies and rules can command significant resources and negatively affect performance. |
||
|
Network Card Reset |
Alert |
Alerts when a network card restarts due to hardware failure. |
||
|
NTP Statistics |
Metrics |
Monitors NTP synchronization status. Disabled by default. |
||
|
Firewall Management Center Access Configuration Changes |
Alert |
Monitors configuration changes made on the Cloud-Delivered Firewall Management Center directly using the configure network management-data-interface command. This module alerts when there is a conflict between the existing Cloud-Delivered Firewall Management Center configuration and the out of band configuration changes made. |
||
|
Process Status |
Alert |
Alerts when processes on the appliance exit or terminate outside of the process manager. If a process is deliberately exited outside of the process manager, the module status changes to Warning and the health event message indicates which process exited, until the module runs again and the process has restarted. If a process terminates abnormally or crashes outside of the process manager, the module status changes to Critical and the health event message indicates the terminated process, until the module runs again and the process has restarted. |
||
|
Routing Statistics |
Metrics |
Monitors the current state of routing table. |
||
|
Snort 3 Statistics |
Metrics |
Collects Snort 3 statistics for events, flows, and packets. This module also monitors metrics for sending advanced logging events and generates the following alerts:
|
||
|
CPU Usage Snort |
Metrics |
This module checks that the average CPU usage of the Snort processes on the device is not overloaded and alerts when CPU
usage exceeds the percentages configured for the module. The Warning Threshold % default value is |
||
|
Snort Identity Memory Usage |
Alert |
Enables you to set a warning threshold for Snort identity processing and alerts when memory usage exceeds the level configured
for the module. The Critical Threshold % default value is This health module specifically keeps track of the total space used for the user identity information in Snort. It displays the current memory usage details, the total number of user-to-IP bindings, and user-group mapping details. Snort records these details in a file. If the memory usage file is not available, the Health Alert for this module displays Waiting for data. This could happen during a Snort restart due to a new install or a major update, switch from Snort 2 to Snort 3 or back, or major policy deployment. Depending on the health monitoring cycle, and when the file is available, the warning disappears, and the health monitor displays the details for this module with its status turned Green. |
||
|
Memory Usage Snort |
Metrics |
This module checks the percentage of allocated memory used by the Snort process and alerts when memory usage exceeds the
percentages configured for the module. The Warning Threshold % default value is |
||
|
Snort Reconfiguring Detection |
Metrics |
Alerts if a device reconfiguration has failed. This module detects reconfiguration failure for both Snort 2 and Snort 3 instances. |
||
|
Snort Statistics |
Metrics |
Monitors Snort statistics for events, flows, and packets. |
||
|
SSE Connection Status |
Metrics |
The module alerts if the device cannot connect to the security services exchange cloud after an initial successful connection. Disabled by default. |
||
|
CPU Usage System |
Metrics |
This module checks that the average CPU usage of all system processes on the device is not overloaded and alerts when CPU
usage exceeds the percentages configured for the module. The Warning Threshold % default value is |
||
|
Threat Data Updates on Devices |
Alert |
Certain intelligence data and configurations that devices use to detect threats are updated on the Cloud-Delivered Firewall Management Center from the cloud every 30 minutes. This module alerts you if this information has not been updated on the devices within the time period you have specified. Note that the Secure Firewall 200 series device does not maintain a local URL database and supports Cloud Only lookup. Local URL database related alerts are not available for this device type. Monitored updates include:
By default, this module sends a warning after 1 hour and a critical alert after 24 hours. If this module indicates failure on the Cloud-Delivered Firewall Management Center or on any devices, verify that the Cloud-Delivered Firewall Management Center can reach the devices. |
||
|
VPN Statistics |
Metrics |
Monitors site-to-site and remote access VPN tunnels between Firewall Threat Defense devices. |
||
|
XTLS Counters |
Metrics |
Monitors XTLS/SSL flows, memory and cache effectiveness. Disabled by default. |
|
Module |
Type |
Description |
||||
|---|---|---|---|---|---|---|
|
Secure Endpoint Status |
Alert |
The module alerts if the Cloud-Delivered Firewall Management Center cannot connect to the AMP cloud or Cisco AMP Private Cloud after an initial successful connection, or if the private cloud cannot contact the public AMP cloud. It also alerts if you deregister an AMP cloud connection using the Secure Endpoint management console. |
||||
|
AMP for Firepower Status |
Alert |
Alerts if:
If your Cloud-Delivered Firewall Management Center loses connectivity to the Internet, the system may take up to 30 minutes to generate a health alert. |
||||
|
Appliance Heartbeat |
Alert |
This module determines if an appliance heartbeat is being heard from the appliance and alerts based on the appliance heartbeat status. |
||||
|
Dynamic Attributes Connector |
Alert |
This module indicates the operational status of the Dynamic Attributes Connector service. |
||||
|
Health Monitor Process |
Alert |
Monitors the health process itself, and alerts if there have been no health events in some number of minutes (configurable). |
||||
|
ISE Connection Monitor |
Alert |
This module monitors the status of the server connections between the Cisco Identity Services Engine (ISE) and the Cloud-Delivered Firewall Management Center. ISE provides additional user data, device type data, device location data, SGTs (Security Group Tags), and SXP (Security Exchange Protocol) services. |
||||
|
License Monitor |
Alert |
This module monitors expiration of Classic licenses. |
||||
|
Local Malware Analysis |
Alert |
This module monitors ClamAV updates for Local Malware Analysis. |
||||
|
Process Status |
Alert |
Alerts when processes on the appliance exit or terminate outside of the process manager. If a process is deliberately exited outside of the process manager, the module status changes to Warning and the health event message indicates which process exited, until the module runs again and the process has restarted. If a process terminates abnormally or crashes outside of the process manager, the module status changes to Critical and the health event message indicates the terminated process, until the module runs again and the process has restarted. |
||||
|
Security Intelligence |
Alert |
Alerts if Security Intelligence is in use and the Cloud-Delivered Firewall Management Center cannot update a feed, or feed data is corrupt or contains no recognizable IP addresses. Refer to the Threat Data Updates on Devices module. |
||||
|
Smart License Monitor |
Alert |
Monitors Smart Licensing status and alerts if:
|
||||
|
Threat Data Updates on Devices |
Alert |
Certain intelligence data and configurations that devices use to detect threats are updated on the Cloud-Delivered Firewall Management Center from the cloud every 30 minutes. This module alerts you if this information has not been updated on the devices within the time period you have specified.
Monitored updates include:
By default, this module sends a warning after 1 hour and a critical alert after 24 hours. If this module indicates failure on the Cloud-Delivered Firewall Management Center or on any devices, verify that the Cloud-Delivered Firewall Management Center can reach the devices. |
||||
|
Time Synchronization Status |
Alert |
This module tracks the synchronization of a device clock that obtains time using NTP with the clock on the NTP server and alerts if the difference in the clocks is more than ten seconds. |
||||
|
Unresolved Groups Monitor |
Alert |
Monitors Foreign Security Principals (FSPs) that are groups used in policies. Security principals are Active Directory objects, like authenticated user groups, to which security can be applied in access control policies. This module generates a warning alert for unresolved groups that exist but are not used in policies, and a critical alert for unresolved groups that are used in policies. |
||||
|
URL Filtering Monitor |
Alert |
Monitors connectivity with the Cisco cloud, which is required for downloading URL filtering data and doing URL filtering lookups. |
||||
|
VPN Tunnel Status |
Alert |
Alerts when VPN tunnels are down. Supported for both remote access and site-to-site VPN . |
||||
|
Zero-Touch Provisioning |
Alert |
Alerts if there is a failure when registering a device using the serial number. It also shows errors related to zero-touch provisioning capable Cloud-Delivered Firewall Management Center s in high availability. |
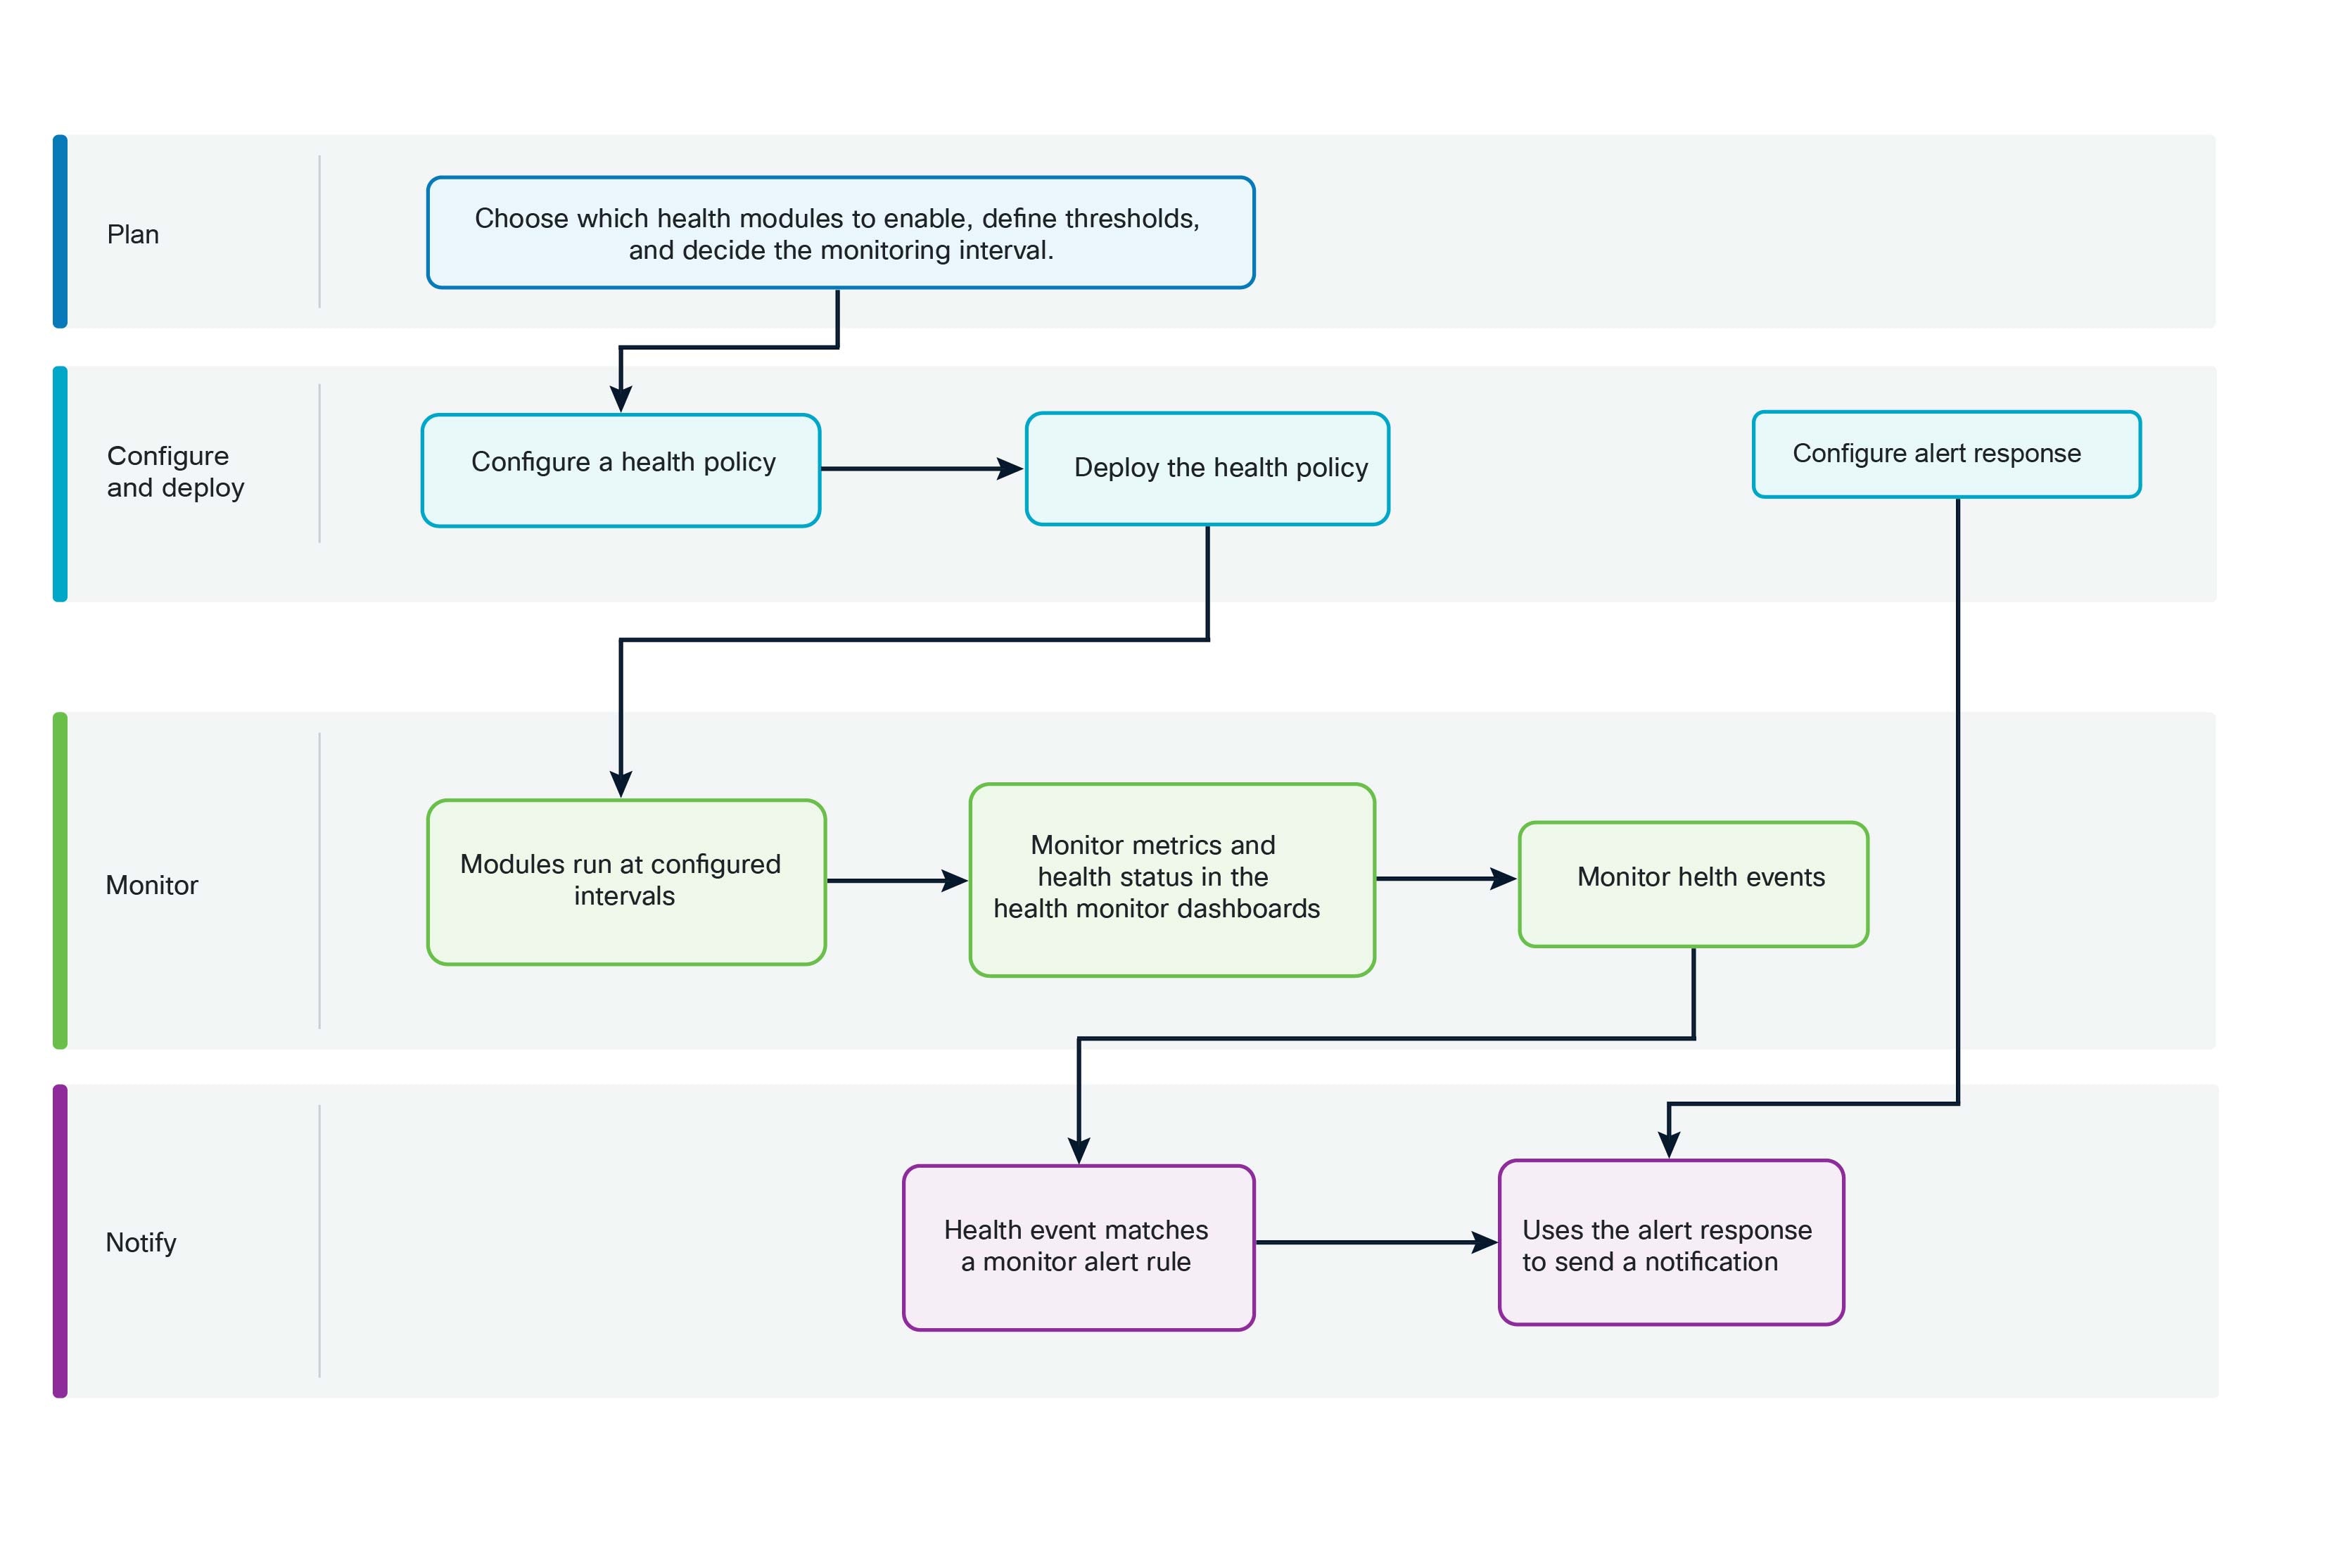
Health monitoring enables proactive management of network appliances by tracking their operational status using customizable policies and alert mechanisms. You can configure specific monitoring policies for different appliance types, enabling only the relevant tests for each type.
|
Step 1 |
Determine which health modules you want to monitor as discussed in Health modules. You can set up specific policies for each kind of appliance, enabling only the appropriate tests for that appliance.
|
||
|
Step 2 |
Apply a health policy to each appliance where you want to track health status as discussed in Create a health policy. |
||
|
Step 3 |
(Optional.) Configure health monitor alerts as discussed in Create a health monitor alert. You can set up email or webhook alerts that trigger when the health status level reaches a particular severity level for specific health modules. |
A health policy is a configuration framework that
enables you to define test criteria for monitoring the health of appliances,
allows selective enabling of health modules and critical alert settings, and
provides flexibility to apply, customize, or use default policies for each appliance.
When you configure a health policy, you decide whether to enable each health module for that policy. You also select the criteria that control which health status each enabled module reports each time it assesses the health of a process.
You can enable or disable health alerts for individual attributes within a health module. By adjusting the settings for health alerts at the attribute level, you can reduce the number of health alerts and streamline your focus on the most critical health alerts without interrupting data collection. You can continue to monitor the attribute from your Health Monitor dashboard. When you enable a health module in the health policy, the health alert configuration for all the attributes within that health module gets enabled by default.
You can create one health policy that can be applied to every appliance in your system, customize each health policy to the specific appliance where you plan to apply it, or use the default health policy provided for you.
Note |
When you register an appliance, the Cloud-Delivered Firewall Management Center automatically assigns it the default health policy. To disassociate a health policy from an appliance, you must first associate a different health policy with it. An appliance must have at least one health policy assigned. |
The Cloud-Delivered Firewall Management Center setup process creates and applies an initial health policy, in which most—but not all—available health modules are enabled. The system also applies this initial policy to devices added to the Cloud-Delivered Firewall Management Center.
This initial health policy is based on a default health policy. You cannot view or edit the default health policy, but you can copy it when creating a custom health policy.
You can create a custom health policy and set it as your default health policy. The Cloud-Delivered Firewall Management Center applies the default health policy to any managed device when you add the device to the Cloud-Delivered Firewall Management Center. Note that you cannot delete the health policy that you have set as the default. For detailed instructions for setting a default health policy, refer to Set a default health policy.
When you upgrade the Cloud-Delivered Firewall Management Center, any new health modules are added to all health policies, including the initial health policy, default health policy, and any other custom health policies. Usually, new health modules are added in an enabled state.
Note |
For a new health module to begin monitoring and alerting, reapply health policies after upgrade. |
If you want to customize a health policy to use with your appliances, you can create a new policy. The settings in the policy initially populate with the settings from the health policy you choose as a basis for the new policy. You can edit the policy to specify your preferences, such as enable or disable modules within the policy, change the alerting criteria for each module as needed, and specify the run time intervals.
|
Step 1 |
Choose System ( |
|
Step 2 |
Click Create Policy. |
|
Step 3 |
Enter a name for the policy. Note that the following names are reserved for the default policies, and you cannot create a health policy using these names:
|
|
Step 4 |
Choose the existing policy that you want to use as the basis for the new policy from the Base Policy drop-down list. |
|
Step 5 |
Enter a description for the policy. |
|
Step 6 |
Choose Save. |
Apply the health policy on devices as described in Apply a health policy.
Edit the policy to specify the module-level policy settings as described in Edit a health policy.
When you apply a health policy to an appliance, the health tests for all the modules you enabled in the policy automatically monitor the health of the processes and hardware on the appliance. Health tests then continue to run at the intervals you configured in the policy, collecting health data for the appliance and forwarding that data to the Cloud-Delivered Firewall Management Center.
If you enable a module in a health policy and then apply the policy to an appliance that does not require that health test, the health monitor reports the status for that health module as disabled.
If you apply a policy with all modules disabled to an appliance, it removes all applied health policies from the appliance, so no health policy is applied. However, you must have at least one health policy assigned to an appliance.
When you apply a different policy to an appliance that already has a policy applied, expect some latency in the display of new data based on the newly applied tests.
|
Step 1 |
Choose System ( |
||
|
Step 2 |
Click the Deploy health policy ( |
||
|
Step 3 |
Choose the appliances where you want to apply the health policy.
|
||
|
Step 4 |
Click Apply to apply the policy to the appliances you chose. |
The health policy is successfully applied to the selected appliances, and monitoring begins automatically.
Optionally, monitor the task status; see View task messages.
Monitoring of the appliance starts when the policy is successfully applied.
Edit a health policy when you need to adjust which modules are monitored, change critical or warning thresholds, or reassign policies to different devices.
Ensure you have access to Cloud-Delivered Firewall Management Center.
Identify the health policy you need to modify.
|
Step 1 |
Choose System ( |
||
|
Step 2 |
Click Edit ( |
||
|
Step 3 |
To edit the policy name and its description, click the Edit ( |
||
|
Step 4 |
The Health Modules tab displays all the device modules and its attributes. Configure your health modules using the following actions:
For information on the modules, refer to Health modules. |
||
|
Step 5 |
Where appropriate, set the Critical and Warning threshold percentages. |
||
|
Step 6 |
In the Settings tab, enter the relevant values in the fields:
|
||
|
Step 7 |
To view and modify the devices to which the policy is assigned, do the following:
Alternatively, you can apply the health policy to your appliance as described in Apply a health policy Apply the health policy to each appliance where you want to track health status. When you apply the health policy to an appliance, all the modules you enabled in the policy monitor the health of the processes and hardware on the appliance, and forwards that data to the Cloud-Delivered Firewall Management Center. |
||
|
Step 8 |
Click Save. |
You can set a user-created health policy as your default health policy. The Cloud-Delivered Firewall Management Center applies the default health policy to any managed device when you add the device to the Cloud-Delivered Firewall Management Center.
Note |
Setting a new default health policy does not affect the health policy assigned to devices that are already registered. |
|
Step 1 |
Choose System ( |
|
Step 2 |
Click the More Actions
( |
|
Step 3 |
Click Proceed. |
You can delete health policies that you no longer need. However, an appliance must have at least one health policy assigned to it. If you delete a policy that is still applied to an appliance, the policy settings remain in effect until you apply a different policy. In addition, if you delete a health policy that is applied to a device, any health monitoring alerts in effect for the device remain active until you disable the underlying associated alert response.
Note |
To stop health monitoring for an appliance, create a health policy with all modules disabled and apply it to the appliance. |
|
Step 1 |
Choose System ( |
|
Step 2 |
Click Delete ( |
|
Step 3 |
Click Delete health policy to delete it. Note that you cannot delete a health policy that is set as the default policy. Set another health policy as the default before attempting to delete the current default policy. For more information, refer to Set a default health policy. |
OpenConfig is a vendor-independent software layer that provides a single way of streaming network telemetry data to multiple vendors to manage and monitor networks. The OpenConfig streaming telemetry option in the secure firewall uses gNMI (gRPC Network Management Interface) protocol and allows you to control and generate telemetry streams from your Firewall Threat Defense devices to a data collection system.
The Firewall Threat Defense health policy contains all the configurations to support and enable the OpenConfig streaming telemetry functionality. When you deploy the health policy to the device, the OpenConfig streaming telemetry configuration activates a gNMI server and starts listening to Remote Procedure Call (RPC) messages from the data collectors.
OpenConfig uses a subscription-based model where the data collectors query the Firewall Threat Defense devices for telemetry data or act as collector for the streamed telemetry data. When a data collector wishes to receive updates and metrics from the Firewall Threat Defense device, it sends a subscribeRequest RPC message to the Firewall Threat Defense gNMI server. The subscription request includes details of one or more paths to which the data collector wishes to subscribe. The message also includes subscription mode which describes the longevity of the subscription.
The Firewall Threat Defense server supports these subscription modes:
Once subscription: The Firewall Threat Defense device sends requested data to the gNMI paths only once.
Stream subscription: The Firewall Threat Defense continuously streams telemetry data according to the triggers specified in the SubscribeRequest RPC message.
Sampled subscription: The Firewall Threat Defense server streams the requested data as per the interval specified in the subscription message. The minimum interval that the threat defense support is one minute.
On-change subscription: The Firewall Threat Defense sends the data whenever the requested values change.
The Firewall Threat Defense server generates SubscribeResponse RPC messages according to the type of subscription that is created, at the frequency requested by the data collectors.
You can use these deployment modes for OpenConfig streaming telemetry configuration:
DIAL-IN: In this mode, the gNMI server opens a port on the Firewall Threat Defense and waits for SubscribeRequest RPC messages from data collectors. In the device health policy, you can specify the port number to use by the gNMI server
and the IP address of the data collector that can connect with the gNMI service. If not specified, the gNMI server uses port
number 50051. The DIAL-in mode is ideal to use in a trusted network where the endpoint that subscribes to telemetry streams
are trusted.
DIAL-OUT: The gNMI service is designed to work in server mode where it accepts subscription requests from gNMI data collectors and serve the telemetry data. If the gNMI data collectors cannot reach the gNMI server, the Firewall Threat Defense uses a tunnel client and establishes a gRPC tunnel with the external server. This tunnel allows exchange of RPC messages between gNMI server and client. The DIAL-OUT mode is ideal to use when the data collectors are hosted on the cloud or outside the trusted network.
In both DIAL-IN and DIAL-OUT mode, all the communication between gNMI server and gNMI client uses TLS encryption and this requires to generate a set of certificates with private keys for the TLS encryption. DIAL-OUT mode requires extra keys for the tunnel infrastructure. For more information, refer to How to Generate Certificate with Private Key.
Certificates and private keys are required for OpenConfig streaming telemetry. You must use the same certificate authority (CA) for all components to ensure secure and consistent authentication.
Note |
To ensure that you generate certificates using the same CA, run these commands together and from the same endpoint. If you want to retry the commands, you must retry all commands. |
|
Step 1 |
Make a folder, for example Example:
|
||
|
Step 2 |
Create a self-signed CA certificate with a corresponding private key. Example:The subject information includes the provided Country (C), State (ST), Locality (L), Organization (O), Organizational Unit (OU), Common Name (CN), and email address. The private key is saved as |
||
|
Step 3 |
Create a self-signed server certificate with the specified Common Name (CN) and Subject Alternative Name (SAN): Example:
The The The You have to upload the |
||
|
Step 4 |
Create client certificate with the specified Common Name (CN) and Subject Alternative Name (SAN). Example:The gNMI client uses the client certificate |
||
|
Step 5 |
(Optional) For dial-out mode, create the tunnel server certificate with the specified Common Name (CN) and Subject Alternative Name (SAN). Example: |
OpenConfig streaming telemetry allows network monitoring systems to collect real-time data from threat defense devices using the gNMI protocol. This configuration supports both DIAL-IN and DIAL-OUT deployment modes for flexible integration with existing network management infrastructure.
Make sure the Firewall Threat Defense device where you want to deploy the health policy configuration allows installation of the SSL certificate and PRIVATE KEY.
Ensure that you configure a gNMI client that supports the OpenConfig streaming telemetry implementation, from which you can make the gRPC requests to the gNMI server on the Firewall Threat Defense.
To use DIAL-OUT mode and configure OpenConfig streaming telemetry, ensure that you configure a gRPC tunnel server and client on the management system. This tunnel configuration enables communication between the gNMI client and the Firewall Threat Defense device.
Follow these steps to configure OpenConfig streaming telemetry:
|
Step 1 |
Choose System ( |
|
Step 2 |
Click the Edit health policy icon next to the threat defense health policy that you want to modify. |
|
Step 3 |
Go to the Settings tab. |
|
Step 4 |
Move the OpenConfig Streaming Telemetry slider to enable the configuration. This configuration is disabled by default. |
|
Step 5 |
Upload the SSL Certificate. The gNMI server uses this certificate to enable server authentication for the TLS connection and encrypt all communications through the channel. The OpenConfig streaming telemetry configuration supports only certificate with PEM format. |
|
Step 6 |
(Optional) Specify the Passphrase if the PRIVATE KEY files are ENCRYPTED. |
|
Step 7 |
Choose the deployment mode to use for streaming telemetry over gNMI protocol. For DIAL-IN mode:
For DIAL-OUT mode:
|
|
Step 8 |
Specify the username and password to validate the gNMI collector. The Firewall Threat Defense server uses this credential to authenticate the gNMI collector when receiving the SubscribeRequest RPC message. Each telemetry message is not authenticated using the username and password. The system uses the previously authenticated ENCRYPTED streaming channel to carry telemetry messages. |
|
Step 9 |
Click Save. |
Deploy the health policy to your Firewall Threat Defense device, for the configuration changes to take effect.
This reference provides troubleshooting procedures for OpenConfig streaming telemetry issues including certificate errors, server response failures, and status verification methods.
Ensure that you have uploaded the correct certificate to the Cloud-Delivered Firewall Management Center.
Verify the certificate and key generation steps. Ensure that the IP Subject Alternative Name (SAN) is specified correctly.
If the Cloud-Delivered Firewall Management Center displays the error "Request was made for (IP), but the certificate is not valid for (IP)" then verify the server certificate and key generation steps.
Ensure that the IP SAN is correctly specified in the server certificate. If the configuration applies to more than one Firewall Threat Defense device, you must specify all the devices in the IP SAN field.
If you are using dial-out mode, ensure that the client IP is specified in the server certificate.
If you receive "Failed to generate response object, did not receive any data" error, the gNMI input plug-in is waiting for metric export. This is the sample response that appears when the telegraf is restarting:
root@cronserver:/home/secanup/openconfig-test# gnmic -a $ADDRESS:$PORT --tls-cert $CLIENTCERT --tls-ca $CACERT --tls-key $CLIENTKEY -u $USER -p $PASS sub --mode once --path "openconfig-system/system/memory"
rpc error: code = Aborted desc = Error in gnmi_server: failed to generate response object.did not receive any data
Error: one or more requests failed
Wait for the gNMI input plug-in to restart and retry your request.
When telegraf is not responding, restart the process using this command on the Firewall Threat Defense CLI console:
pmtool restartbyid hmdaemon
When OpenConfig streaming telemetry is enabled, to know the status of the gNMI server, run this command using the Firewall Threat Defense CLI console:
curl localhost:9275/OpenConfig/status
This is the sample response to the command:
root@firepower:/home/admin# curl localhost:9275/openconfig/status
Mode (Dialin/Dialout): DialIn
Subscription Details:
Active Subscription Details:
Stream Mode Subscription Details:
Total Stream Subscription Request Count: 1
'Ip of Collector- Subscribe paths:'
172.16.0.101:45826:
- /openconfig-system/system/state/hostname
Sample Subscription Count: 1
On Change Subscription Count: 0
Once Mode Subscription Details:
Total Subscription Request Count: 0
Total Subscription Count: 0
'Ip of Collector- Subscribe paths:': {}
Total Subscription Details:
Stream Mode Subscription Details:
Total Stream Subscription Request Count: 1
'Ip of Collector- Subscribe paths:':
172.16.0.101:45826:
- /openconfig-system/system/state/hostname
Sample Subscription Count: 1
On Change Subscription Count: 0
Once Mode Subscription Details:
Total Subscription Request Count: 0
Total Subscription Count: 0
'Ip of Collector- Subscribe paths:': {}
A device exclusion is a health monitoring configuration that
prevents deliberate device or module outages from affecting the overall health summary,
allows administrators to temporarily disable health monitoring for selected devices, Cloud-Delivered Firewall Management Center where supported, or specific health modules, and
ensures health events generated during exclusion are marked as disabled and do not affect health calculations.
In the course of normal network maintenance, you may disable managed devices or make them temporarily unavailable. In Cloud-Delivered Firewall Management Center, you can also exclude Cloud-Delivered Firewall Management Center health monitoring where applicable. Because those outages or expected conditions are deliberate, you may not want their health status to affect the overall health summary.
When you disable health monitoring status, health events are still generated, but they have a disabled status and do not affect the health status for the health monitor. If you remove the device or module from the excluded list, the events that were generated during the exclusion continue to show a status of disabled.
Note |
If all health modules or a device are added to the exclusion list, the device's health status will be set to disabled. This status refers only to health monitoring and should not be interpreted as the device being offline or disconnected. |
You can also disable an individual health module. For example, when you reach the host limit on the Cloud-Delivered Firewall Management Center, you can disable Host Limit status messages. Excluding health modules for individual interfaces is not supported on devices operating in transparent mode.
Note that on the main Health Monitor page you can distinguish between devices that are excluded if you expand to view the list of devices with a particular status by clicking the arrow in that status row.
Note |
On Cloud-Delivered Firewall Management Center, Health Monitor exclusion settings are local configuration settings. Therefore, if you exclude a device, then delete it and later re-register it with the Cloud-Delivered Firewall Management Center, the exclusion settings remain persistent. The newly re-registered device remains excluded. |
You can use the health monitor exclude feature to disable health monitoring status reporting for a device, Cloud-Delivered Firewall Management Center where applicable, or specific health modules. For example, if you know that a segment of your network will be unavailable, you can temporarily disable health monitoring for a managed device on that segment to prevent the health status on the Cloud-Delivered Firewall Management Center from displaying a warning or critical state because of the lapsed connection to the device.
To temporarily disable health events from a managed device, or from Cloud-Delivered Firewall Management Center where supported, go to the exclusion configuration page and add the target to the exclusion list. After the setting takes effect, the system no longer considers the excluded device when calculating the overall health status. The Health Monitor Appliance Status Summary lists the device as disabled.
Exclude devices from health monitoring to disable their events and health status when needed for maintenance or troubleshooting purposes.
You can exclude managed devices individually or by group, model, associated health policy, or other supported scope. In Cloud-Delivered Firewall Management Center exclusion can also apply to Cloud-Delivered Firewall Management Center where supported.
If you need to set the events and health status for an individual managed device to disabled, you can exclude the device from health monitoring. Where supported, you can also exclude Cloud-Delivered Firewall Management Center health monitoring. After the exclusion settings take effect, the device shows as disabled in the Health Monitor Appliance Module Summary, and health events for the device have a status of disabled.
|
Step 1 |
Choose System ( |
|
Step 2 |
Click Add Device. |
|
Step 3 |
In the Device Exclusion dialog box, under Available Devices, click Add ( |
|
Step 4 |
Click Exclude. The selected device is displayed in the exclusion main page. |
|
Step 5 |
To remove the device from the exclusion list, click Delete ( |
|
Step 6 |
Click Apply. |
Excluding health policy modules is useful when certain modules produce irrelevant or temporary health alerts, which you do not want to affect the overall device status. Exclusion settings indicate the number of modules excluded from health monitoring.
Note |
Excluding health modules for individual interfaces is not supported on devices operating in transparent mode. |
Tip |
Make sure that you keep track of individually excluded modules so you can reactivate them when you need them. You may miss essential warning or critical messages if you accidentally leave a module disabled. |
|
Step 1 |
Choose System ( |
||
|
Step 2 |
Click Edit ( |
||
|
Step 3 |
In the Exclude Health Modules dialog box, by default, all the modules of the device are excluded from health monitoring. Certain modules are applicable to a specific device only; for more information, refer to Health modules. |
||
|
Step 4 |
To choose modules to be excluded from health monitoring, click the Enable Module Level Exclusion link. The Exclude Health Modules dialog box displays all the modules of the device. The modules that are not applicable for the associated health policies are disabled by default. To exclude a module, perform these steps:
|
||
|
Step 5 |
(Optional) To stop receiving health status updates for physical interfaces and instead focus on the health status of their subinterfaces, you can disable health monitoring for the physical interfaces while continuing to monitor and receive health alerts for the subinterfaces.
|
||
|
Step 6 |
If you select an Exclude Period other than Permanent, for your exclusion configuration, you can choose to automatically delete the configuration when it expires. To enable this setting, check the Auto-delete expired configurations check box. |
||
|
Step 7 |
Click OK. |
||
|
Step 8 |
Click Apply.
|
Use interface exclusion when you want to suppress health status updates for selected physical interfaces without suppressing health monitoring for the entire device. Interface exclusion is useful when interface state is expected during maintenance or when you want to focus on subinterface health instead of physical interface status.
When you configure interface exclusion, select the physical interfaces that you want to exclude from the list of available interfaces. Depending on the available UI options in your version, selecting a physical interface can also exclude its subinterfaces. If subinterface controls are available, you can continue monitoring subinterfaces while excluding only the physical interface.
Use this option to reduce unnecessary health alerts when traffic loss or interface state changes are expected on a physical interface.
When monitoring device or module health, some items may have temporary exclusions. Once these exclusion periods lapse, you need to decide whether to renew the exclusion or clear the device/module from exclusion so alerts resume.
|
Step 1 |
Choose System ( The Warning ( |
|
Step 2 |
To renew the exclusion of the device, click Edit ( |
|
Step 3 |
To clear the device from being excluded, click Delete ( |
|
Step 4 |
To renew or clear the modules from exclusion, click Edit ( |
A health monitor alert is a notification mechanism that
provides email or webhook notifications when module status changes occur,
enables association of alert responses with health event levels to trigger notifications based on event severity, and
allows customization to monitor specific system conditions such as disk space thresholds.
If you are concerned that your appliances may run out of hard disk space, you can automatically send an email to a system administrator when the remaining disk space reaches the warning level. If the hard drive continues to fill, you can send a second email when the hard drive reaches the critical level.
The alerts generated by the health monitor contain specific information that helps identify issues and their severity.
Health monitor alerts include these attributes:
Severity: Indicates the severity level of the alert.
Module: Specifies the health module whose test results triggered the alert.
Description: Includes the health test results that triggered the alert.
The table describes these severity levels.
|
Severity |
Description |
|---|---|
|
Critical |
The health test results met the criteria to trigger a Critical alert status. |
|
Warning |
The health test results met the criteria to trigger a Warning alert status. |
|
Normal |
The health test results met the criteria to trigger a Normal alert status. |
|
Error |
The health test did not run. |
|
Recovered |
The health test results met the criteria to return to a normal alert status, following a Critical or Warning alert status. |
To optimize performance and ensure effective resource utilization, the health alerts in the Secure Firewall 200 Series device are limited only to the essential health modules. This table lists the health modules in the Secure Firewall 200 Series device, which generate health alerts. You can view all the metrics in the health monitoring dashboard, which is similar to that of other Threat Defense device models.
|
Health Module |
Health Alert |
|---|---|
|
Certificate Monitoring |
Alerts when service authentication certificates are nearing expiration or have expired. |
|
Cluster/HA Failure Status |
Provide alerts when a device joins, leaves, or is elected as the primary unit. |
|
Database |
Provide alerts on database integrity issues related to schema or configuration data. |
|
Disk Usage |
Monitors disk usage in the device's hard drive and alerts when usage exceeds the configured thresholds. |
|
Disk Status |
Provide alerts on hard disk or RAID controller issues. |
|
Firewall Threat Defense Platform Faults |
Monitors platform faults and generates health alerts for them. |
|
FXOS Health |
Alerts when the FXOS HTTPS service is not running in the device. |
|
Identity Process |
Monitors the health and operation of identity-related services. |
|
Inline Link Mismatch Alarms |
Provide alerts if inline pair interfaces negotiate different speeds. |
|
Interface Statistics |
Determines if the device currently collects traffic and alerts based on the traffic status of physical interfaces and aggregate interfaces. |
|
Out of band Configuration Changes |
Alerts when there is a conflict between the existing Cloud-Delivered Firewall Management Center configuration and the out-of-band configuration changes that are made. |
|
Process Status |
Provide alerts when processes in the device are terminated outside of the process manager. |
|
Snort Identity Memory Usage |
Enables you to set a warning threshold for Snort identity processing, and alerts when memory usage exceeds the level that is configured for the module. |
|
Snort Reconfiguring Detection |
Alerts if a device reconfiguration has failed. |
|
Threat Data Updates on Devices |
Monitors updates of threat intelligence data and alerts if this information has not been updated in the devices within the time period you have specified. |
Caution |
Generating troubleshooting files in a Firewall Threat Defense device is a CPU-intensive task. Because of limited CPU resources in the Secure Firewall 200 Series device, you may observe higher CPU usage and associated health alerts during this process. To prevent any potential traffic disruption, it's recommended to generate troubleshooting files only when the device is not actively handling network traffic. |
Note |
|
When you create a health monitor alert, you create an association between a severity level, a health module, and an alert response. You can use an existing alert or configure a new one specifically to report on system health. When the severity level occurs for the selected module, the alert triggers.
If you create or update a threshold in a way that duplicates an existing threshold, you are notified of the conflict. When duplicate thresholds exist, the health monitor uses the threshold that generates the fewest alerts and ignores the others. The timeout value for the threshold must be between 5 and 4,294,967,295 minutes.
Ensure that you have configured alert responses that govern the Cloud-Delivered Firewall Management Center's communication with the email server or webhook where you send the health alert; For more information, refer to Configuring external alerts with alert responses.
|
Step 1 |
Choose System ( |
|
Step 2 |
Click Add. |
|
Step 3 |
In the Add Health Alert dialog box, enter a name for the health alert in the Health Alert Name field. |
|
Step 4 |
From the Severity drop-down list, choose the severity level you want to use to trigger the alert. |
|
Step 5 |
From the Alert drop-down list, choose the alert response that you want to trigger when the specified severity level is reached. If you have not yet configured the alert responses, click Alerts to visit the Alerts page and set them. |
|
Step 6 |
From the Health Modules list, choose the health policy modules for which you want the alert to apply. |
|
Step 7 |
Optionally, in the Threshold Timeout field, enter the number of minutes that should elapse before each threshold period ends and the threshold count resets. Even if the policy run time interval value is less than the threshold timeout value, the interval between two reported health events from a given module is always greater. For example, if you change the threshold timeout to 8 minutes and the policy run time interval is 5 minutes, there is a 10-minute interval (5 x 2) between reported events. |
|
Step 8 |
Click Save to save the health alert. |
Administrators may need to update the alert parameters for health monitor alerts in order to adjust severity, change modules, or select different responses as requirements evolve.
Follow these steps to edit health monitor alerts:
|
Step 1 |
Choose System ( |
|
Step 2 |
Click the Edit ( |
|
Step 3 |
In the Edit Health Alert dialog box, from the Alert drop-down list, select the required alert entry, or click Alerts link to configure a new alert entry. |
|
Step 4 |
Click Save. |
Health monitor alerts notify you about system events, issues, or warnings. You may need to delete outdated or irrelevant alerts to streamline monitoring.
|
Step 1 |
Choose System ( |
|
Step 2 |
Click Delete ( |
|
Step 3 |
Click Delete health alert to delete it. |
Disable or delete the underlying alert response to ensure that alerting does not continue. For more information, refer to Configuring external alerts with alert responses.
The health monitor provides the compiled health status for all devices managed by the Cloud-Delivered Firewall Management Center, plus the Cloud-Delivered Firewall Management Center itself.
The health monitor is composed of:
The Health Status summary page ― Provides you with an at-a-glance view of the health of the Cloud-Delivered Firewall Management Center and all of the devices that the Cloud-Delivered Firewall Management Center manages. In a multi-domain deployment, you can view the health status summary for a device in the domain where the device is located. Devices are listed individually, or grouped according to their geolocation, high availability, or cluster status where applicable.
View the health summary of the Cloud-Delivered Firewall Management Center and any device when you hover on the hexagon that represents the device health.
The dot to the left of a device indicates its health:
Green ― No alarms.
Orange ― At least one health warning.
Red ― At least one critical health alarm.
The Monitoring navigation pane ― Allows you to navigate the device hierarchy. You can view health monitors for individual devices from the navigation pane.
|
Step 1 |
Choose System ( |
|
Step 2 |
View the status of the Cloud-Delivered Firewall Management Center and its managed devices in the Health Status landing page. |
|
Step 3 |
Use the Monitoring navigation pane to access device-specific health monitors. |
You have accessed the health monitor and can view the compiled health status for all managed devices. You can interact with the Health Status landing page and use the Monitoring navigation pane to access device-specific health information.
See Device health monitors for information about the compiled health status and metrics for any device managed by the Cloud-Delivered Firewall Management Center.
The device health monitor provides the compiled health status for any device managed by the Cloud-Delivered Firewall Management Center. The device health monitor collects health metrics for Secure Firewall devices in order to predict and respond to system events.
The device health monitor is comprised of these components:
System Details: Displays information about the managed device, including the installed Secure Firewall version and other deployment details.
Troubleshooting & Links: Provides convenient links to frequently used troubleshooting topics and procedures.
Health alerts: A health alert monitor provides an at-a-glance view of the health of the device.
Time range: An adjustable time window to constrain the information that appears in the various device metrics windows.
Device metrics: An array of key firewall device health metrics categorized across predefined dashboards, including:
CPU: CPU utilization, including the CPU usage by process and by physical cores. The Firewall Threat Defense CPU core allocation dashboard shows core assignments for these categories:
Data Plane: Handles basic network functions, including core packet forwarding and network data processing.
Snort: Manages intrusion detection and deep packet inspection features.
Note |
Multi-threaded Snort processes are allocated across multiple Snort cores to improve device performance. The Snort core allocation shown in the CPU dashboard reflects the total number of Snort process threads assigned to Snort cores. |
System: Includes all other system processes. While some processes may have dedicated CPU cores allocated, their usage is combined and displayed under the System category in the dashboard.
Memory: Device memory utilization, including data plane and Snort memory usage.
Interfaces: Interface status and aggregate traffic statistics.
Connections: Connection statistics (such as elephant flows, active connections, peak connections, and so on) and NAT translation counts.
Snort: Statistics related to the Snort process.
Disk Usage: Device disk usage, including the disk size and disk utilization per partition.
Critical Processes: Statistics related to managed processes, including process restarts and other select health monitors such as CPU and memory utilization.
Note |
During a device upgrade or high-availability failover event, the Firewall Threat Defense device may briefly appear as Offline in the device's health monitoring dashboard. This happens because health alerts are cleared during the process and are only updated after the process is complete. Wait for the upgrade or failover operation to finish. |
For a comprehensive list of the supported device metrics, refer to Cisco Secure Firewall Threat Defense Health Metrics.
Use this task when you need to monitor device health or initiate troubleshooting procedures on specific devices through the management center.
|
Step 1 |
Choose System ( Use the Monitoring navigation pane to access device-specific health monitors. |
|
Step 2 |
In the device list, click Expand( |
|
Step 3 |
Click on a device to view a device-specific health monitor. |
|
Step 4 |
Click the link for View System & Troubleshoot Details … This panel is collapsed by default. Clicking on the link expands the collapsed section to see System Details and Troubleshooting & Links for the device. The system details include:
|
|
Step 5 |
You have these troubleshoot choices:
|
|
Step 1 |
Choose System ( Use the Monitoring navigation pane to access device-specific health monitors. |
||
|
Step 2 |
In the device list, click Expand( |
||
|
Step 3 |
View the Health Alerts for the device in the alert notification at the top of page, directly to the right of the device name. Hover your pointer over the Health Alerts to view the health summary of the device. The popup window shows a truncated summary of the top five health alerts. Click on the popup to open a detailed view of the health alert summary. |
||
|
Step 4 |
Configure the time range from the drop-down in the upper-right corner. The time range can reflect a period as short as the last hour (the default) or as long as two weeks. Select Custom from the drop-down to configure a custom start and end date. Click the refresh icon to set auto refresh to 5 minutes or to toggle off auto refresh. |
||
|
Step 5 |
Click the Show the deployment details on top of the graph ( The icon indicates the number of deployments during the selected time-range. A vertical band indicates the deployment start and end time. In the case of multiple deployments, multiple bands/lines can appear. Click the icon on top of the dotted line to view the deployment details. |
||
|
Step 6 |
View the device monitor reports health and performance metrics in several predefined dashboards by default. The metrics dashboards include:
You can navigate through the various metrics dashboards by clicking on the labels. For a comprehensive list of the supported device metrics, refer to Cisco Secure Firewall Threat Defense Health Metrics. |
||
|
Step 7 |
Click the Add New Dashboard( For more information, refer to Correlating device metrics. |
The device health monitor includes an array of key Firewall Threat Defense device metrics that serve to predict and respond to system events. The health of any Firewall Threat Defense device can be determined by these reported metrics.
The device monitor reports these metrics in several predefined dashboards by default. These dashboards include:
Overview: Highlights key metrics from the other predefined dashboards, including CPU, memory, interfaces, connection statistics; plus disk usage and critical process information.
CPU: CPU utilization, including the CPU usage by process and by physical cores.
Memory: Device memory utilization, including data plane and Snort memory usage.
Interfaces: Interface status and aggregate traffic statistics.
Connections: Connection statistics (such as elephant flows, active connections, peak connections, and so on) and NAT translation counts.
Snort: Statistics related to the Snort process.
ASP Drops: Statistics related to the Accelerated Security Path (ASP) performance and behavior.
You can add custom dashboards to correlate metrics that are interrelated. Select from predefined correlation groups, such as CPU and Snort; or create a custom correlation dashboard by building your own variable set from the available metric groups. For a comprehensive list of the supported device metrics, refer to Cisco Secure Firewall Threat Defense Health Metrics.
To view and correlate the time series data (device metrics) in the health monitor dashboard, enable REST API (System (
)).
Note |
Correlating device metrics is available only for Firewall Threat Defense 6.7 and later versions. Hence, for Firewall Threat Defense versions earlier than 6.7, the health monitor dashboard does not display these metrics even if you enable REST API. |
Follow these steps to correlate device metrics:
|
Step 1 |
Choose System ( Use the Monitoring navigation pane to access device-specific health monitors. |
|
Step 2 |
Click the Add New Dashboard( |
|
Step 3 |
To create a dashboard from a predefined correlation group, click Add from Predefined Correlations drop-down, choose the group, and click Add Dashboard. To create a custom correlation dashboard, choose a group from the Select Metric Group drop-down, then choose corresponding metrics from the Select Metrics drop-down. For a comprehensive list of the supported device metrics, refer to Cisco Secure Firewall Threat Defense Health Metrics. |
|
Step 4 |
Click Add Metrics to add and select metrics from another group, and to remove an individual metric, click the Remove |
|
Step 5 |
You can Edit or Delete the predefined dashboards and the custom correlation dashboards. |
When a Firewall Threat Defense is the control node of a cluster, the Cloud-Delivered Firewall Management Center collects various metrics periodically from the device metric data collector.
The cluster health monitor is comprised of these components:
Overview dashboard: Displays information about the cluster topology, cluster statistics, and metric charts:
The topology section displays a cluster's live status, the health of individual threat defense, threat defense node type (control node or data node), and the status of the device. The status of the device could be Disabled (when the device leaves the cluster), Added out of box (in a public cloud cluster, the additional nodes that do not belong to the Cloud-Delivered Firewall Management Center), or Normal (ideal state of the node).
The cluster statistics section displays current metrics of the cluster with respect to the CPU usage, memory usage, input rate, output rate, active connections, and NAT translations.
Note |
The CPU and memory metrics display the individual average of the data plane and snort usage. |
The metric charts, namely, CPU Usage, Memory Usage, Throughput, and Connections, diagrammatically display the statistics of the cluster over the specified time period.
Load Distribution dashboard: Displays load distribution across the cluster nodes in two widgets:
The Distribution widget displays the average packet and connection distribution over the time range across the cluster nodes. This data depicts how the load is being distributed by the nodes. Using this widget, you can easily identify any abnormalities in the load distribution and rectify it.
The Node Statistics widget displays the node level metrics in table format. It displays metric data on CPU usage, memory usage, input rate, output rate, active connections, and NAT translations across the cluster nodes. This table view enables you to correlate data and easily identify any discrepancies.
Member Performance dashboard: Displays current metrics of the cluster nodes. You can use the selector to filter the nodes and view the details of a specific node. The metric data include CPU usage, memory usage, input rate, output rate, active connections, and NAT translations.
CCL dashboard: Displays, graphically, the cluster control link data namely, the input, and output rate.
Troubleshooting and Links: Provides convenient links to frequently used troubleshooting topics and procedures.
Time range: An adjustable time window to constrain the information that appears in the various cluster metrics dashboards and widgets.
Custom Dashboard: Displays data on both cluster-wide metrics and node-level metrics. However, node selection only applies for the threat defense metrics and not for the entire cluster to which the node belongs.
The cluster health monitor provides a detailed view of the health status of a cluster and its nodes. This cluster health monitor provides health status and trends of the cluster in an array of dashboards.
Ensure you have created a cluster from one or more devices in the Cloud-Delivered Firewall Management Center.
Follow these steps to view the cluster health monitor:
|
Step 1 |
Choose System ( Use the Monitoring navigation pane to access node-specific health monitors. |
|
Step 2 |
In the device list, click Expand( |
|
Step 3 |
Click on the cluster name to view the cluster health statistics. The cluster monitor reports health and performance metrics in several predefined dashboards by default. The metrics dashboards include:
You can navigate through the various metrics dashboards by clicking on the labels. For a comprehensive list of the supported cluster metrics, refer to Cisco Secure Firewall Threat Defense Health Metrics. |
|
Step 4 |
Configure the time range from the drop-down in the upper-right corner. The time range can reflect a period as short as the last hour (the default) or as long as two weeks. Select Custom from the drop-down to configure a custom start and end date. Click the refresh icon to set auto refresh to 5 minutes or to toggle off auto refresh. |
|
Step 5 |
Click on deployment icon for a deployment overlay on the trend graph, with respect to the selected time range. The deployment icon indicates the number of deployments during the selected time-range. A vertical band indicates the deployment start and end time. For multiple deployments, multiple bands/lines appear. Click on the icon on top of the dotted line to view the deployment details. |
|
Step 6 |
View the Health Alerts for the node in the alert notification at the top of page, directly to the right of the device name. Hover your pointer over the Health Alerts to view the health summary of the node. The popup window shows a truncated summary of the top five health alerts. Click on the popup to open a detailed view of the health alert summary. |
|
Step 7 |
View device monitor health and performance metrics in several predefined dashboards. The metrics dashboards include:
You can navigate through the various metrics dashboards by clicking on the labels. Refer to Cisco Secure Firewall Threat Defense Health Metrics for a comprehensive list of the supported device metrics. |
|
Step 8 |
Click the plus sign Add New Dashboard( For cluster-wide dashboard, choose Cluster metric group, and then choose the metric. |
The table summarizes the available health monitor status categories, their severity levels, icons, associated colors in pie charts, and descriptions.
|
Status Level |
Status Icon |
Status Color in Pie Chart |
Description |
|---|---|---|---|
|
Error |
Error ( )
|
Black |
Indicates that at least one health monitoring module has failed on the appliance and has not been successfully re-run since the failure occurred. Contact your technical support representative to obtain an update to the health monitoring module. |
|
Critical |
Critical ( )
|
Red |
Indicates that the critical limits have been exceeded for at least one health module on the appliance and the problem has not been corrected. |
|
Warning |
Warning ( )
|
Yellow |
Indicates that warning limits have been exceeded for at least one health module on the appliance and the problem has not been corrected. This status also indicates a transitionary state, where, the required data is temporarily unavailable or could not be processed because of changes in the device configuration. Depending on the monitoring cycle, this transitionary state is auto-corrected. |
|
Normal |
Normal ( )
|
Green |
Indicates that all health modules on the appliance are running within the limits configured in the health policy applied to the appliance. |
|
Recovered |
Recovered ( )
|
Green |
Indicates that all health modules on the appliance are running within the limits configured in the health policy applied to the appliance, including modules that were in a Critical or Warning state. |
|
Disabled |
Disabled ( )
|
Blue |
Indicates that an appliance is disabled or excluded, that the appliance does not have a health policy applied to it, or that the appliance is currently unreachable. |
Health event views enable you to monitor health events logged by the health monitor in the Cloud-Delivered Firewall Management Center. The views are fully customizable, allowing you to analyze health statuses efficiently and access related event data.
You can search event data to easily access other information that may be related to the events you are investigating. If you understand what conditions each health module tests for, you can more effectively configure alerting for health events.
You can perform many of the standard event view functions on the health event view pages.
Use this task when you need to monitor the health of your appliances and review any incidents or events recorded.
When you access health events from the Health Monitor page on your Cloud-Delivered Firewall Management Center, you retrieve all health events for all managed appliances.
Tip |
You can bookmark this view to allow you to return to the page in the health events workflow containing the Health Events table of events. The bookmarked view retrieves events within the time range you are currently viewing, but you can then modify the time range to update the table with more recent information if needed. |
Follow these steps to view health events:
|
Choose System (
|
The Health Events Table provides actionable insight into system health and allows users to organize, modify, and respond to health events.
|
Step 1 |
Choose System ( |
|
Step 2 |
You have the following choices:
|
The health monitor modules you enable in your health policy run tests to determine appliance health status. When the health status meets specified criteria, a health event is generated. The health event table includes fields that are searchable and viewable for monitoring appliance health.
|
Field |
Description |
|---|---|
|
Module Name |
Specify the name of the module which generated the health events you want to view. For example, to view events that measure CPU performance, type CPU . The search should retrieve applicable CPU Usage and CPU temperature events. |
|
Test Name (Search only) |
The name of the health module that generated the event. |
|
Time (Search only) |
The timestamp for the health event. |
|
Description |
The description of the health module that generated the event. For example, health events generated when a process was unable to execute are labeled Unable to Execute . |
|
Value |
The value (number of units) of the result obtained by the health test that generated the event. For example, if the Cloud-Delivered Firewall Management Center generates a health event whenever a device it is monitoring is using 80 percent or more of its CPU resources, the value could be a number from 80 to 100. |
|
Units |
The units descriptor for the result. You can use the asterisk (*) to create wildcard searches. For example, if the Cloud-Delivered Firewall Management Center generates a health event when a device it is monitoring is using 80 percent or more of its CPU resources, the units descriptor is a percentage sign (%). |
|
Status |
The status (Critical, Yellow, Green, or Disabled) reported for the appliance. |
|
Device |
The appliance where the health event was reported. |
The appliances that are part of the system generate an audit record for each user interaction with the web interface.
Cloud-Delivered Firewall Management Centers log read-only auditing information for user activity. Audit logs appear in a standard event view that allows you to view, sort, and filter audit log messages based on any item in the audit view. You can easily delete audit information, generate reports, and review detailed records of the changes that users make.
The audit log stores a maximum of 100,000 entries. When the number of audit log entries exceeds 100,000, the appliance prunes the oldest records from the database to reduce the number to 100,000.
The audit logs do not display the user or the source IP for login errors:
When wrong password is used, the source IP is not displayed.
When the user account does not exist, both source IP and the user are not displayed.
If the attempt for an LDAP user fails, no audit log is triggered.
This table describes the audit log fields that can be viewed and searched.
|
Field |
Description |
|---|---|
|
Time |
Time and date that the appliance generated the audit record. |
|
User |
User name of the user that triggered the audit event. |
|
Subsystem |
In a few cases where a menu path is not relevant, the Subsystem field displays only the event type. For example, Login classifies user login attempts. |
|
Message |
The action the user performed or the button the user clicked on the page. For example, Changes made to the system appear with a Compare icon that you can click to see a summary of the changes. |
|
Source IP |
IP address associated with the host used by the user. Note: When searching this field you must type a specific IP address; you cannot use IP ranges when searching audit logs. |
|
Domain |
The current domain of the user when the audit event was triggered. This field is only present if you have ever configured the Cloud-Delivered Firewall Management Center for multitenancy. |
|
Configuration Change (search only) |
Specifies whether to view audit records of configuration changes in the search results. ( |
|
Count |
The number of events that match the information that appears in each row. Note that the Count field appears only after you apply a constraint that creates two or more identical rows. This field is not searchable. |
You can customize the layout of the audit events table view or filter events by specific field value.
Use these options to customize the audit events table view:
You can change the layout of the event view, or constrain the events in the view by a field value.
To disable a column, click Close (
) in the desired column heading. Click Apply in the pop-up window. When you disable a column, it is disabled for the duration of your session (unless you add it back
later).
Note |
When you disable the first column, the Count column is added. |
To hide or show other columns, or to add a disabled column back to the view, select or clear the appropriate check boxes before you click Apply.
Clicking a value within a row in a table view constrains the table view and does not drill down to the next page in the workflow.
Tip |
Table views always include "Table View" in the page name. |