About AgenticOps insights
Firewalls are a critical component of any organization's network security architecture. As organizations expand and the threat landscape evolves, managing these firewalls becomes complex. Organizations must continuously update rules and configurations to adapt to new threats, network changes, and compliance requirements, which presents significant challenges. Improper management can lead to security gaps and vulnerabilities. These issues pose risks to an organization's network security.
To effectively address these challenges, a new approach to firewall management is required. This is where AgenticOps becomes essential. AgenticOps leverages artificial intelligence (AI) and machine learning (ML) to streamline and enhance firewall management and network security.
 Note |
Currently, AgenticOps supports:
|
Key functionalities
-
Traffic and capacity monitoring: Monitors network traffic and system capacity in real-time, and detects anomalies such as elephant flows. This ensures resources are optimized for peak performance.
-
Policy anomaly detection: Analyzes firewall policies and detects misconfigurations or anomalies before they impact performance or security.
-
Feature adoption insights and best practice recommendations: Provides insights into the level of feature adoption and suggests best practices to optimize security configurations.
-
Predictive forecasting for network issues: Predicts potential future network issues, allowing you to address them proactively and minimize downtime.
-
Operational insights: Evaluates device readiness for software upgrades, suggests compatible versions, and helps plan upgrades to maintain consistency, stability, and compliance across deployments.
-
Critical alerts: Filters and prioritizes the most urgent security events, helping you focus on critical issues.
Key features
-
Policy Analyzer and Optimizer: Analyzes security policies, detects anomalies, and provides recommendations on remediations that can be performed to optimize the policies, thereby improving the firewall performance.
-
Best Practices and Recommendations: Generates detailed assessment reports that highlight failed checks against Cisco Secure Firewall best practices and provides actionable recommendations to resolve issues, ensuring optimal firewall performance.
-
Feature Adoption: Provides insights into the features that are adopted and the percentage of adoption to modify the usage pattern and achieve optimal security. Analyze the adoption rate of different features to improve usage patterns and enhance security measures.
-
Software Upgrade Planner: Provides upgrade suggestions for your devices through a centralized dashboard. The dashboard displays the current and suggested versions and details about security vulnerabilities and bug fixes.
-
Application Insights: Detects application outages that may impact users, sites, and business-critical services. The feature correlates outage telemetry, operational insights, and affected resources to help you reduce troubleshooting time.
-
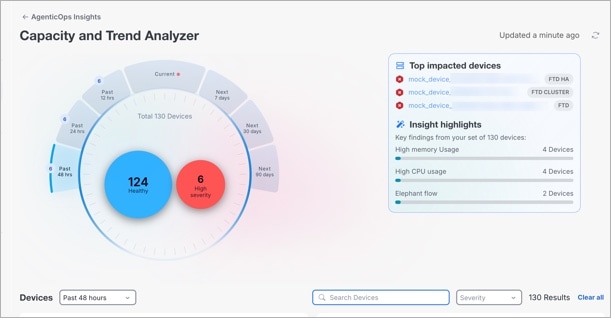
Capacity and Trend Analyzer: Analyzes firewall capacity utilization and traffic trends to identify abnormal spikes, sustained resource consumption, and emerging performance risks. The feature provides operational visibility into throughput, connection behavior, and traffic patterns to optimize firewall performance.
-
Compliance Posture: Assess firewall compliance posture against supported security standards. The feature evaluates firewall configurations, identifies compliance gaps, and provides actionable remediation insights to improve security posture
-
Configuration Settings: Provides the ability to configure thresholds for AgenticOps features and enable or disable insight preferences. You can customize these settings to suit your specific needs.
AgenticOps licensing requirements
If you have licenses for the Secure Firewall Management Center, you can access AgenticOps by enabling AgenticOps Insights in your organization. The initial version of AgenticOps is included as part of your firewall license and is granted on a per-device basis.
Prerequisites to use AgenticOps
-
Ensure that AgenticOps Insights is enabled for your Security Cloud Control organization and that Cloud-Delivered Firewall Management Center is provisioned.
-
You must have Super Admin or Admin user roles to opt in and opt out of AgenticOps Insights for your organization.
-
If you are using an On-Premises Firewall Management Center, ensure it is integrated with Cisco Security Cloud before onboarding AgenticOps.
For information on supported on-prem Firewall Management Center software versions, see AgenticOps Support for On-Premises Firewall Management Center.
-
Configure the required thresholds and preferences for supported AgenticOps features.
View summary dashboard
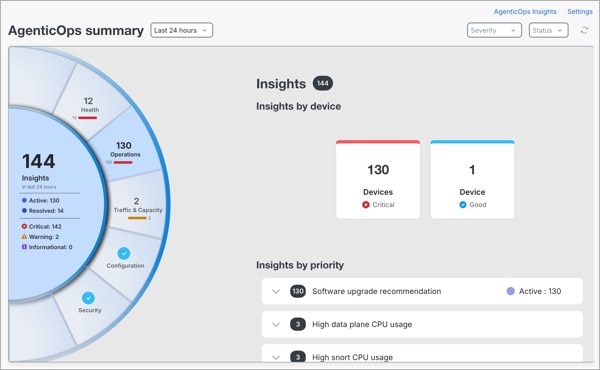
AgenticOps summary dashboard
The Summary dashboard provides a consolidated view of all insights across your environment. It enables identification of areas that require attention and gives you the ability to drill down for operational, configuration, and security analysis. You can filter insights by time range, severity, and status.
-
Insights visualization panel: Visual representation of your insights, helping you quickly understand overall system posture and where to prioritize action.
-
The inner ring summarizes insights by status and severity.
-
The outer ring represents insight categories. Selecting a category displays related details.
The insight categories include:
-
Operations: Focuses on insights that help maintain the operational health and software lifecycle readiness of your devices. This includes upgrade recommendations for your Firewall Threat Defense devices and End-of-Life notifications.
-
Configuration: Focuses on insights that evaluate your network policies, configurations, and adherence to Cisco Firewall best practices. This includes identifying misconfigurations, policy anomalies, and deviations that may impact performance, security, or compliance.
-
Security: Focuses on insights that detect suspicious, risky, or anomalous activities within your environment. These insights highlight behaviors that may indicate compromised accounts and malicious intent.
-
Select any insight category to view the insights associated with it.
-
-
Insights by device: Click on a device to view insights.
-
Insights by priority: Expand the section to view all devices with related insights.
-
Use the icons at the top right of the page for additional actions:
-
AgenticOps Insights: Navigate to the view of all AgenticOps insights.
-
Settings: Navigate to configure preferences and thresholds for insights.
-
Confidence levels in AgenticOps
A confidence level represents the reliability of a forecast-based insight generated by AgenticOps. It indicates how accurately AgenticOps can predict future behavior for a given condition, helping you decide when immediate action is required versus when monitoring is sufficient.
Applicable forecast-based insight types
Confidence levels are displayed for the following forecast-based AgenticOps insights:
-
Remote Access VPN – Maximum Sessions Nearing Limit
-
CPU (LINA) Utilization Forecast Breach
-
CPU (Snort) Utilization Forecast Breach
-
Memory (LINA) Utilization Forecast Breach
-
Memory (Snort) Utilization Forecast Breach
How AgenticOps determines confidence levels ?
For forecast-based insights, such as High Snort Memory Usage, High Snort CPU Usage, and RA VPN Forecast, AgenticOpsevaluates how accurately its machine learning models can predict future behavior using historical patterns and current trends.
Based on this forecast accuracy, each insight is automatically assigned a confidence level. Insights that do not meet a minimum reliability threshold are not generated.
-
High
-
The forecast is highly reliable and strongly supported by historical data.
-
Recommended action: Prioritize the investigation and take proactive corrective measures.
-
-
Medium
-
The forecast is reliable but may show moderate variability.
-
Indicates a strong trend that is likely to continue.
-
Recommended action: Review the insight and plan mitigation.
-
-
Low
-
The forecast indicates a possible emerging condition.
-
Limited data or higher variability reduces certainty.
-
Recommended action: Monitor closely and validate with additional operational context.
-
-
Very low
-
The forecast signal is weak or in an early stage.
-
Higher uncertainty due to insufficient or inconsistent data.
-
Recommended action: Observe trends. No immediate action is required.
-
Insight statuses and transitions
This table outlines the possible insight statuses, their descriptions, transitions, and examples.
|
Status |
Description |
Transition |
Triggered by |
Example |
|---|---|---|---|---|
|
Active |
|
– |
System |
Upgrade options suggested for Firewall Threat Defense devices. |
|
Resolved |
|
Active to Resolved: After you fix the issue and the system confirms it in the next check. |
|
Overlapping firewall rules corrected by the user. |
|
Not Applicable (N/A) |
|
Active to Not Applicable |
System |
|
View AgenticOps insights
The AgenticOps Insights page provides AI-driven alerts that help you detect, prioritize, and resolve issues across your environment.
Procedure
|
Step 1 |
In the left pane, click . |
|
Step 2 |
On the Summary page, click AgenticOps Insights at the top right. Insights are displayed in chronological order and can be filtered by the following:
Clicking Reset all clears all applied filters and returns to the default view. |
|
Step 3 |
In the insights table, click an Insight or Impacted Resource to view additional details. The details include a summary of the issue, the probable cause, related metrics, and recommended remediation or upgrade actions to ensure optimal performance. |
|
Step 4 |
Use the icons at the top right of the page for additional actions: 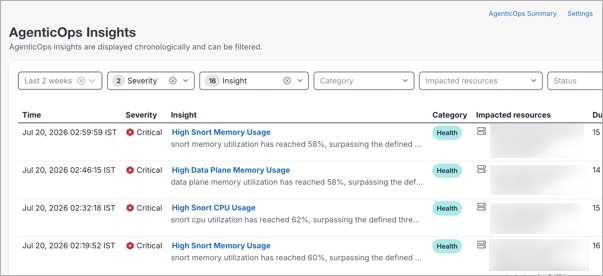
|
AgenticOps for On-Premises Firewall Management Center
AgenticOps supports Firewall Threat Defense devices managed by an On-Premises Firewall Management Center that is integrated with Cisco Security Cloud and onboarded to AgenticOps. Support for individual AgenticOps features depends on the On-Premises Firewall Management Center software version.
Note |
Currently, On-Premises Firewall Management Center registered through Secure Device Connector (SDC) are not supported. |
|
AgenticOps feature |
Supported On-Premises Firewall Management Center versions |
|---|---|
|
Capacity and Trend Analyzer |
10.0.0+ |
|
Policy Analyzer and Optimizer |
7.4.0+ |
|
Software Upgrade Planner |
7.4.0+ |
|
Best Practices and Recommendations |
10.0.0+ |
|
Feature Adoption |
10.0.0+ |
|
Application Insights (ThousandEyes) |
7.6.0+ |
|
User Risks Insights |
10.0.0+ |
After onboarding, supported On-Premises Firewall Management Center- managed devices are available throughout AgenticOps, including the Summary page, AgenticOps Insights, and supported feature dashboards.
 Feedback