
Table Of Contents
Statistics Collection Intervals
Statistics Overview
Statistics collection in Release 11 of CWM is provided by the Statistics Collection Manager (SCM). SCM consists of the following elements:
•
Java graphical user interface (GUI)
•
•
•
This chapter describes the operational features of the SCM.
Overview
The SCM control server communicates with the Java GUI and provides control of the statistics data collection. The SCM collection server performs the data collection from the various network nodes. One SCM control server provides the controls based on user input via the Java GUI.
Multiple collection servers are distributed across a network. Each SCM collection server provides collected statistics to an associated SCM statistics parser that writes the data into the SCM statistics database.
Figure 3-1 shows the SCM system architecture and the basic communication paths for data and control within the SCM.
Figure 3-1 SCM System Architecture

SCM GUI
Use the SCM GUI to control the statistics data collection and monitor the collection status. The SCM GUI, shown in Figure 3-2, is launched from the CWM Desktop along with the other CWM desktop applications.
Figure 3-2 SCM GUI Main Menu Window
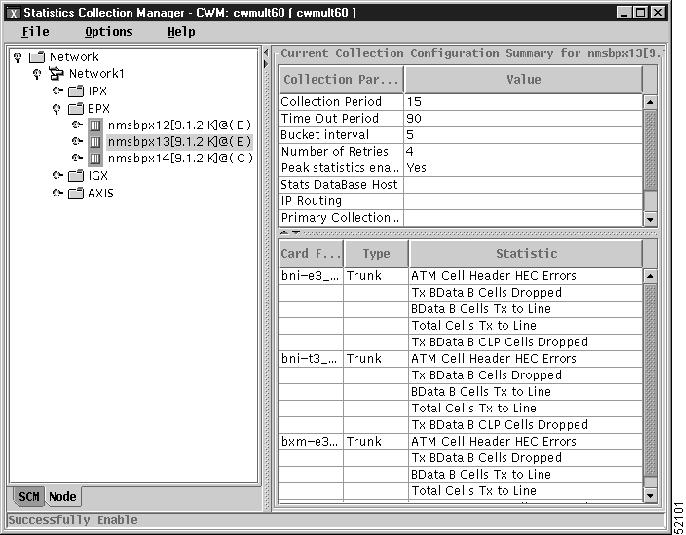
The SCM GUI can function on any workstation capable of running the CWM desktop GUI and connects to the SCM control server in the CWM workstation specified by the desktop. The SCM GUI is generic; it handles statistics collection independent of node hardware. The SCM control server provides a list of statistical data that is applicable for various types of cards and nodes.
SCM Control Server
The SCM control server controls the data collection based on input via the SCM GUI. For example, use the GUI to tell the SCM control server to enable or disable collection of various statistics, and to start or stop statistical data collection.
The SCM control server runs off the CWM workstation and uses the CWM database for storing SCM metadata and the list of enabled statistics for all nodes. The SCM metadata provides the list of enabled statistics for various types of cards and nodes.
The SCM control server does not run in a primary or secondary role like the CWM workstation architecture. The SCM GUI can connect to any SCM control server. The primary or secondary status of the CWM workstation, however, is used during a coldstart to initialize data control. For more information on coldstart, see "Database Management".
SCM Collection Server
The SCM collection server collects data from the nodes. The SCM collection server is distributed to the hosts and receives requests from the SCM control server to start and stop data collection from a node. After an SCM collection server begins collecting data, the collection server is independent of the SCM control server.
An SCM collection server acts as a primary, secondary, or tertiary data collector for a given node. The SCM collection server automatically provides a default primary, secondary, or tertiary SCM collection server when statistics collection is enabled on a node. The secondary and tertiary data collectors are optional, and the collection servers can be changed.
If statistics collection has been enabled and started, the SCM collection server begins operation during the initialization phase of workstation startup. The SCM collection server forwards the files to the SCM statistics database hosts via File Transfer Protocol (FTP).
If the SCM collection server and the SCM statistics parser are on the same CWM workstation, select the no-FTP option. The SCM statistics parser processes the files directly from the incoming directory of the SCM collection server.
SCM Statistics Parser
The SCM statistics parser writes the data collected by the SCM collection server to the CWM statistics database. One statistics parser is associated with each SCM collection server.
If statistics collection has been enabled and started, the SCM statistics parser begins operation during the initialization phase of workstation startup. When the new collection server is started, an SCM statistics parser automatically starts.
CWM issues a get request. The node responds by transmitting the statistics, in bulk, to a statistics collection file.

Note
The following files parse the node files and import the information into the CWM database:
•
•
•
These files are stored in the /usr/users/svplus/bin directory.
The axsmreadbinary and the bxmspvcreadbinary are trap based files that send a message to CWM indicating that the files are ready. The readbinary file is time based.
SCM Statistics Database
The SCM statistics database is a separate relational database from the CWM database used for storing statistics. For most installations, one database is needed, but more than one can be used.
When a new SCM collection server is added via the GUI, the SCM control server updates the SCM statistics database.
SCM Statistics Ager
The SCM statistics ager removes old data from the database and file system.
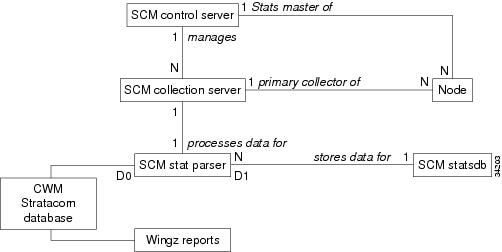
SCM Component Relationship
Figure 3-3 shows the relationships among the SCM components. An SCM control server, which is the statistics master for a given node, manages an SCM collection server which is the primary statistics collector for that node. The SCM collection server works with a statistics parser which processes the data.
Figure 3-3 SCM Component Relationships
Statistics Collection Intervals
Use the following guidelines when configuring the peak interval through CWM:
•
•
•
•
The switch requires processing time to parse the stats.enable file. Depending on the number of statistics and the number of objects, this time can be long. SCM has a finite value (maximum 420 seconds) for time-out to wait for the switch response. SCM might time-out while waiting for the switch to finish parsing the stats.enable file. If excessive time-outs occur, perform one of the following actions:
1.
2.
Use the following formulae to calculate the time to enable statistics on the switch:
time—Calculated using:
time = (stats / cnt) * delay
where:
stats—Calculated using:
(conns * stats_per_con) + (CLNs * stats_per_cln) + (trks * stats_per_trk) + (ports * stats_per_port)
cnt—Number of statistics configured in one group before giving up CPU. This parameter is configurable on the switch.
delay—Delay between enabling of each group of statistics. This parameter is configurable on switch.