SRv6 Network Performance Measurement

This chapter is dedicated to Performance Measurement (PM) in SRv6 networks, a vital capability for monitoring network performance and ensuring Service Level Agreement (SLA) compliance. It explores various PM functionalities, including liveness monitoring for both IP endpoints and SR policies, and detailed delay measurement techniques (one-way, two-way, loopback). The chapter also introduces SRv6 path tracing, explaining how it records actual packet paths, measures per-hop delays, and identifies interface loads, providing comprehensive diagnostic tools for network operators.

Performance measurement

Performance measurement (PM) is a SRv6 feature that

  • monitors network performance metrics such as packet loss, delay, delay variation, and bandwidth utilization

  • provides network operators with information for performance evaluation and Service Level Agreement (SLA) compliance, and

  • applies to links and end-to-end Traffic Engineering (TE) Label Switched Paths (LSPs) in service provider networks.

PM functionalities

This table details the functionalities supported by the PM feature for measuring delay across links or SR policies.

Table 1. Functionalities of SRv6 PM

Functionality

Details

Profiles

You can configure different profiles for different types of delay measurements. Delay profile allows you to schedule probe and configure metric advertisement parameters for delay measurement.

Protocols

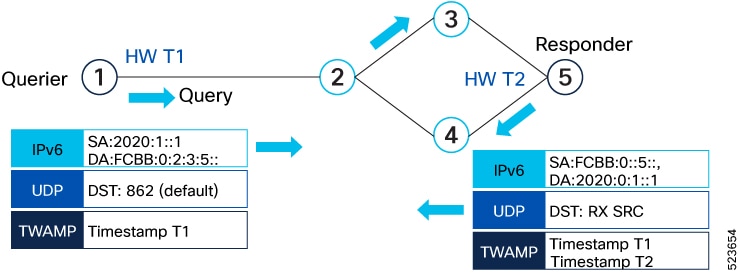
The TWAMP Light from Appendix of RFC 5357 is standardized as Simple TWAMP in RFC 8762. Then it was extended with RFC 8972.

Probe and burst scheduling

Schedule probes and configure metric advertisement parameters for delay measurement.

Metric advertisements

Advertise measured metrics periodically using configured thresholds. Also supports accelerated advertisements using configured thresholds.

Measurement history and counters

Maintain packet delay and loss measurement history and also session counters and packet advertisement counters.

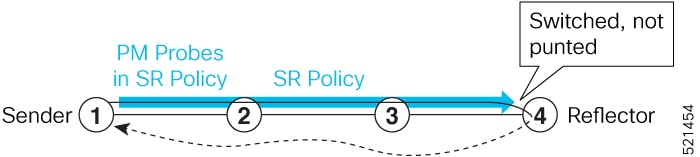
PM probes typically follow the designated Segment Routing Traffic Engineering (SR-TE) path. However, in certain scenarios, the convergence of the PM probes and the SR-TE path may occur at different times. During this convergence period, PM probes may temporarily follow the IGP path and utilize an alternate egress interface until full convergence is achieved.

PM methods

PM is designed to monitor key network metrics, including packet loss, delay, delay variation, and bandwidth utilization. These measurements can be applied to individual links as well as end-to-end Segment Routing Traffic Engineering (SR-TE) Label Switched Paths (LSPs). By using these measurement methods, SRv6 enables comprehensive monitoring and optimization of network performance across various paths and endpoints. These methods are used to assess these metrics:

  • Liveness monitoring: Verifies that a specific path, segment, or node is operational and capable of forwarding packets. This essential check for network availability and reliability supports both IP Endpoint liveness monitoring and SR policy liveness monitoring. For more information, see Liveness monitoring.

    • IP Endpoint liveness monitoring: Ensures that a particular IP endpoint is reachable and operational within the network.

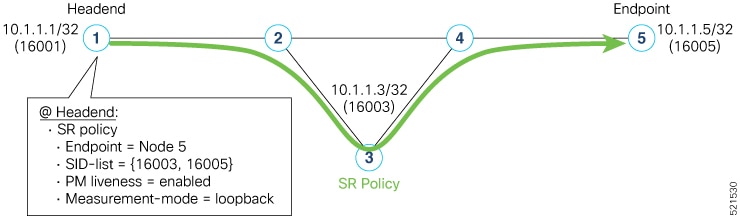
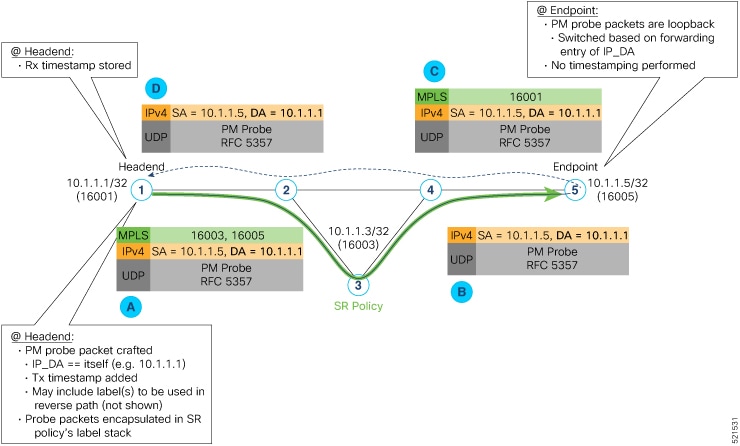
    • SR policy liveness monitoring: Verifies that traffic can be successfully forwarded along an SR policy path.

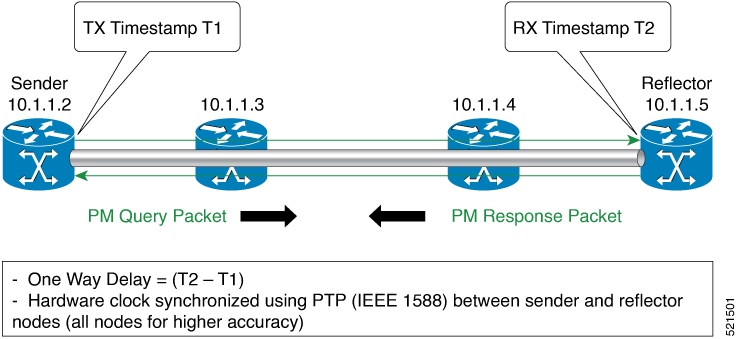
  • Delay measurement: Measures the latency experienced by data packets as they travel through the network. For more information, see Delay measurement.

    • IP Endpoint delay measurement: Tracks the time required for a packet to travel from the source device to a specific IP endpoint.

Liveness monitoring

Liveness is the ability of the network to confirm that a specific path, segment, or node is operational and capable of forwarding packets. It is essential for maintaining network availability and reliability. You can determine liveness for SR Policy and IP Endpoint.

Benefits of liveness monitoring

  • Fault detection: You can quickly identify if a device is down, which allows for immediate response and troubleshooting.

  • Load balancing: You can identify which network devices are live, so work can be distributed more evenly across the network. This prevents overloading of specific components and improves overall performance.

  • System health: You can provide an ongoing snapshot of a system's health, helping to identify potential issues before they become significant problems.

  • Maintenance planning: Liveness information also helps with maintenance planning, as system administrators can understand which components are operational or offline. They can then plan maintenance and downtime to minimize service disruption.

  • Security: Regular liveness checks help maintain network security. Administrators can take proactive steps to mitigate damage and prevent future incidents by identifying unusual activity that might indicate a security breach or attack.

IP endpoint liveness monitoring

IP endpoint liveness is a network monitoring method that

  • dynamically measures and verifies the availability of a device identified by an IP address

  • sends probes or requests to the endpoint's IP address and awaits responses, and

  • determines the endpoint's status based on receiving a response within a specified timeframe.

Table 2. Feature History Table

Feature Name

Release Information

Feature Description

Liveness Monitoring for IP Endpoint over SRv6 Network

Release 25.1.1

Introduced in this release on: Fixed Systems (8010 [ASIC: A100])

This feature is now supported on:

  • 8011-4G24Y4H-I

Liveness Monitoring for IP Endpoint over SRv6 Network

Release 24.4.1

Introduced in this release on: Fixed Systems (8200 [ASIC: P100], 8700 [ASIC: P100])(select variants only*); Modular Systems (8800 [LC ASIC: P100])(select variants only*)

In Segment Routing over an IPv6 network (SRv6), you can keep track of the operational status of both the forward and reverse paths of a particular node or IP endpoint.

*This feature is supported on:

  • 8212-48FH-M

  • 8711-32FH-M

  • 88-LC1-36EH

  • 88-LC1-12TH24FH-E

  • 88-LC1-52Y8H-EM

Liveness Monitoring for IP Endpoint over SRv6 Network

Release 24.2.11

In Segment Routing over an IPv6 network (SRv6), you can keep track of the operational status of both the forward and reverse paths of a particular node or IP endpoint. You can use this information for troubleshooting, network maintenance, and optimizing network performance.

Additionally, you can use flow labels to verify the liveness of each subsequent hop path toward the IP endpoint of that path. So that, when network traffic is distributed across multiple available paths towards an IP endpoint, liveness detection tracks the operational status of each of these paths towards the IP endpoint.

The feature introduces these changes:

CLI:

YANG Data Model:

  • Cisco-IOS-XR-um-performance-measurement-cfg

  • Cisco-IOS-XR-perf-meas-oper.yang

(see GitHub, YANG Data Models Navigator)

Key concepts of IP endpoint liveness

  • IP endpoint: An IP endpoint is any device in the network identified by an IPv4 or IPv6 address. The endpoint of a probe is defined by this IP address. This IP address can be any address that the sender can reach, such as a local interface or a remote node or host, either within an operator's network or accessible via a VRF. The endpoint's IP address can be located in the global routing table or under a user-specified VRF routing table. You can use the performance-measurement endpoint command to configure a probe endpoint source and destination addresses on a sender node. When the endpoint is reachable using SRv6, the forwarding stage imposes the SRv6 encapsulation.

  • Probe: The probe is the request sent to verify liveness and the probe can be of various packet types, such as Ithat the endpoint responds to. The probe could be an ICMP echo request (Ping), a TCP packet, a UDP packet, or any other type of packet that the endpoint would respond to. \

    • If a response is received, the endpoint is considered live.

    • If no response is received within a certain time frame, the endpoint is considered down or unreachable.

  • VRF: You can define the endpoint point IP address belonging to a specific VRF.

    Use the performance-measurement endpoint {ipv4 | ipv6} ip_addr [vrf WORD] command to configure an endpoint to define the VRF. IP Endpoint segment list configuration is not supported under nondefault VRF.

    • VRF-awareness allows operators to deploy probes in these scenarios:

      • Managed Customer Equipment (CE) scenarios:

        • PE to CE probes

        • CE to CE probes

      • Unmanaged Customer Equipment (CE) scenarios:

        • PE to PE probes

        • PE to PE (source from PE-CE interface) probes

  • Source address: You can define the source of the endpoint using the endpoint specific source address and the global source address.

    Global source address configuration is applied to all the endpoints when the endpoint specific source address configuration isn’t specified. endpoint specific configuration overrides all the global source address configuration for those specific endpoints for which source addresses are configured.

    For Micro-SID configuration for IPv4 endpoint sessions, if IPv6 global source address is configured, then it applies the configured global IPv6 source address for the IPv6 header in the SRv6 packet. If IPv6 global address is not configured, then It does not form a valid SRv6 packet.

    You can use the source-address keyword under the performance-measurement command to define the global source address or use the keyword under performance-measurement endpoint to define endpoint specific source address.

  • Reverse path: To detect the liveness of the reverse of the segment, starting from Release 24.2.11 you can configure the reverse path using the reverse-path command.

    The default reverse path configured under the endpoint submode is only used for sessions with segment list. The endpoint session without a segment list does not support reverse path configuration and will not use this reverse path.

    The reverse-path under the performance-measurement endpoint is used as the default reverse path if there are no reverse paths configured under the segment list.

    Use the reverse-path under the performance-measurement endpoint segment-routing traffic-eng explicit segment-list name to configure the reverse path under segment list.

    The reverse type must be the same as the forward path. Using different types for forward and reverse paths is not supported. For example, uSID forward path and uSID reverse path; MPLS forward path and MPLS reverse path.

    User-configured segment-list can also represent the reverse path (reflector to sender) when probe is configured in liveness detection mode. Up to 128 segment-lists can be configured under a probe. An additional PM session is created for each segment-list. Segment-lists are configured under segment-routing traffic-eng segment-list submode.

  • Flow label: The flow label field in the IPv6 header is used to carry information that helps distribute traffic across multiple network paths. The flow label is a 20-bit field in the IPv6 header designed to carry information about the flow of packets, which routers can use to identify and differentiate between different traffic flows. Flow label sweeping uses a flow label to distribute the traffic load across multiple paths to the endpoint. Starting from Release 24.2.11, you can use the flow-label keyword to configure flow label.

Usage guidelines for IP endpoint liveness monitoring

  • Liveness session without segment list for an endpoint in a non-default VRF is not supported.

  • IP Endpoint segment list configuration is not supported under nondefault VRF.

  • SR PM endpoint session over BVI interface is not supported.

  • SRv6 locator prefix and VRF SRv6 locator/function (uDT4/uDT6) as IPv6 endpoint of a probe is not supported.

  • IPv6 Endpoint liveness in default VRF is not supported over SRv6.

Supported and unsupported features for liveness monitoring for IP Endpoint over SRv6 Network

Table 3. Supported and unsupported features for liveness monitoring for IP Endpoint over SRv6 Network

Supported Features

Unsupported Features

SRv6 Endpoint liveness in default VRF

Example:

endpoint ipv6 fccc:2:: liveness-detection

In this example, the endpoint with the IPv6 address fccc:2:: is the SRv6 uSID format.

IPv6 Endpoint liveness in default VRF (over SRv6)

Example:

endpoint ipv6 10::2 liveness-detection

In this example, the endpoint with the IPv6 address 2::2 is part of an underlay network using SRv6.

IPv6 Endpoint liveness in VRF (static uDT6)

Example:

endpoint ipv6 fccc:2:fe02:: liveness-detection

In this example, the endpoint with the IPv6 address fccc:2:fe02:: is the static uDT6 uSID carrier

IPv6 Endpoint liveness in VRF (dynamic DT6 encap)

Example:

endpoint ipv6 10::1 vrf purple source-address ipv6 10::2 liveness-detection

IPv4 Endpoint Liveness in VRF or GRT (static uDT4)

Example:

endpoint ipv4 10.5.56.1 source-address ipv4 10.1.17.1 segment-routing traffic-eng explicit segment-list name vrf-2-3-5-udt4 liveness-detection

The segment-list vrf-2-3-5-udt4 here has static uDT4 SID.

IPv4 Endpoint Liveness in VRF or GRT (dynamic uDT4 encap

Example:

endpoint ipv4 10.0.0.1 vrf purple source-address ipv4 10.0.0.2 liveness-detection

IPv6 address over SRV6 underlay

Example:

endpoint ipv6 10::1 source-address ipv6 10::2 liveness-detection

How IP endpoint liveness detection works

IP endpoint liveness detection leverages the loopback measurement mode to determine if an IP endpoint is active within an SRv6 network.

Summary

The key components involved in this process are the querier, the responder, and the SRv6 transport network. The process describes how the querier initiates and monitors PM TWAMP probe packets to determine the session's status.

Workflow

Figure 1. IP Endpoint Liveness In an SRv6 Network

These stages describe the sequence of events:

  1. Probe creation and transmission: The querier creates and transmits the PM TWAMP probe packets based on the endpoint configuration.
  2. Packet formation: The system forms the packet to reach the responder and return to the querier node over the SRv6 transport network.
  3. Session up declaration: The querier node declares the session active once it receives the probe packet back
  4. Session down declaration: If the sender node does not receive the specified number of consecutive probe packets, based on the configured multiplier, it declares the PM session inactive.

Configure IP Endpoint liveness

Procedure

Step 1

Configure basic IP endpoint liveness with a source address, endpoint, and a multiplier for liveness detection.

Example:

Router(config)#performance-measurement
Router(config-perf-meas)#source-address ipv6 2020:1::1
Router(config-perf-meas)#endpoint ipv6 FCBB:0::5::
Router(config-pm-ep)#exit             
Router(config-perf-meas)#liveness-profile endpoint default
Router(config-pm-ld-ep)#probe
Router(config-pm-ld-ep-probe)#exit
Router(config-pm-ld-ep)#liveness-detection  
Router(config-pm-ld-ep-ld)#multiplier 3
Router(config-pm-ld-ep-ld)#

This example shows how to configure liveness with segment list and reverse path.

Router(config-sr)#traffic-eng
Router(config-sr-te)#segment-lists
Router(config-sr-te-segment-lists)#srv6
Router(config-sr-te-sl-global-srv6)#sid-format usid-f3216
Router(config-sr-te-sl-global-srv6)#exit
Router(config-sr-te-sl-global)#segment-list test
Router(config-sr-te-sl)#srv6
Router(config-sr-te-sl-srv6)#index 10 sid ff::2
Router(config-sr-te-sl-srv6)#index 20 sid ff::3

This example shows how to configure liveness reverse path under segment list and under endpoint:

Router(config)#performance-measurement
Router(config-perf-meas)#endpoint ipv6 ff::2

/* Configure reverse path under segment list name *\
Router(config-pm-ep)#segment-routing traffic-eng explicit segment-list name fwd-path
Router(config-pm-ep-sl)#reverse-path segment-list name rev-path
Router(config-pm-ep-sl)#exit

/* Configure reverse path under performance measurement endpoint *\
Router(config-pm-ep)# segment-routing traffic-eng explicit reverse-path segment-list name rev-path-name

This example shows how to configure liveness with flow label:

Router(config-perf-meas)#liveness-profile endpoint default
Router(config-pm-ld-ep)#probe 
Router(config-pm-ld-ep-probe)#flow-label from 1000 to 20000 increment 16
Router(config-pm-ld-ep-probe)#liveness-detection 
Router(config-pm-ld-ep-ld)#multiplier 3

This example shows how to configure liveness with flow label sweeping:

Router#configure 
Router(config)#performance-measurement 
Router(config-perf-meas)#liveness-profile name profile-sweeping
Router(config-pm-ld-profile)# flow-label from 1000 to 20000 increment 16
Routerconfig-pm-ld-profile)#commit

Step 2

Use the show performance-measurement endpoint detail to verify the IP endpoint liveness configuration.

Example:
Router# show performance-measurement endpoint detail
Endpoint name: IPv6-FCBB:0::5:::-vrf-default
  Source address              : 2020:1::1
  VRF name                    : default
  Liveness Detection          : Enabled
  Profile Keys:
    Profile name              : default
    Profile type              : Endpoint Liveness Detection
  Segment-list                : None
  Liveness Detection session:
    Session ID                : 4109
    Flow-label                : 1000
    Session State: Up
    Last State Change Timestamp: Jan 23 2024 16:06:01.214
    Missed count: 0

  Liveness Detection session:
    Session ID                : 4110
    Flow-label                : 2000
    Session State: Up
    Last State Change Timestamp: Jan 23 2024 16:06:01.214
    Missed count: 0

  Segment-list                : test-dm-two-carrier-sl2
    FCBB:0::5:2:e004::/64
      Format: f3216
    FCBB:0::5:3:e000::/64
      Format: f3216
    FCBB:0::5:2:e004::/64
      Format: f3216
    FCBB:0::5:2:e000::/64
      Format: f3216
    FCBB:0::5:1:e000::/64
      Format: f3216
    FCBB:0::5:1:e004::/64
      Format: f3216
    FCBB:0::5:4:e000::/64
      Format: f3216
    FCBB:0::5:4::/48
      Format: f3216
  Liveness Detection session:
    Session ID                : 4111
    Flow-label                : 1000
    Session State: Up
    Last State Change Timestamp: Jan 23 2024 16:06:01.217
    Missed count: 0

  Liveness Detection session:
    Session ID                : 4112
    Flow-label                : 2000
    Session State: Up
    Last State Change Timestamp: Jan 23 2024 16:06:01.217
    Missed count: 0 

SR policy liveness monitoring

SR policy liveness monitoring is a mechanism that

  • verifies end-to-end traffic forwarding over an SRv6 policy candidate path

  • periodically sends probe messages from the head-end router to the SRv6 Policy's endpoint router, and

  • receives these probe messages back from the endpoint router without control-plane dependency.

Table 4. Feature History Table

Feature Name

Release Information

Feature Description

SR Policy Liveness Monitoring on Segment Routing over IPv6 (SRv6)

Release 25.1.1

Introduced in this release on: Fixed Systems (8700 [ASIC: K100])(select variants only*)

*This feature is supported on Cisco 8712-MOD-M routers.

SR Policy Liveness Monitoring on Segment Routing over IPv6 (SRv6)

Release 24.4.1

Introduced in this release on: Fixed Systems (8200 [ASIC: P100], 8700 [ASIC: P100])(select variants only*); Modular Systems (8800 [LC ASIC: P100])(select variants only*)

*This feature is supported on:

  • 8212-48FH-M

  • 8711-32FH-M

  • 88-LC1-36EH

  • 88-LC1-12TH24FH-E

  • 88-LC1-52Y8H-EM

SR Policy Liveness Monitoring on Segment Routing over IPv6 (SRv6)

Release 7.11.1

In segment routing over IPv6 (SRv6), you can now verify end-to-end traffic forwarding over an SR policy candidate path by periodically sending probe messages. Performance monitoring on an SRv6 network enables you to track and monitor traffic flows at a granular level.

Earlier releases supported SR policy liveness monitoring over an SR policy candidate path on MPLS.

Restrictions for SR policy liveness monitoring

  • Liveness-detection and delay-measurement aren't supported together.

  • When liveness-profile isn't configured, SR Policies use the default values for the liveness-detection profile parameters.

How SRv6 policy liveness detection works

This process describes the workflow for liveness detection over an SRv6 Policy. Consider an SRv6 policy programmed at a head-end node router (for example, Router 1) towards an endpoint node (example, Router 5). This SRv6 policy is enabled for liveness detection using the loopback measurement-mode.

Summary

SRv6 policy liveness detection involves a head-end node sending PM probe packets through the network to an endpoint node. The endpoint node processes these packets and sends them back to the head-end. The head-end node then uses the received packets to determine the operational status of the SRv6 policy's candidate path.

Workflow

These stages describe how SRv6 policy liveness detection works:

  1. The head-end node creates and transmits the PM probe packets.
    • The IP destination address (DA) on the probe packets is set to the loopback value of the head-end node itself.
    • A transmit (Tx) timestamp is added to the payload.
    • Optionally, the head-end node may also insert extra encapsulation (labels) to enforce the reverse path at the endpoint node.
    • Finally, the packet is injected into the dataplane using the same encapsulation (label stack) of that of the SR policy being monitored.
  2. The network delivers the PM probe packets as it would user packet for the SR policy.
  3. The end-point node receives the PM probe packets.
    • Packets are switched back based on the forwarding entry associated with the IP DA of the packet. This would typically translate to the endpoint node pushing the prefix SID label associated with the head-end node.
    • If the head-end node inserted label(s) for the reverse path, then the packets are switched back at the endpoint node based on the forwarding entry associated with the top-most reverse path label.
  4. Head-end node receives the PM probe packets.
    • A received (Rx) timestamp is stored.
    • If the head-end node receives the PM probe packets, the head-end node assume that the SR policy active candidate path is up and working.
    • If the head-end node doesn't receive the specified number of consecutive probe packets (based on configured multiplier), the head-end node assumes the candidate path is down and a configured action is triggered.

Configure SR Policy Liveness Monitoring

Configuring SR Policy liveness monitoring involves configuring a performance measurement liveness profile to customize generic probe parameters and enabling liveness monitoring under SR Policy by associating a liveness profile, and customizing SR policy-specific probe parameters.

Procedure

Configure a performance measurement liveness profile to customize generic probe parameters and enable liveness monitoring under SR policy by associating a liveness profile, and customize SR policy-specific probe parameters.

  • Configure a default SR-policy PM liveness-profile

    Router(config)# performance-measurement
    Router(config-perf-meas)# liveness-profile sr-policy default
    Router(config-pm-ld-srpolicy)# probe
    Router(config-pm-ld-srpolicy-probe)# tx-interval 150000
    Router(config-pm-ld-srpolicy-probe)# tos dscp 52
    Router(config-pm-ld-srpolicy-probe)# exit
    Router(config-pm-ld-srpolicy)# liveness-detection
    Router(config-pm-ld-srpolicy-ld)# multiplier 5
    
    
  • Configure a named (Non-Default) SR-policy PM liveness-profile

    Router(config)# performance-measurement 
    Router(config-perf-meas)# liveness-profile name sample-profile
    Router(config-pm-ld-profile)# probe
    Router(config-pm-ld-probe)# tx-interval 150000
    Router(config-pm-ld-probe)# tos dscp 52
    Router(config-pm-ld-probe)# exit
    Router(config-pm-ld-profile)# liveness-detection 
    Router(config-pm-ld-profile-ld)# multiplier 5
    Router(config-pm-ld-profile-ld)#commit
    
    
  • Configure a SR-policy PM liveness-Profile with sweep parameters

    Router(config)# performance-measurement 
    Router(config-perf-meas)# liveness-profile name sample-profile
    Router(config-pm-ld-profile)# probe
    Router(config-pm-ld-probe)# tx-interval 150000
    Router(config-pm-ld-probe)# tos dscp 52
    Router(config-pm-ld-probe)# sweep 
    Router(config-pm-ld-probe-sweep)# destination ipv4 127.0.0.1 range 25
    Router(config-pm-ld-probe-sweep)# exit
    Router(config-pm-ld-probe)# exit
    
    Router(config-pm-ld-profile)# liveness-detection
    Router(config-pm-ld-profile-ld)# multiplier 5
    Router(config-pm-ld-profile-ld)#commit
    
  • Enable liveness monitoring under SR policy

    The following example shows how to enable liveness monitoring under SR Policy, associate a liveness-profile, and configure the invalidation action:

    Router(config)# segment-routing traffic-eng
    Router(config-sr-te)# policy FOO
    Router(config-sr-te-policy)# performance-measurement
    Router(config-sr-te-policy-perf-meas)# liveness-detection
    Router(config-sr-te-policy-live-detect)# liveness-profile name sample-profile
    Router(config-sr-te-policy-live-detect)# invalidation-action none
    
  • Enable liveness monitoring under SR policy with optional parameters

    The following example shows how to enable liveness monitoring under SR Policy, associate a liveness-profile, and configure reverse path label and session logging:

    Router(config)# segment-routing traffic-eng
    Router(config-sr-te)# policy BAA
    Router(config-sr-te-policy)# performance-measurement
    Router(config-sr-te-policy-perf-meas)# liveness-detection
    Router(config-sr-te-policy-live-detect)# liveness-profile name sample-profile
    Router(config-sr-te-policy-live-detect)# invalidation-action down
    Router(config-sr-te-policy-live-detect)# logging session-state-change
    Router(config-sr-te-policy-live-detect)# exit
    Router(config-sr-te-policy-perf-meas)# reverse-path label 16001
    

Segment lists to activate candidate paths for PM Liveness

A minimum active segment lists is an SRv6 PM liveness feature that

  • allows configuring the number of active segment lists required for a candidate path to be considered operational

  • enables the head-end router to determine a candidate path's up status based on this configured minimum, and

  • identifies a candidate path as up only when all segment lists are active if the configured minimum exceeds the total available segment lists in that path.

Table 5. Feature History Table

Feature Name

Release Information

Feature Description

Configure Segment Lists to Activate Candidate Paths in SRv6 for PM Liveness

Release 25.1.1

Introduced in this release on: Fixed Systems (8700 [ASIC: K100])(select variants only*)

*This feature is supported on Cisco 8712-MOD-M routers.

Configure Segment Lists to Activate Candidate Paths in SRv6 for PM Liveness

Release 24.1.1

Introduced in this release on: Fixed Systems (8200 [ASIC: P100], 8700 [ASIC: P100])(select variants only*); Modular Systems (8800 [LC ASIC: P100])(select variants only*)

*This feature is supported on:

  • 8212-48FH-M

  • 8711-32FH-M

  • 88-LC1-36EH

  • 88-LC1-12TH24FH-E

  • 88-LC1-52Y8H-EM

Configure Segment Lists to Activate Candidate Paths in SRv6 for PM Liveness

Release 7.11.1

You can now enable a candidate path to be up by configuring the minimum number of active segment lists associated with the candidate path. The head-end router determines that a candidate path is up based on the minimum number of active segment lists configured.

In earlier releases, the head-end router identified a candidate path as up only when all the segment lists associated with the path were active.

The feature introduces these changes:

CLI:

YANG Data Models:

  • Cisco-IOS-XR-infra-xtc-agent-cfg.yang

See (GitHub, Yang Data Models Navigator)

Configure the minimum number of segment lists in SRv6

Use this task to configure the minimum number of active segment lists required for a candidate path to be considered up within an SRv6 policy.

By default, the head-end router identifies a candidate path as operational only when all associated segment lists are active. This feature allows you to define a specific, lower threshold for the number of active segment lists.


Note


If the configured minimum number of active segment lists is greater than the number of available segment lists in a candidate path, the head-end router determines the candidate path as up only when all the segment lists are active.


Procedure


Step 1

Activate three segment lists to have the PM liveness session up.

Example:

Router(config)#segment-routing 
Router(config-sr)#traffic-eng 
Router(config-sr-te)#policy po-103
Router(config-sr-te-policy)#performance-measurement 
Router(config-sr-te-policy-perf-meas)#liveness-detection
Router(config-sr-te-policy-live-detect)#validation-cp minimum-active segment-lists 3

Step 2

Verify the running configuration after applying the minimum active segment list settings.

Example:

segment-routing
 traffic-eng
  policy po-103
   performance-measurement
    liveness-detection
     validation-cp minimum-active segment-lists 3
    !
   !
  !
 !
!

Step 3

Verify the configuration by displaying the detailed liveness information for the SR policy.

Example:

Router#show performance-measurement sr-policy liveness color 103 detail verbose private 
Mon Oct 30 15:10:51.863 EDT
 
----------------------------------------------------------------------------------------------------------------------------------------------------------------
0/1/CPU0
----------------------------------------------------------------------------------------------------------------------------------------------------------------

SR Policy name: srte_c_103_ep_3::1
  Color                       : 103
  SRv6 Encap Source Address   : 1::1
  Endpoint                    : 3::1
  Handle                      : 0x00000000
  Policy to be deleted        : False
  Number of candidate-paths   : 1

  Candidate-Path:
    Instance                  : 5
    Preference                : 300
    Protocol-origin           : Configured
    Discriminator             : 300
    Profile Keys:
      Profile name            : default
      Profile type            : SR Policy Liveness Detection
    Candidate path to be deleted: False
    Source address            : 1::1
    Local label               : Not set
    Fast notification for session down: Disabled
      No fast notifications have been sent
    Number of segment-lists   : 3
    Liveness Detection: Enabled
      Minimum SL Up Required: 1
      Session State: Up
      Last State Change Timestamp: Oct 30 2023 15:10:16.322
      Missed count: 0

    Segment-List              : sl-1041
      fccc:cc00:1:fe10:: (Local Adjacency SID)
      fccc:cc00:2:fe41::/64
        Format: f3216
      Segment List ID: 0
      Reverse path segment-List: Not configured
      Segment-list to be deleted: False
      Number of atomic paths  : 1
      Liveness Detection: Enabled
        Session State: Up
        Last State Change Timestamp: Oct 30 2023 15:10:16.322
        Missed count: 0

      Atomic path:
        Flow Label            : 0
        Session ID            : 4198
        Trace ID              : 738913600
        Atomic path to be deleted: False
        NPU Offloaded session : False
        Timestamping Enabled  : True
        Liveness Detection: Enabled
          Session State: Up
          Last State Change Timestamp: Oct 30 2023 15:10:16.322
          Missed count: 0
        Responder IP          : 1::1
        Number of Hops        : 3

    Segment-List              : sl-1042
      fccc:cc00:1:fe10:: (Local Adjacency SID)
      fccc:cc00:2:fe42::/64
        Format: f3216
      Segment List ID: 0
      Reverse path segment-List: Not configured
      Segment-list to be deleted: False
      Number of atomic paths  : 1
      Liveness Detection: Enabled
        Session State: Up
        Last State Change Timestamp: Oct 30 2023 15:10:16.322
        Missed count: 0

      Atomic path:
        Flow Label            : 0
        Session ID            : 4199
        Trace ID              : 954039677
        Atomic path to be deleted: False
        NPU Offloaded session : False
        Timestamping Enabled  : True
        Liveness Detection: Enabled
          Session State: Up
          Last State Change Timestamp: Oct 30 2023 15:10:16.322
          Missed count: 0
        Responder IP          : 1::1
        Number of Hops        : 3

    Segment-List              : sl-1043
      fccc:cc00:1:fe10:: (Local Adjacency SID)
      fccc:cc00:2:fe43::/64
        Format: f3216
      Segment List ID: 0
      Reverse path segment-List: Not configured
      Segment-list to be deleted: False
      Number of atomic paths  : 1
      Liveness Detection: Enabled
        Session State: Up
        Last State Change Timestamp: Oct 30 2023 15:10:16.322
        Missed count: 0

      Atomic path:
        Flow Label            : 0
        Session ID            : 4200
        Trace ID              : 1119107116
        Atomic path to be deleted: False
        NPU Offloaded session : False
        Timestamping Enabled  : True
        Liveness Detection: Enabled
          Session State: Up
          Last State Change Timestamp: Oct 30 2023 15:10:16.322
          Missed count: 0
        Responder IP          : 1::1
        Number of Hops        : 3

----------------------------------------------------------------------------------------------------------------------------------------------------------------
0/RSP0/CPU0
---------------------------------------------------------------------------------------------------------------------------------------------------------------- 

Flow labels in SRv6 Header for PM liveness

Flow labels in SRv6 header for PM liveness is a SRv6 mechanism that utilizes 20-bit fields within the SRv6 header that

  • monitors the activeness of multiple paths for a given segment list

  • identifies different Equal-Cost Multi-Path (ECMP) paths, and

  • is used exclusively with IPv6 probe packets.

Table 6. Feature History Table

Feature Name

Release Information

Feature Description

Configure Flow Labels in SRv6 Header for PM Liveness

Release 25.1.1

Introduced in this release on: Fixed Systems (8700 [ASIC: K100])(select variants only*)

*This feature is supported on Cisco 8712-MOD-M routers.

Configure Flow Labels in SRv6 Header for PM Liveness

Release 24.1.1

Introduced in this release on: Fixed Systems (8200 [ASIC: P100], 8700 [ASIC: P100])(select variants only*); Modular Systems (8800 [LC ASIC: P100])(select variants only*)

*This feature is supported on:

  • 8212-48FH-M

  • 8711-32FH-M

  • 88-LC1-36EH

  • 88-LC1-12TH24FH-E

  • 88-LC1-52Y8H-EM

Configure Flow Labels in SRv6 Header for PM Liveness

Release 7.11.1

You can now monitor the activeness of multiple paths for a given segment list using flow labels in the SRv6 header.

In earlier releases, the SRv6 header didn't include flow labels.

The feature introduces these changes:

CLI:

YANG Data Models:

  • Cisco-IOS-XR-um-performance-measurement-cfg.yang

  • Cisco-IOS-XR-perf-meas-oper.yang

See (GitHub, Yang Data Models Navigator)

Configure flow labels in the SRv6 header

Use this task to configure flow labels in the SRv6 header. This enables you to monitor the activeness of multiple paths for a given segment list.

Procedure


Step 1

Configure flow labels in the SRv6 header in the global configuration mode.

Example:

Router#configure 
Router(config)#performance-measurement 
Router(config-perf-meas)#liveness-profile name name1
Router(config-pm-ld-profile)#probe flow-label from 0 to 1000000 increment 10

Step 2

Use the show running configuration to verify the flow label configuration.

Example:

performance-measurement
 liveness-profile name name1
  probe
   flow-label from 0 to 1000000 increment 10
  !
 !
!

Step 3

Verify the SRv6 header flow label configuration by displaying the detailed liveness information for an SR policy.

Example:

Router#show performance-measurement sr-policy liveness color 1001 detail verbose private 
 
Mon Oct 30 15:25:55.241 EDT

----------------------------------------------------------------------------------------------------------------------------------------------------------------
0/1/CPU0
----------------------------------------------------------------------------------------------------------------------------------------------------------------

SR Policy name: srte_c_1001_ep_3::1
  Color                       : 1001
  SRv6 Encap Source Address   : 1::1
  Endpoint                    : 3::1
  Handle                      : 0x00000000
  Policy to be deleted        : False
  Number of candidate-paths   : 1

  Candidate-Path:
    Instance                  : 3
    Preference                : 300
    Protocol-origin           : Configured
    Discriminator             : 300
    Profile Keys:
      Profile name            : profile-scale
      Profile type            : Generic Liveness Detection
    Candidate path to be deleted: False
    Source address            : 1::1
    Local label               : Not set
    Fast notification for session down: Disabled
      No fast notifications have been sent
    Number of segment-lists   : 2
    Liveness Detection: Enabled
      Minumum SL Up Required: 2
      Session State: Up
      Last State Change Timestamp: Oct 26 2023 15:31:43.478
      Missed count: 0

    Segment-List              : sl-1041
      fccc:cc00:1:fe10:: (Local Adjacency SID)
      fccc:cc00:2:fe41::/64
        Format: f3216
      Segment List ID: 0
      Reverse path segment-List: Not configured
      Segment-list to be deleted: False
      Number of atomic paths  : 2
      Liveness Detection: Enabled
        Session State: Up
        Last State Change Timestamp: Oct 26 2023 15:31:43.478
        Missed count: 0

      Atomic path:
        Flow Label            : 0
        Session ID            : 4178
        Trace ID              : 280178832
        Atomic path to be deleted: False
        NPU Offloaded session : False
        Timestamping Enabled  : True
        Liveness Detection: Enabled
          Session State: Up
          Last State Change Timestamp: Oct 26 2023 15:31:43.478
          Missed count: 0
        Responder IP          : 1::1
        Number of Hops        : 3

      Atomic path:
        Flow Label            : 10
        Session ID            : 4179
        Trace ID              : 1866227171
        Atomic path to be deleted: False
        NPU Offloaded session : False
        Timestamping Enabled  : True
        Liveness Detection: Enabled
          Session State: Up
          Last State Change Timestamp: Oct 26 2023 15:31:43.478
          Missed count: 0
        Responder IP          : 1::1
        Number of Hops        : 3

    Segment-List              : sl-scale
      fccc:cc00:1:fe10:: (Local Adjacency SID)
      fccc:cc00:2:fed1::/64
        Format: f3216
      Segment List ID: 0
      Reverse path segment-List: Not configured
      Segment-list to be deleted: False
      Number of atomic paths  : 2
      Liveness Detection: Enabled
        Session State: Up
        Last State Change Timestamp: Oct 26 2023 15:31:43.478
        Missed count: 0

      Atomic path:
       Flow Label            : 0
        Session ID            : 4180
        Trace ID              : 2609815826
        Atomic path to be deleted: False
        NPU Offloaded session : False
        Timestamping Enabled  : True
        Liveness Detection: Enabled
          Session State: Up
          Last State Change Timestamp: Oct 26 2023 15:31:43.478
          Missed count: 0
        Responder IP          : 1::1
        Number of Hops        : 3

      Atomic path:
        Flow Label            : 10
        Session ID            : 4181
        Trace ID              : 170501506
        Atomic path to be deleted: False
        NPU Offloaded session : False
        Timestamping Enabled  : True
        Liveness Detection: Enabled
          Session State: Up
          Last State Change Timestamp: Oct 26 2023 15:31:43.478
          Missed count: 0
        Responder IP          : 1::1
        Number of Hops        : 3

----------------------------------------------------------------------------------------------------------------------------------------------------------------
0/RSP0/CPU0
----------------------------------------------------------------------------------------------------------------------------------------------------------------

Delay measurement

Delay measurement is a network performance monitoring method that

  • measures the latency or delay experienced by data packets when they traverse a network

  • uses the IP/UDP packet format defined in simple TWAMP using RFC8972 for probes, and

  • employs time stamps applied at the echo destination (reflector) to enable greater accuracy for two-way or round-trip measurement capabilities.

Table 7. Feature History Table

Feature Name

Release Information

Feature Description

Delay Measurement

Release 25.1.1

Introduced in this release on: Fixed Systems (8010 [ASIC: A100])

Delay measurement in SR networks involves monitoring the end-to-end delay experienced by traffic sent over an SR policy. Link delay metrics such as average, minimum, and maximum delay, and delay variance are used to determine network latency. You can ensure compliance with Service Level Agreements (SLAs) by monitoring the end-to-end delay experienced by traffic.

This feature is now supported on:

  • 8011-4G24Y4H-I

Two-Way Active Measurement Protocol

The Two-Way Active Measurement Protocol (TWAMP) is a network measurement protocol used for measuring two-way or round-trip IP performance metrics, such as latency (delay) and packet loss, between any two devices in a network. It adds two-way or round-trip measurement capabilities. In the case of TWAMP Light, the Session-Reflector doesn’t necessarily know about the session state. The Session-Reflector simply copies the Sequence Number of the received packet to the Sequence Number field of the reflected packet. The controller then receives the reflected test packets and collects two-way metrics. This architecture allows for the collection of two-way metrics.

Benefits of delay measurement

Delay measurement offers several key benefits for network management:

  • Network troubleshooting: You can quickly and easily identify areas in your network with high delay and resolve network problems using delay measurement.

  • Network planning and optimization: You can easily understand the performance of your network under various conditions and design a network that can handle expected traffic loads.

  • Quality of Service (QoS): You can ensure quality of service standards are being met by continuously monitoring the delay in your network.

Measurement modes

SRv6 performance measurement supports three distinct modes for measuring delay: One-way, Two-way, and Loopback.

Each mode offers different capabilities and hardware requirements to assess network latency.

Table 8. Measurement Mode Requirements

Measurement Mode

One-way

Two-way

Loopback

Description

One-way measurement mode is a delay measurement mode that offers the most precise form of one-way delay measurement.

Two-way measurement mode is a delay measurement mode that focuses on measuring round-trip network performance. It provides two-way delay measurements.

Loopback measurement mode is a delay measurement mode that utilizes a loopback mechanism for delay measurement. It provides both two-way and one-way delay measurements.

Formula used for calculation

Delay measurement in one-way mode is calculated as (T2 – T1).

Delay measurement in two-way mode is calculated as ((T4 – T1) – (T3 – T2))/2.

Delay measurements in Loopback mode are calculated as follows:

  • Round-Trip Delay = (T4 – T1)

  • One-Way Delay = Round-Trip Delay/2

Sender:

PTP-Capable HW and HW Timestamping

Required

Required

Required

Reflector:

PTP-Capable HW and HW Timestamping

Required

Required

Not Required

PTP Clock Synchronization between Sender and Reflector

Required

Not Required

Not Required

How one-way delay measurement works

Delay measurement in one-way mode is calculated as (T2 – T1)

Summary

The one-way delay measurement process involves a local-end router and a remote-end router exchanging PM query and response packets with hardware timestamps to precisely calculate the one-way delay.

Workflow

Figure 2. One-Way

These stages describe how one-way delay measurement works:

  1. The local-end router sends PM query packets periodically to the remote side once the egress line card on the router applies timestamps on packets.
  2. The ingress line card on the remote-end router applies time-stamps on packets as soon as they are received.
  3. The remote-end router sends the PM packets containing time-stamps back to the local-end router.
  4. One-way delay is measured using the time-stamp values in the PM packet.

How loopback delay measurement works

Loopback measurement mode provides both two-way and one-way delay measurements. PTP-capable hardware and hardware timestamping are required on the Sender, but are not required on the Reflector. Delay measurements in Loopback mode are calculated as follows:

Round-Trip Delay = (T4 – T1) and One-Way Delay = Round-Trip Delay/2.

Summary

The loopback delay measurement process involves a local-end router sending probe packets that are looped back by an endpoint node without timestamping, allowing the local-end router to calculate round-trip and one-way delays.

Workflow

Figure 3. Loopback

These stages describe how loopback delay measurement works:

  1. The local-end router sends PM probe packets periodically on the SR Policy.
  2. The egress line card on the local-end router applies timestamps (T1) on these packets.
  3. The probe packets are looped back on the endpoint node (not punted), with no timestamping performed on the endpoint node.
  4. The local-end router timestamps the looped-back packet (T4) as soon as it is received.

How loopback delay measurement works

Loopback measurement mode provides both two-way and one-way delay measurements. PTP-capable hardware and hardware timestamping are required on the Sender, but are not required on the Reflector. Delay measurements in Loopback mode are calculated as follows:

Round-Trip Delay = (T4 – T1) and One-Way Delay = Round-Trip Delay/2.

Summary

The loopback delay measurement process involves a local-end router sending probe packets that are looped back by an endpoint node without timestamping, allowing the local-end router to calculate round-trip and one-way delays.

Workflow

Figure 4. Loopback

These stages describe how loopback delay measurement works:

  1. The local-end router sends PM probe packets periodically on the SR Policy.
  2. The egress line card on the local-end router applies timestamps (T1) on these packets.
  3. The probe packets are looped back on the endpoint node (not punted), with no timestamping performed on the endpoint node.
  4. The local-end router timestamps the looped-back packet (T4) as soon as it is received.

Delay measurement for IP Endpoint

Delay for an IP endpoint is the amount of time that

  • it takes for a data packet to travel from a source device to a specific IP endpoint within a network

  • is measured by sending a probe packet from a source device to the target IP endpoint and recording the time from departure to arrival, and

  • can be measured as one-way, two-way, roundtrip, or in loop-back mode.

Table 9. Feature History Table

Feature Name

Release Information

Feature Description

Delay Measurement for IP Endpoint over SRv6 Network

Release 24.4.1

Introduced in this release on: Fixed Systems (8200 [ASIC: P100], 8700 [ASIC: P100, K100])(select variants only*); Modular Systems (8800 [LC ASIC: P100])(select variants only*)

* This feature is supported on:

  • 8212-48FH-M

  • 8711-32FH-M

  • 8712-MOD-M

  • 88-LC1-36EH

  • 88-LC1-12TH24FH-E

  • 88-LC1-52Y8H-EM

Delay Measurement for IP Endpoint over SRv6 Network

Release 24.2.11

In Segment Routing over an IPv6 network (SRv6), you can measure packet delay from the source to a specific IP endpoint. You can use this information for troubleshooting, network maintenance, and optimizing network performance.

Additionally, you can use flow labels to verify the delay of each subsequent hop path towards the IP endpoint of that path. So that, when network traffic is distributed across multiple available paths towards an IP endpoint, delay measurement tracks the delay of each of these paths towards the IP endpoint.

The feature introduces these changes:

CLI:

YANG Data Model:

  • Cisco-IOS-XR-um-performance-measurement-cfg

  • Cisco-IOS-XR-perf-meas-oper.yang

(See GitHub, YANG Data Models Navigator)

Supported features for delay measurement for IP Endpoint

  • IPv6 Endpoint Delay in Default VRF (over SRv6)

  • SRv6 Endpoint Delay in Default VRF (Endpoint can be Node SID, Flex-Algo SID, Packed uSID carrier)

  • IPv6 Endpoint Delay in VRF (static uDT6)

  • IPv6 Endpoint Delay in VRF (dynamic uDT6 encap)

  • IPv4 Endpoint Delay in VRF or GRT (static uDT4)

  • IPv4 Endpoint Delay in VRF or GRT (dynamic uDT4 encap)

IP endpoint probe statistics collection

  • Statistics associated with the probe for delay metrics are available via Histogram and Streaming Telemetry.

  • Model Driven Telemetry (MDT) is supported for the following data:

    • Summary, endpoint, session, and counter show command bags.

    • History buffers data

  • Model Driven Telemetry (MDT) and Event Driven Telemetry (EDT) are supported for the following data:

    • Delay metrics computed in the last probe computation-interval (event: probe-completed)

    • Delay metrics computed in the last aggregation-interval; that is, end of the periodic advertisement-interval (event: advertisement-interval expired)

    • Delay metrics last notified (event: notification-triggered)

  • These xpaths for MDT/EDT is supported:

    • Cisco-IOS-XR-perf-meas-oper:performance-measurement/nodes/node/endpoints/ endpoint-delay/endpoint-last-probes

    • Cisco-IOS-XR-perf-meas-oper:performance-measurement/nodes/node/endpoints/ endpoint-delay/endpoint-last-aggregations

    • Cisco-IOS-XR-perf-meas-oper:performance-measurement/nodes/node/endpoints/ endpoint-delay/endpoint-last-advertisements

Usage guidelines for delay measurement for IP Endpoint

PTP-capable hardware

SR PM is supported only on hardware that supports Precision Time Protocol (PTP). This requirement applies to both one-way and two-way delay measurement.

Custom segment lists for delay measurement probes

You can specify a custom labeled path through one or more user-configured segment-lists. A user-configured segment-list defines the forwarding path from the sender to the reflector when the probe operates in delay-measurement mode. Examples of such custom segment lists include:

  • A segment-list that includes a Flex-Algo prefix SID of the endpoint.

  • A segment-list that includes a SID-list with labels to reach the endpoint or the sender (forward direction).

  • A segment-list that includes a BSID associated with an SR policy to reach the endpoint.

Unsupported features

These features are not supported for delay measurement for IP Endpoint:

  • Endpoint segment list configuration under a nondefault VRF.

  • Liveness sessions without a segment list for an endpoint in a non-default VRF.

  • SR Performance Measurement endpoint sessions over a BVI interface.

Configure IP Endpoint delay measurement over SRv6 network

Procedure

Step 1

Configure the IP Endpoint delay measurement.

Example:

RP/0/RSP0/CPU0:ios#configure
RP/0/RSP0/CPU0:ios(config)#performance-measurement
RP/0/RSP0/CPU0:ios(config-perf-meas)#endpoint ipv6 FCBB:0:1::
RP/0/RSP0/CPU0:ios(config-pm-ep)#delay-measurement
RP/0/RSP0/CPU0:ios(config-pm-ep-dm)#delay-profile name test
RP/0/RSP0/CPU0:ios(config-pm-ep-dm)#exit
RP/0/RSP0/CPU0:ios(config-pm-ep)#exit
RP/0/RSP0/CPU0:ios(config-perf-meas)#liveness-profile name test
RP/0/RSP0/CPU0:ios(config-pm-ld-profile)#probe
RP/0/RSP0/CPU0:ios(config-pm-ld-probe)#flow-label explicit 100 200 300
RP/0/RSP0/CPU0:ios(config-pm-ld-probe)#

The following example shows how to use flow label for delay profile for a default endpoint:


RP/0/RSP0/CPU0:ios#configure
RP/0/RSP0/CPU0:ios(config)#performance-measurement
RP/0/RSP0/CPU0:ios(config-perf-meas)#delay-profile endpoint default          
RP/0/RSP0/CPU0:ios(config-pm-dm-ep)#probe 
RP/0/RSP0/CPU0:ios(config-pm-dm-ep-probe)#flow-label explicit 100 200 300

Step 2

Verify the show running configuration.

Example:
performance-measurement
 endpoint ipv6 FCBB:0:1::
  delay-measurement
   delay-profile name test
  !
 !
 liveness-profile name test
  probe
   flow-label explicit 100 200 300
  !
 !
!

Step 3

Verify the delay information for the endpoint.

Example:
Router# show performance-measurement endpoint detail
Endpoint name: IPv6-FCBB:0:1::-vrf-default
  Source address              : 192::2
  VRF name                    : default
  Liveness Detection          : Enabled
  Profile Keys:
    Profile name              : default
    Profile type              : Endpoint Liveness Detection
  Segment-list                : None
  Liveness Detection session:
    Session ID                : 4109
    Flow-label                : 1000
    Session State: Up
    Last State Change Timestamp: Jan 23 2024 16:06:01.214
    Missed count: 0

  Liveness Detection session:
    Session ID                : 4110
    Flow-label                : 2000
    Session State: Up
    Last State Change Timestamp: Jan 23 2024 16:06:01.214
    Missed count: 0

  Segment-list                : test-dm-two-carrier-sl2
    FCBB:0:1:2:e004::/64
      Format: f3216
    FCBB:0:1:3:e000::/64
      Format: f3216
    FCBB:0:1:2:e004::/64
      Format: f3216
    FCBB:0:1:2:e000::/64
      Format: f3216
    FCBB:0:1:1:e000::/64
      Format: f3216
    FCBB:0:1:1:e004::/64
      Format: f3216
    FCBB:0:1:4:e000::/64
      Format: f3216
    FCBB:0:1:4::/48
      Format: f3216
  Liveness Detection session:
    Session ID                : 4111
    Flow-label                : 1000
    Session State: Up
    Last State Change Timestamp: Jan 23 2024 16:06:01.217
    Missed count: 0

  Liveness Detection session:
    Session ID                : 4112
    Flow-label                : 2000
    Session State: Up
    Last State Change Timestamp: Jan 23 2024 16:06:01.217
    Missed count: 0 

Path tracing in SRv6 Network

An SRv6 path tracing is a network diagnostic feature that

  • records the actual packet path as a sequence of interface IDs and timestamps

  • measures end-to-end delay and per-hop delay between network nodes, and

  • identifies the load on each egress interface along the packet delivery path.

Table 10. Feature History Table

Feature Name

Release

Description

Path Tracing Midpoint Node

Release 25.1.1

Introduced in this release on: Fixed Systems (8010 [ASIC: A100])

This feature is now supported on:

  • 8011-4G24Y4H-I

Path Tracing Source and Sink Nodes

Release 25.1.1

Introduced in this release on: Fixed Systems (8700 [ASIC: K100])(select variants only*)

*This feature is supported on Cisco 8712-MOD-M routers.

Path Tracing Midpoint Node

Release 24.4.1

Introduced in this release on: Fixed Systems (8200 [ASIC: P100], 8700 [ASIC: P100, K100])(select variants only*); Modular Systems (8800 [LC ASIC: P100])(select variants only*)

*This feature is supported on:

  • 8212-48FH-M

  • 8711-32FH-M

  • 8712-MOD-M

  • 88-LC1-36EH

  • 88-LC1-12TH24FH-E

  • 88-LC1-52Y8H-EM

Path Tracing Source and Sink Nodes

Release 24.4.1

Introduced in this release on: Fixed Systems (8200 [ASIC: P100], 8700 [ASIC: P100])(select variants only*); Modular Systems (8800 [LC ASIC: P100])(select variants only*)

*This feature is supported on:

  • 8212-48FH-M

  • 8711-32FH-M

  • 88-LC1-36EH

  • 88-LC1-12TH24FH-E

  • 88-LC1-52Y8H-EM

Path Tracing Source and Sink Nodes

Release 24.1.1

You can now view the Path Tracing Source and Sink nodes, which are responsible for handling IPv6 transit traffic. This feature also provides full characterization of the packet delivery path which includes real-time information to check the current status of the network, such as whether packets are being diverted due to a breach. It also allows for the pinpointing of the exact location of problems between routers, and ensures that traffic flows according to specified priorities for Quality of Service (QoS) enforcement.

This feature introduces a new behavior keyword utef under the route (static command.

Path Tracing Midpoint Node

Release 7.8.1

Path Tracing (PT) provides a log or record of the packet path as a sequence of interface IDs along with its time stamp. In Path Tracing, a node can behave as a source, midpoint, or sink node.

The Path Tracing Midpoint feature is implemented in this release which measures the hop-by-hop delay, traces the path in the network and collects egress interface load information and interface Id, and stores them in the Midpoint Compressed Data (MCD) section of Hop-by-Hop Path Tracing (HbH-PT) header.

This feature provides visibility to the Path Tracing Midpoint node that handles IPv6 transit in Path Tracing and full characterization of the packet delivery path. It provides real time information and the current status of the network.

This feature introduces the following command:

Operators do not know the actual path that the packets take within their network. This makes operations, such as troubleshooting routing problems, or verifying Equal-Cost Multipath (ECMP), a complex problem. Also, operators want to characterize the network in terms of delay and load on a per-hop basis. Knowledge of the Path Tracing Midpoint helps the operators to troubleshoot the routing problems faster.

Benefits of path tracing

  • Detect the actual path the packet takes between any two nodes in network (A and Z).

  • Measure the end-to-end delay from A to Z.

  • Measure the per-hop delay at each node on the path from A to Z.

  • Detects the load on each router that forwards the packet from A to Z

Usage Guidelines for SRv6 Path Tracing

Be aware of these limitations and supported configurations when implementing path tracing to ensure expected functionality.

  • Support for PT Midpoint, PT Source, and PT Sink functionalities starts from Cisco IOS XR Release 24.1.1.

  • PT Source and Sink nodes are not supported. The system can still work as PT midpoint for other devices acting as Source or Sink in the PT network path.

  • No support for interface load calculation and recording on IPv6 Path Tracing MidPoint Node. MCD contains interface load value of 0.

  • SRv6 Segment Endpoint Midpoint PT (Update DA from SRH.SL and PT MCD update) at midpoint node is not supported. SRv6 endpoint function will not execute properly.

  • IPv6 and SRv6 Path Tracing Midpoint Node are supported. SRv6 PT midpoint support Micro-SID (uSID) Shift and Forward action with MCD update.

  • Path tracing on Bundled Interfaces and subinterfaces is supported by configuring path-tracing interface-id on physical ports.

  • PT unaware IPv6 and SRv6 midpoint forwards transparently without PT update or may punt the packet locally and the control-plane drops the packet.

  • PT unaware SRv6 Segment Endpoint Midpoint Node will not execute SRv6 endpoint function. PT packet is forwarded transparently without PT update or punted locally and the control-plane drops the packet.

How SRv6 Path Tracing works

Summary

Actors involved in the path tracing process are:

  • PT Source Node: Generates and injects probe packets towards a destination node.

  • PT Midpoint Node: Transit nodes that perform IPv6 routing and may record or export Path Tracing information. This category includes:

    • PT-Aware Midpoint: Records PT information (MCD) in the HbH-PT header.

    • PT-Legacy Midpoint: Exports PT information directly to the collector.

    • PT-Unaware Midpoint: Performs routing without recording or exporting PT information.

  • PT Sink Node: Receives PT probes from the Source node, records its own PT information, and forwards them to a Regional Collector.

  • Regional Collector (RC): Receives PT probes, parses them, reconstructs the packet delivery path, and stores the data.

The Path Tracing process begins with a PT Source Node injecting probe packets into the network. These probes travel through various PT Midpoint Nodes, which may add their tracing data to a Hop-by-Hop Path Tracing (HbH-PT) header or export it directly. The PT Sink Node receives these probes, adds its own information, and sends them to a Regional Collector (RC). The RC then reconstructs the complete packet delivery path and timing details from the collected data.

Workflow

These stages describe how path tracing works.

  1. PT source node: Initiates a PT session by generating and injecting probe packets towards a destination.
  2. PT midpoint node: A transit node that performs IPv6 routing and, depending on its capability, records or exports path tracing information.
    • PT-aware midpoint: Records its PT information (Midpoint Compressed Data - MCD) into the probe's Hop-by-Hop Path Tracing (HbH-PT) header.
    • PT-legacy midpoint: Exports its PT information directly to a collector.
    • PT-unaware midpoint: Forwards probes without recording or exporting PT information.
  3. PT sink node: Receives PT probes, records its own Path Tracing information, and forwards the complete data to a Regional Collector.
  4. Regional collector (RC): Collects, parses, and reconstructs the packet delivery path from received PT probes for storage and analysis.

Configure path tracing in SRv6 network

To enable and configure path tracing functionality across different network roles (source, midpoint, sink) for monitoring packet paths.

Path tracing provides a log of the packet path, including interface IDs, timestamps, and delay metrics. This task outlines the necessary configurations for each node type to participate in a Path Tracing session.

Procedure


Step 1

Configuration example of Source node:

  1. Configure the performance measurement endpoint for path tracing and path assurance

    Example:

    
    Router(config)# performance-measurement
    Router(config-perf-meas)# endpoint ipv6 fccc:cc00:9000:fef1::
    Router(config-pm-ep)# path-tracing
    Router(config-pm-ep-ptrace)# session-id 1011
    Router(config-pm-ep-ptrace-sid)# segment-routing traffic-eng seg$
    Router(config-pm-ep-ptrace-sid)# probe-profile name PP_12_1
    Router(config-pm-ep-ptrace-sid)# source-address ipv6 1::1
    Router(config-pm-ep)# path-assurance
    Router(config-pm-ep-passurance)# session-id 1111
    Router(config-pm-ep-passurance-sid)# segment-routing traffic-eng$
    Router(config-pm-ep-passurance-sid)# probe-profile name PP_12_1
    
  2. Configure probe profile parameters.

    Example:

    
    Router(config)# performance-measurement
    Router(config-perf-meas)# path-tracing
    Router(config-pm-ptrace)# probe-profile name PP_12_1
    Router(config-pm-pr-profile)# tx-interval 3000
    Router(config-pm-pr-profile)# flow-label explicit 1000 2000 4000 8$
    Router(config-pm-pr-profile)# traffic-class from 16 to 128 increme$
  3. Configure Interface ID under path-tracing for the source node and for it to participate in the MCD updates inside the probe packets:

    Example:

    
    Router(config)# performance-measurement
    Router(config-pm)# interface FourHundredGigE0/0/0/1
    Router(config-pm-interf)# path-tracing
    Router(config-pm-interf-interf-id)# interface-id 200
    Router(config-pm-interf-time)# exit
  4. Verify the running configuration.

    Example:

    • Configure the endpoint with the probe profile name on the source node:
      
      performance-measurement
       endpoint ipv6 fccc:cc00:9000:fef1::
        path-tracing
         session-id 1011
          segment-routing traffic-eng seg$
          probe-profile name PP_12_1
          source-address ipv6 1::1
        path-assurance
         session-id 1111
          segment-routing traffic-eng$ 
          probe-profile name PP_12_1
          !
         !  
        !
      !
      Configure probe profile parameters:
      
      performance-measurement 
       path-tracing
        probe-profile name PP_12_1
         tx-interval 3000
         flow-label explicit 1000 2000 4000 8$
         traffic-class from 16 to 128 increme$
         !
        !
       !
      Configure Interface ID under Path-tracing for the Source node and for it to participate in the MCD updates inside the probe packets:
      
      performance-measurement
       interface FourHundredGigE0/0/0/1
        path-tracing
         interface-id 200
         exit
         !
        !
       !
      !
    • Running configuration example of Midpoint node:

      Configure the Interface ID under Path-tracing for the Midpoint node and for it to participate in the MCD updates inside the probe packets:

      
      performance-measurement
       interface FourHundredGigE0/0/0/1
        path-tracing
         interface-id 200
         exit
         !
        !
       !
      !

Step 2

Configure the Path Tracing midpoint node.

  1. Configure the Interface ID under Path-tracing for the Midpoint node and for it to participate in the MCD updates inside the probe packets:

    Example:


    Router(config)# performance-measurement
    Router(config-pm)# interface FourHundredGigE0/0/0/1
    Router(config-pm-interf)# path-tracing
    Router(config-pm-interf-interf-id)# interface-id 200
    Router(config-pm-interf-time)# exit

Step 3

Configure the Path Tracing sink node.

  1. Configure static routing for the SRv6 endpoint behavior.

    Example:

    
    Router(config)# router static
    Router(config-static)# address-family ipv6 unicast 
    Router(config-static-afi)# fccc:cc00:9000:fef1::/64 segment-routing srv6 endpoint behavior utef controller-address fccc:cc00:7::
    !
    
  2. Configure Interface ID under Path-tracing for the Sink node and for it to participate in the MCD updates inside the probe packets.

    Example:

    
    Router(config)# performance-measurement
    Router(config-pm)# interface FourHundredGigE0/0/0/1
    Router(config-pm-interf)# path-tracing
    Router(config-pm-interf-interf-id)# interface-id 200
    Router(config-pm-interf-time)# exit
  3. Verify the running configuration.

    Example:

    Configure Router Static:
    
    router static
     address-family ipv6 unicast 
      fccc:cc00:9000:fef1::/64 segment-routing srv6 endpoint behavior utef controller-address fccc:cc00:7::
      !
     !
    !
    Configure Interface ID under Path-tracing for the Sink node and for it to participate in the MCD updates inside the probe packets:
    
    performance-measurement
     interface FourHundredGigE0/0/0/1
      path-tracing
       interface-id 200
       exit
       !
      !
     !
    !

Step 4

Verify the path tracing configuration.

It is good to check the target interface configuration and performance-measurement configuration for that interface. Verify using the show commands listed to check if the PT configuration is applied to the interface properly.

Example:

Source node verification
Router# sh run performance-measurement
performance-measurement
probe-profile name foo
  tx-interval 6000
  flow-label from 100 to 300 increment 10
!
!
 
Router# sh performance-measurement profile named-profile
Endpoint Probe Measurement Profile Name: foo
  Profile configuration:
    Measurement mode                            : One-way
    Protocol type                               : TWAMP-light
    Type of service:
      TWAMP-light DSCP                          : 48
    TX interval                                 : 6000000 (effective: 6000000) uSec
    Destination sweeping mode                   : Disabled
    Liveness detection parameters:
      Multiplier                                : 3
      Logging state change                      : Disabled
 
    Hop Limit                                   : 255
    Flow Label Count                            : 21
      Flow Labels: 100, 110, 120, 130, 140, 150, 160, 170, 180, 190, 200, 210, 220, 230, 240,
                    250, 260, 270, 280, 290, 300
    Packet Size Count                           : 0
    Traffic Class Count                         : 0
 
 
Router#sh run performance-measurement
performance-measurement
endpoint ipv6 bbbb::
  path-assurance
   session-id 11
   !
  !
!
source-address ipv6 aaaa::
!

Router# sh performance-measurement endpoint
Endpoint name: IPv6-bbbb::-vrf-default
  Source address              : Unknown
  VRF name                    : default
  Probe Measurement           : Enabled
  Profile Keys:
    Profile name              : default
    Profile type              : Endpoint Probe Measurement

Run this show command to verify the probe sessions:
Router# show performance-measurement probe-sessions 
Transport type              : Endpoint
Measurement type            : Probe
Endpoint name               : IPv6-bbbb:bbbb:2::-vrf-default
endpoint                    : bbbb:bbbb:2::
source                      : bbbb:bbbb:1::
vrf                         : default
Segment-list                : 
Path Tracing session:
  Session ID          : 10
  Profile Keys:
    Profile name        : pt1
    Profile type        : Probe
  Current status:
    Packet sent every 0.30000 seconds (value stretched for rate-limiting)
    Next packet will be sent in 0.20 seconds
 
 
Transport type              : Endpoint
Measurement type            : Probe
Endpoint name               : IPv6-bbbb:bbbb:2::-vrf-default
endpoint                    : bbbb:bbbb:2::
source                      : bbbb:bbbb:1::
vrf                         : default
Segment-list                : 
Path Tracing session:
  Session ID          : 11
  Profile Keys:
    Profile name        : pt2 (Profile not found)
    Profile type        : N/A
  Current status:
    Not running: Profile is not configured  
 
Transport type              : Endpoint
Measurement type            : Probe
Endpoint name               : IPv6-bbbb:bbbb:2::-vrf-default
endpoint                    : bbbb:bbbb:2::
source                      : bbbb:bbbb:1::
vrf                         : default
Segment-list                : 
Path Assurance session:
  Session ID          : 20
  Profile Keys:
    Profile name        : pa1
    Profile type        : Probe
  Current status:
    Packet sent every 0.30000 seconds (value stretched for rate-limiting)
    Next packet will be sent in 0.24 seconds

Run this show command to view the summary of all the probe sessions:
Router# show performance-measurement summary
Measurement Information:
  Total interfaces with PM sessions             : 0
  Total SR Policies with PM sessions            : 0
  Total Endpoints with PM sessions              : 1
  Total RSVP-TE tunnels with PM sessions        : 0
 
    Global Counters:
      Total packets sent                        : 0
      Total query packets received              : 0
      Total invalid session id                  : 0
      Total missing session                     : 0
 
    Probe sessions:
      Total sessions                            : 3
       Path-tracing sessions:
          Total running sessions                : 1
          Total running error sessions          : 0
        Path-assurance sessions:
          Total running PA sessions             : 1
          Total running error PA sessions       : 0
      Counters:
        Path-tracing packets:
          Total sent                            : 3063
          Total sent errors                     : 0
        Path-assurance packets:
          Total sent                            : 470
          Total sent errors                     : 0

Router# show cef interface fourHundredGigE 0/0/0/1                                 
FourHundredGigE0/0/0/1 is up if_handle 0x0f000208 if_type IFT_FOURHUNDREDGE(0xcd)
  idb info 0x94dfbf88 flags 0x30001 ext 0x0
  Vrf Local Info (0x0)
  Interface last modified, create
  Reference count 1       Next-Hop Count 0
  PT (path tracing) is enabled: id:0xC8 load_in:0x0 load_out:0x0 tts:0x3
  Protocol Reference count 0
  Protocol ipv4 not configured or enabled on this card
  Primary IPV4 local address NOT PRESENT
This is an example of Show CLI with Interface ID:

Router# show run performance-measurement
performance-measurement
probe-profile name foo
  tx-interval 6000
  flow-label from 100 to 300 increment 10
!
!
Router# sh performance-measurement profile named-profile
Endpoint Probe Measurement Profile Name: foo
  Profile configuration:
    Measurement mode                            : One-way
    Protocol type                               : TWAMP-light
    Type of service:
      TWAMP-light DSCP                          : 48
    TX interval                                 : 6000000 (effective: 6000000) uSec
    Destination sweeping mode                   : Disabled
    Liveness detection parameters:
      Multiplier                                : 3
      Logging state change                      : Disabled
 
    Hop Limit                                   : 255
    Flow Label Count                            : 21
      Flow Labels: 100, 110, 120, 130, 140, 150, 160, 170, 180, 190, 200, 210, 220, 230, 240,
                    250, 260, 270, 280, 290, 300
    Packet Size Count                           : 0
    Traffic Class Count                         : 0
Router# show cef interface GigabitEthernet 0/2/0/0
GigabitEthernet0/2/0/0 is up if_handle 0x01000020 if_type IFT_GETHERNET(0xf)
  idb info 0x619f16f0 flags 0x30101 ext 0x627ef180 flags 0x30050
  Vrf Local Info (0x626510f0)
  Interface last modified Mar  4, 2022 13:34:43, modify
  Reference count 1       Next-Hop Count 3
  PT (path tracing) is enabled: id:0x40 load_in:0x0 load_out:0x0 tts:0x1
  Forwarding is enabled
  ICMP redirects are never sent
  ICMP unreachables are enabled
  Protocol MTU 1500, TableId 0xe0000000(0x61ccf768)
  Protocol Reference count 4
  Primary IPV4 local address 10.10.10.1


Router# show performance-measurement interfaces
Interface Name: GigabitEthernet0/2/0/0 (ifh: 0x1000020)
  Delay-Measurement                 : Disabled
  Loss-Measurement                  : Disabled
  Path-Tracing                      : Enabled
  Configured IPv4 Address           : 10.10.10.1
  Configured IPv6 Address           : 10:10:10::1
  Link Local IPv6 Address           : fe80::91:e4ff:fe60:6707
  Configured Next-hop Address       : Unknown
  Local MAC Address                 : 0291.e460.6707
  Next-hop MAC Address              : 023a.6fc9.cd6b
  In-use Source Address             : 10.10.10.1
  In-use Destination Address        : 10.10.10.2
  Primary VLAN Tag                  : None
  Secondary VLAN Tag                : None
  State                             : Up
 
  Path-Tracing:
    Interface ID                      : 64
    Load IN                           : 0
    Load OUT                          : 0
    Load Interval                     : 60
    Last FIB Update:
      Updated at: Mar 04 2022 13:34:43.112 (0.392 seconds ago)
      Update reason: Path tracing config
      Update status: Done
This is an example of Show CLI without InterfaceID, which means PT is disabled on the target interface. So, you can configure timestamp template:


Router# show cef interface GigabitEthernet 0/2/0/0
GigabitEthernet0/2/0/0 is up if_handle 0x01000020 if_type IFT_GETHERNET(0xf)
  idb info 0x619f16f0 flags 0x30101 ext 0x627ef180 flags 0x30050
  Vrf Local Info (0x626510f0)
  Interface last modified Mar  4, 2022 13:49:37, modify
  Reference count 1       Next-Hop Count 3
  Forwarding is enabled
  ICMP redirects are never sent
  ICMP unreachables are enabled
  Protocol MTU 1500, TableId 0xe0000000(0x61ccf768)
  Protocol Reference count 4
  Primary IPV4 local address 10.10.10.1

Router# sh performance-measurement interfaces
Interface Name: GigabitEthernet0/2/0/0 (ifh: 0x1000020)
  Delay-Measurement                 : Disabled
  Loss-Measurement                  : Disabled
  Path-Tracing                      : Enabled
  Configured IPv4 Address           : 10.10.10.1
  Configured IPv6 Address           : 10:10:10::1
  Link Local IPv6 Address           : fe80::91:e4ff:fe60:6707
  Configured Next-hop Address       : Unknown
  Local MAC Address                 : 0291.e460.6707
  Next-hop MAC Address              : 023a.6fc9.cd6b
  In-use Source Address             : 10.10.10.1
  In-use Destination Address        : 10.10.10.2
  Primary VLAN Tag                  : None
  Secondary VLAN Tag                : None
  State                             : Up
 
  Path-Tracing:
    Interface ID                      : 0
    Timestamp Template                : 3
    Load IN                           : 0
    Load OUT                          : 0
    Load Interval                     : 60
    Last FIB Update:
      Updated at: Mar 04 2022 13:49:37.492 (176.418 seconds ago)
      Update reason: Path tracing config
      Update status: Done
Sink Node Verification


Router# sh segment-routing srv6 sid fccc:cc00:1:fef1:: detail

SID                         Behavior          Context                                      Owner               State  RW
fccc:cc00:1:fef1::          uTEF              [fccc:cc01:7::, default]:fccc:cc00:1:fef1::  ip_static_srv6      InUse  Y
SID Function: 0xfef1
SID context: { controller=fccc:cc01:7::, table-id=0xe0800000 ('default':IPv6/Unicast), differentiator=fccc:cc00:1:fef1:: }
Locator: 'locator0'
Allocation type: Explicit

Router# sh segment-routing srv6 sid fccc:cc00:1:fef3:: detail
SID                         Behavior          Context                                      Owner               State  RW
fccc:cc00:1:fef3::          uTEF              [fccc:cc00:7::, default]:fccc:cc00:1:fef3::  ip_static_srv6      InUse  Y
SID Function: 0xfef3
SID context: { controller=fccc:cc00:7::, table-id=0xe0800000 ('default':IPv6/Unicast), differentiator=fccc:cc00:1:fef3:: }
Locator: 'locator0'
Allocation type: Explicit


Router# sh segment-routing srv6 sid fccc:cc01:1:fef2:: detail
SID                         Behavior          Context                           Owner               State  RW
fccc:cc01:1:fef2::          uTEF              [fccc:cc00:7::, default]:fccc:cc01:1:fef2::  ip_static_srv6      InUse  Y
SID Function: 0xfef2
SID context: { controller=fccc:cc00:7::, table-id=0xe0800000 ('default':IPv6/Unicast), differentiator=fccc:cc01:1:fef2:: }
Locator: 'locator1'
Allocation type: Explicit
Created: Feb 27 11:06:54.999 (00:10:05 ago)