Overview
Describes the beta feature for creating customized dashboards using pre-built dashlets to display aggregated views of client and device health, connectivity, and performance metrics.
This feature is in beta.
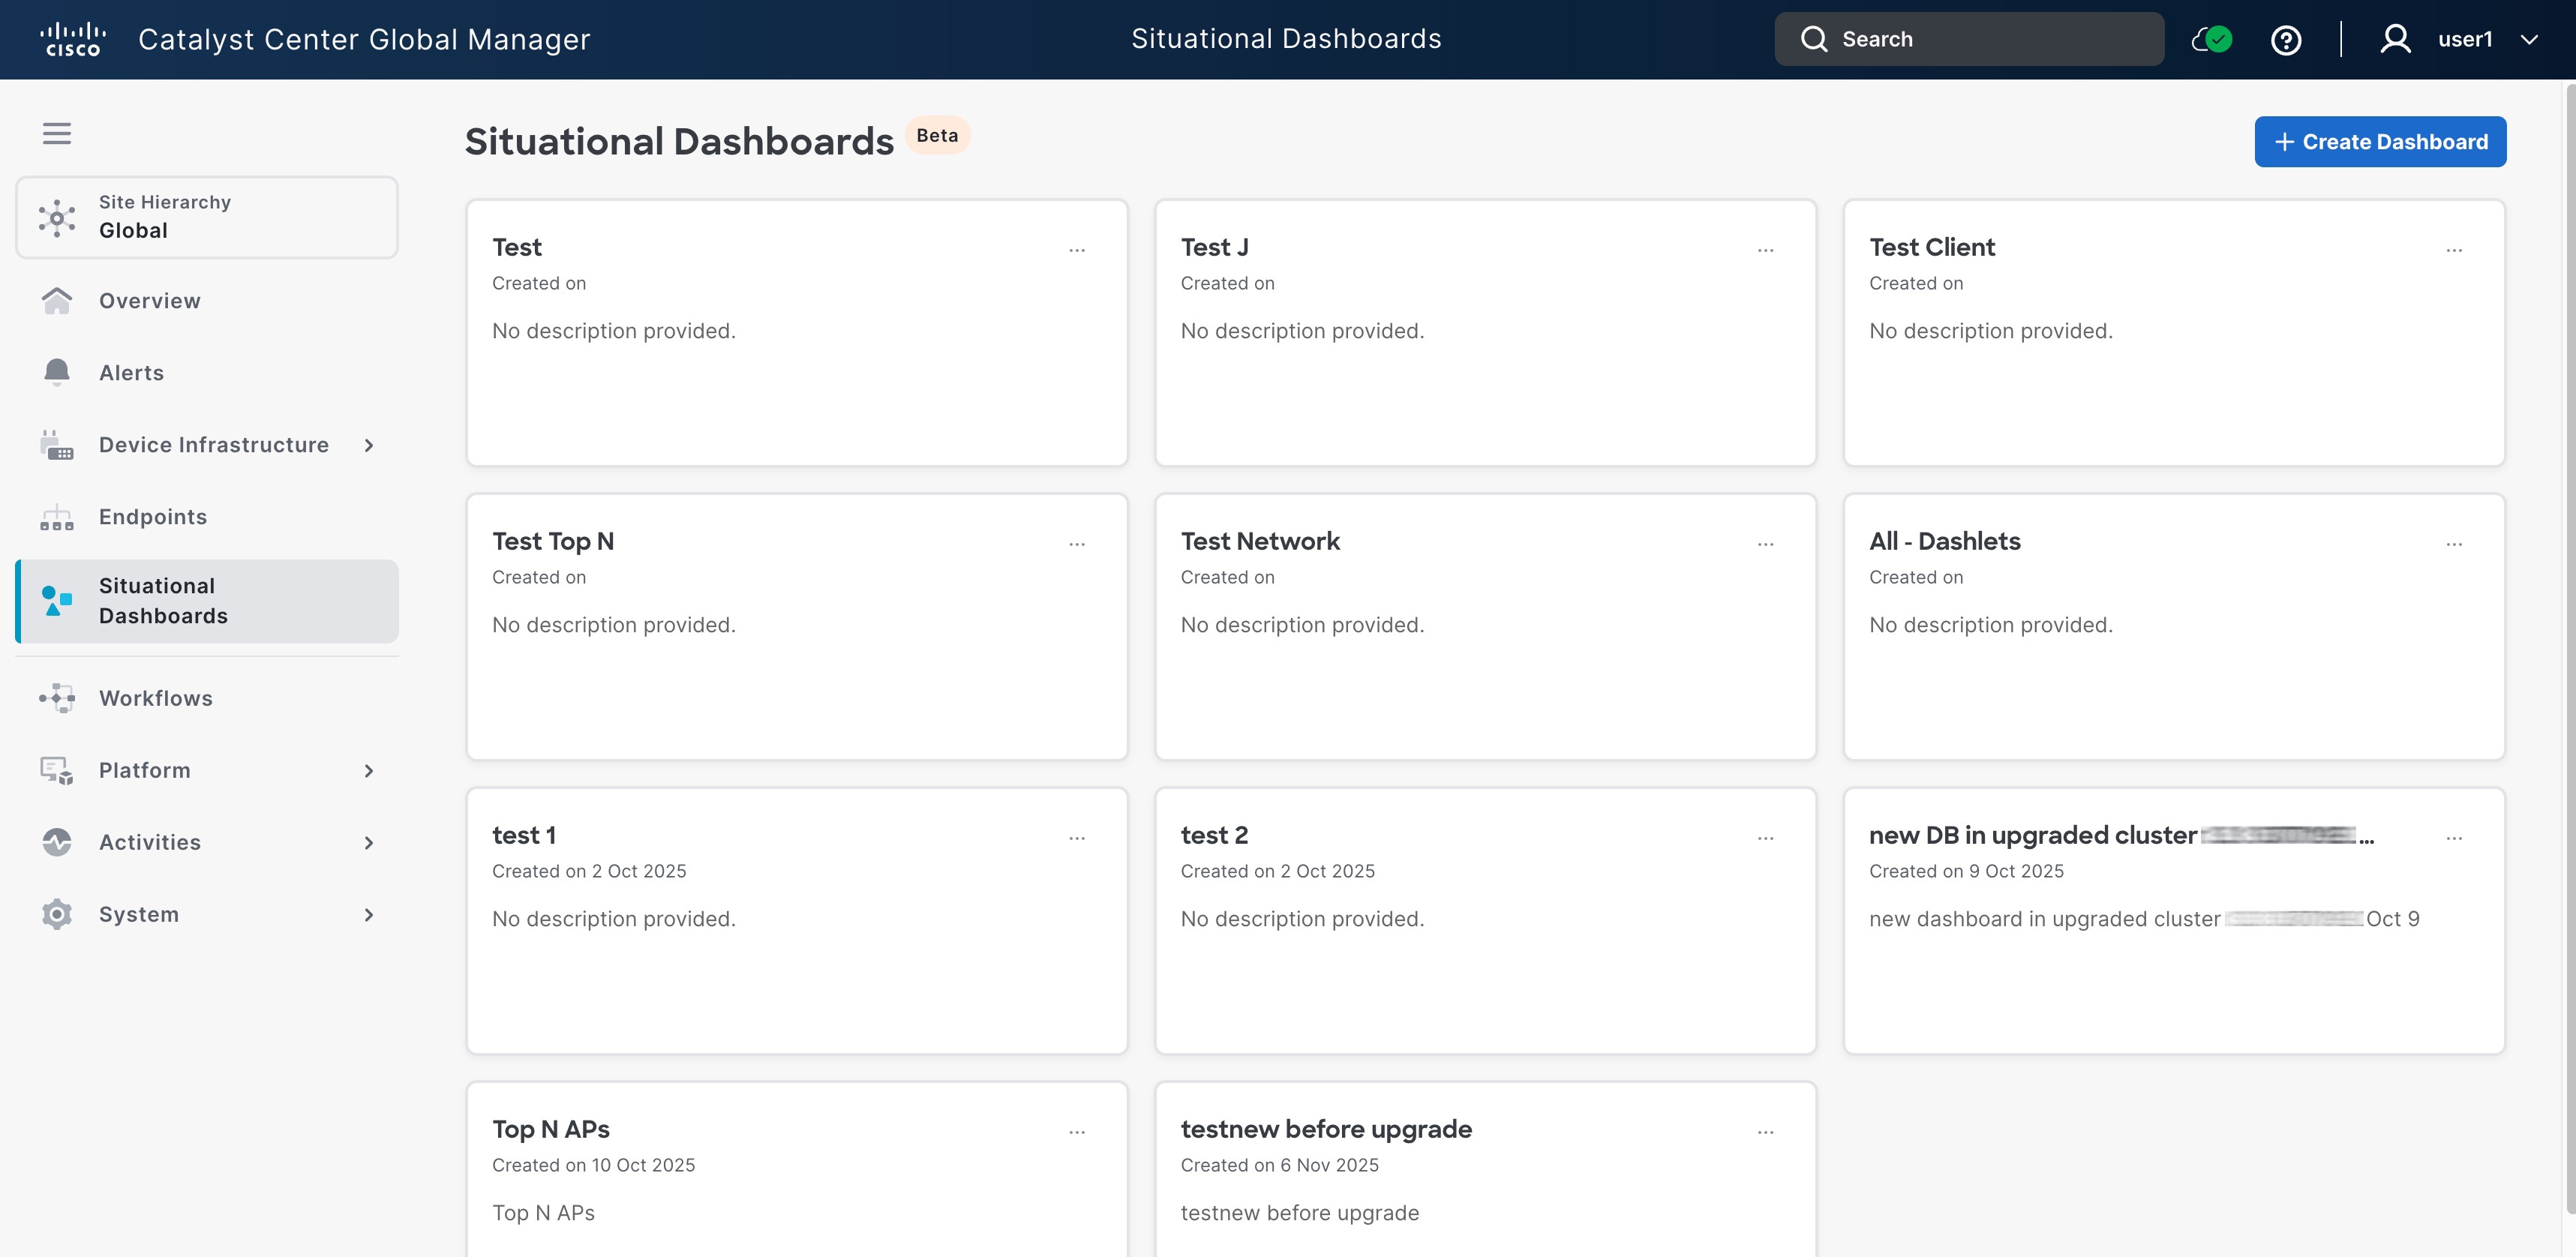
To view the situational dashboard, navigate to the Catalyst Center Global Manager dashboard and click Situational Dashboard. Then the page loads data progressively as it receives information from the enrolled controllers
The image here shows the situational dashboard page with different daslets.