Cisco Catalyst Center Global Manager Deployment Guide, Release 1.3.1

PDF

Device infrastructure

Want to summarize with AI?

Log in

Overview

Describes the Device Infrastructure section for viewing filtered details of device health and fabric sites, ensuring security and proper functioning.

The Device Infrastructure in Catalyst Center Global Managershows filtered details of each device health and fabric site. Use it to ensure your devices and fabric sites are secure and working well.


Device health

To view the health status of each device, navigate to the Catalyst Center Global Manager dashboard and click Device Infrastructure > Health. Then the page loads data progressively as it receives information from the enrolled controllers.

The health status categories are:

  • Poor Health: Devices with a health score range from 1 to 3.

  • Fair Health: Devices with a health score range from 4 to 7.

  • No Health Data: Devices with no data.

  • Good Health: Devices with a health score range from 8 to 10.

To see more information about a specific device, click the device name on Devices to cross-launch or navigate to their respective controller Device 360 page.

The Health page also gives information on:

  • Summary: Summary of network health based on each health category.

  • Analytics: Analytics shows the top site groups and top device types.

    You can interact with site groups and device types by selecting and unselecting the filter and based on the devices that are listed in a table as shown in the image.

    For example: When a site group is selected from the Top site groups chart, the Top device types chart will highlight the device types associated with that selected site group. Conversely, selecting a device type from the Top device types chart will highlight the site groups in the Top site groups chart that include those device types.

    You can select filters from both the Top site groups and Top device types analytics sections simultaneously. The Devices table below will then display devices filtered by the combination of these selected criteria, with the active filters visually highlighted. Unselecting a site group or device type selection from the analytics charts will clear the corresponding filter and update the Devices table accordingly.

  • Devices: Displays a table of all devices, including device name, device health, and device family, based on your selection.

    The devices table displays only 100 entries.

Data export allows you to export all the matching results from the table on the device Health page in CSV format.

Note

This feature is in beta.

You can apply filters to tables in Catalyst Center Global Manager; however, they are limited to display first 100 records of all the matching records in the list.

To export the device health:

  1. From the main menu, choose Device Infrastructure > Health.

  2. From the Devices section, click Export.

    The Device health export window appears.

  3. Click Export to export all results that match the applied filter.

  4. Click Download to see the exported data with the respective filter showing the health status.

Note

The data export process may take up to 30 minutes to complete because it progressively retrieves all matching results from the enrolled controller.

You can view the latest five exported reports, which are retained on the Download page for three days.


Software-Defined Access health

To view the Software-Defined Access health status of each fabric site, transit, layer 3 virtual network (L3 VN), and layer 2 virtual network (L2 VN), navigate to the Catalyst Center Global Manager dashboard and click Device Infrastructure > Software-Defined Access. Then the page loads data progressively as it receives information from the enrolled controllers.

The health status categories are:

  • Poor Health: Devices with a health score range from 1 to 3.

  • Fair Health: Devices with a health score range from 4 to 7.

  • No Health Data: Devices with no data.

  • Good Health: Devices with a health score range from 8 to 10.

The Software-Defined Access page also gives information on:

  • Fabric site health: It displays a table of fabric sites.

  • Transit health: It displays a table of transits.

  • Layer 3 virtual network health: It displays a table of L3 VNs.

  • Layer 2 virtual network health: It displays a table of L2 VNs.


End-of-Life Devices

To view the End-of-Life (EoL) of each device, navigate to the Catalyst Center Global Manager dashboard and click Device Infrastructure > End-of-life Devices. Then the page loads data progressively as it receives information from the enrolled controllers.

Note

This feature is in beta.

The End-of-Life devices feature delivers information on Cisco devices that have reached or are nearing their End-of-Life (EoL) status, including key hardware and software expiration dates. This feature is similar to the EoX (End-of-life) feature in Catalyst Center, offering detailed reports on device lifecycle milestones to help with product upgrade and substitution planning.

Support for this feature is available on Catalyst Center platforms running software versions later than 2.3.7.10 and build 3.1.5.

The EoL devices display counts for these categories:

  • Routers

  • Switches

  • Wireless

  • Accessories (can be part of router/switches/wireless)

To see more information about a specific device, click the device name on Devices to cross-launch or navigate to their respective controller Inventory details page.

The End-of-life Devices page also gives information on:

  • Summary: Summary of EOL devices based on each device category.

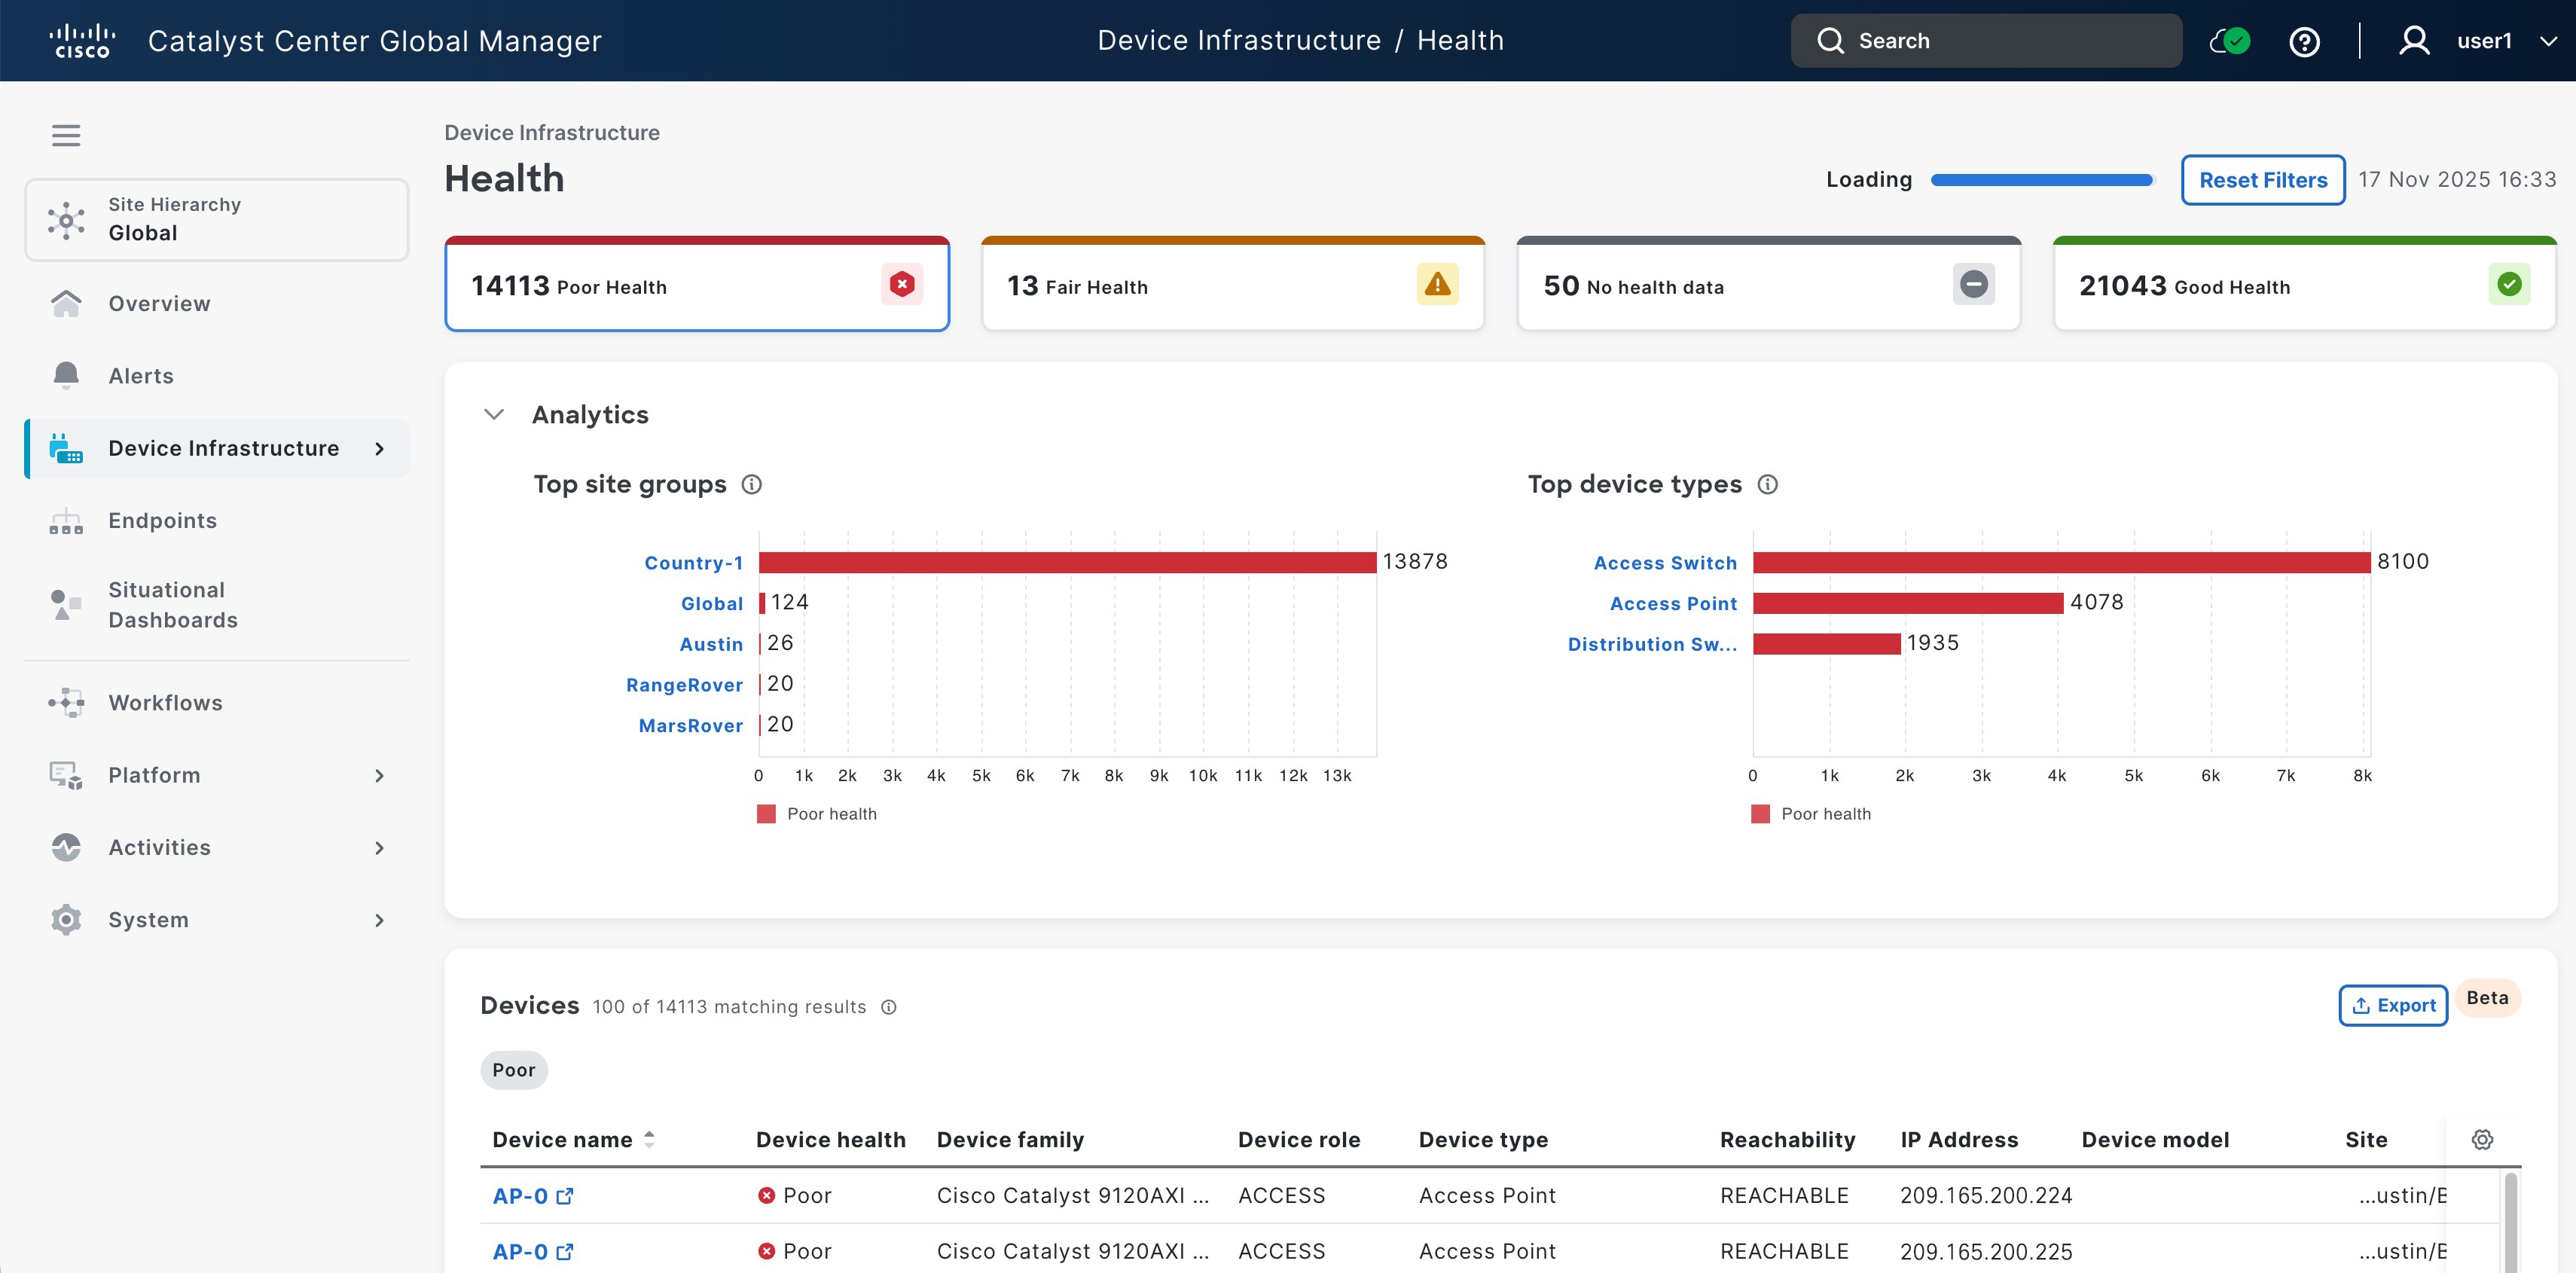
  • Analytics: Analytics shows the top five site groups and top device series, along with their individual counts.

    You can interact with site groups and device series by selecting and unselecting the filter and based on the devices that are listed in a table.

    For example: When a site group is selected from the Top site groups chart, the Top device series chart will highlight the device types associated with that selected site group. Conversely, selecting a device type from the Top device series chart will highlight the site groups in the Top site groups chart that include those device types.

    You can select filters from both the Top site groups and Top device series analytics sections simultaneously. The Devices table below will then show devices filtered by the the selected criteria, with active filters visually highlighted. The filters correspond to your selections for routers, switches, wireless devices, and accessories at the top. Unselecting a site group or device type selection from the analytics charts will clear the corresponding filter and update the Devices table accordingly.

  • Devices: Displays a table of all devices, including device name, IP address, site, device type, device model, chassis + modules, accessories, last date of support, and next milestone, based on your selection.

    Click on Chassis+ modules counts to view the EOL details for each hardware component, including accessories and software EOL data.

    Click the Accessories counts to view the EOL details for accessories components, such as fans and power supplies.

    Click Advanced filter to do further filters based on the columns selected in the Devices table.