Cisco Catalyst Center Global Manager Deployment Guide, Release 1.3.1

PDF

Monitor from the overview dashboard

Want to summarize with AI?

Log in

Overview

Explains how to use the Overview page to progressively load and display data from enrolled controllers, showing controller health, network status changes, and providing options to refresh and customize dashlets.

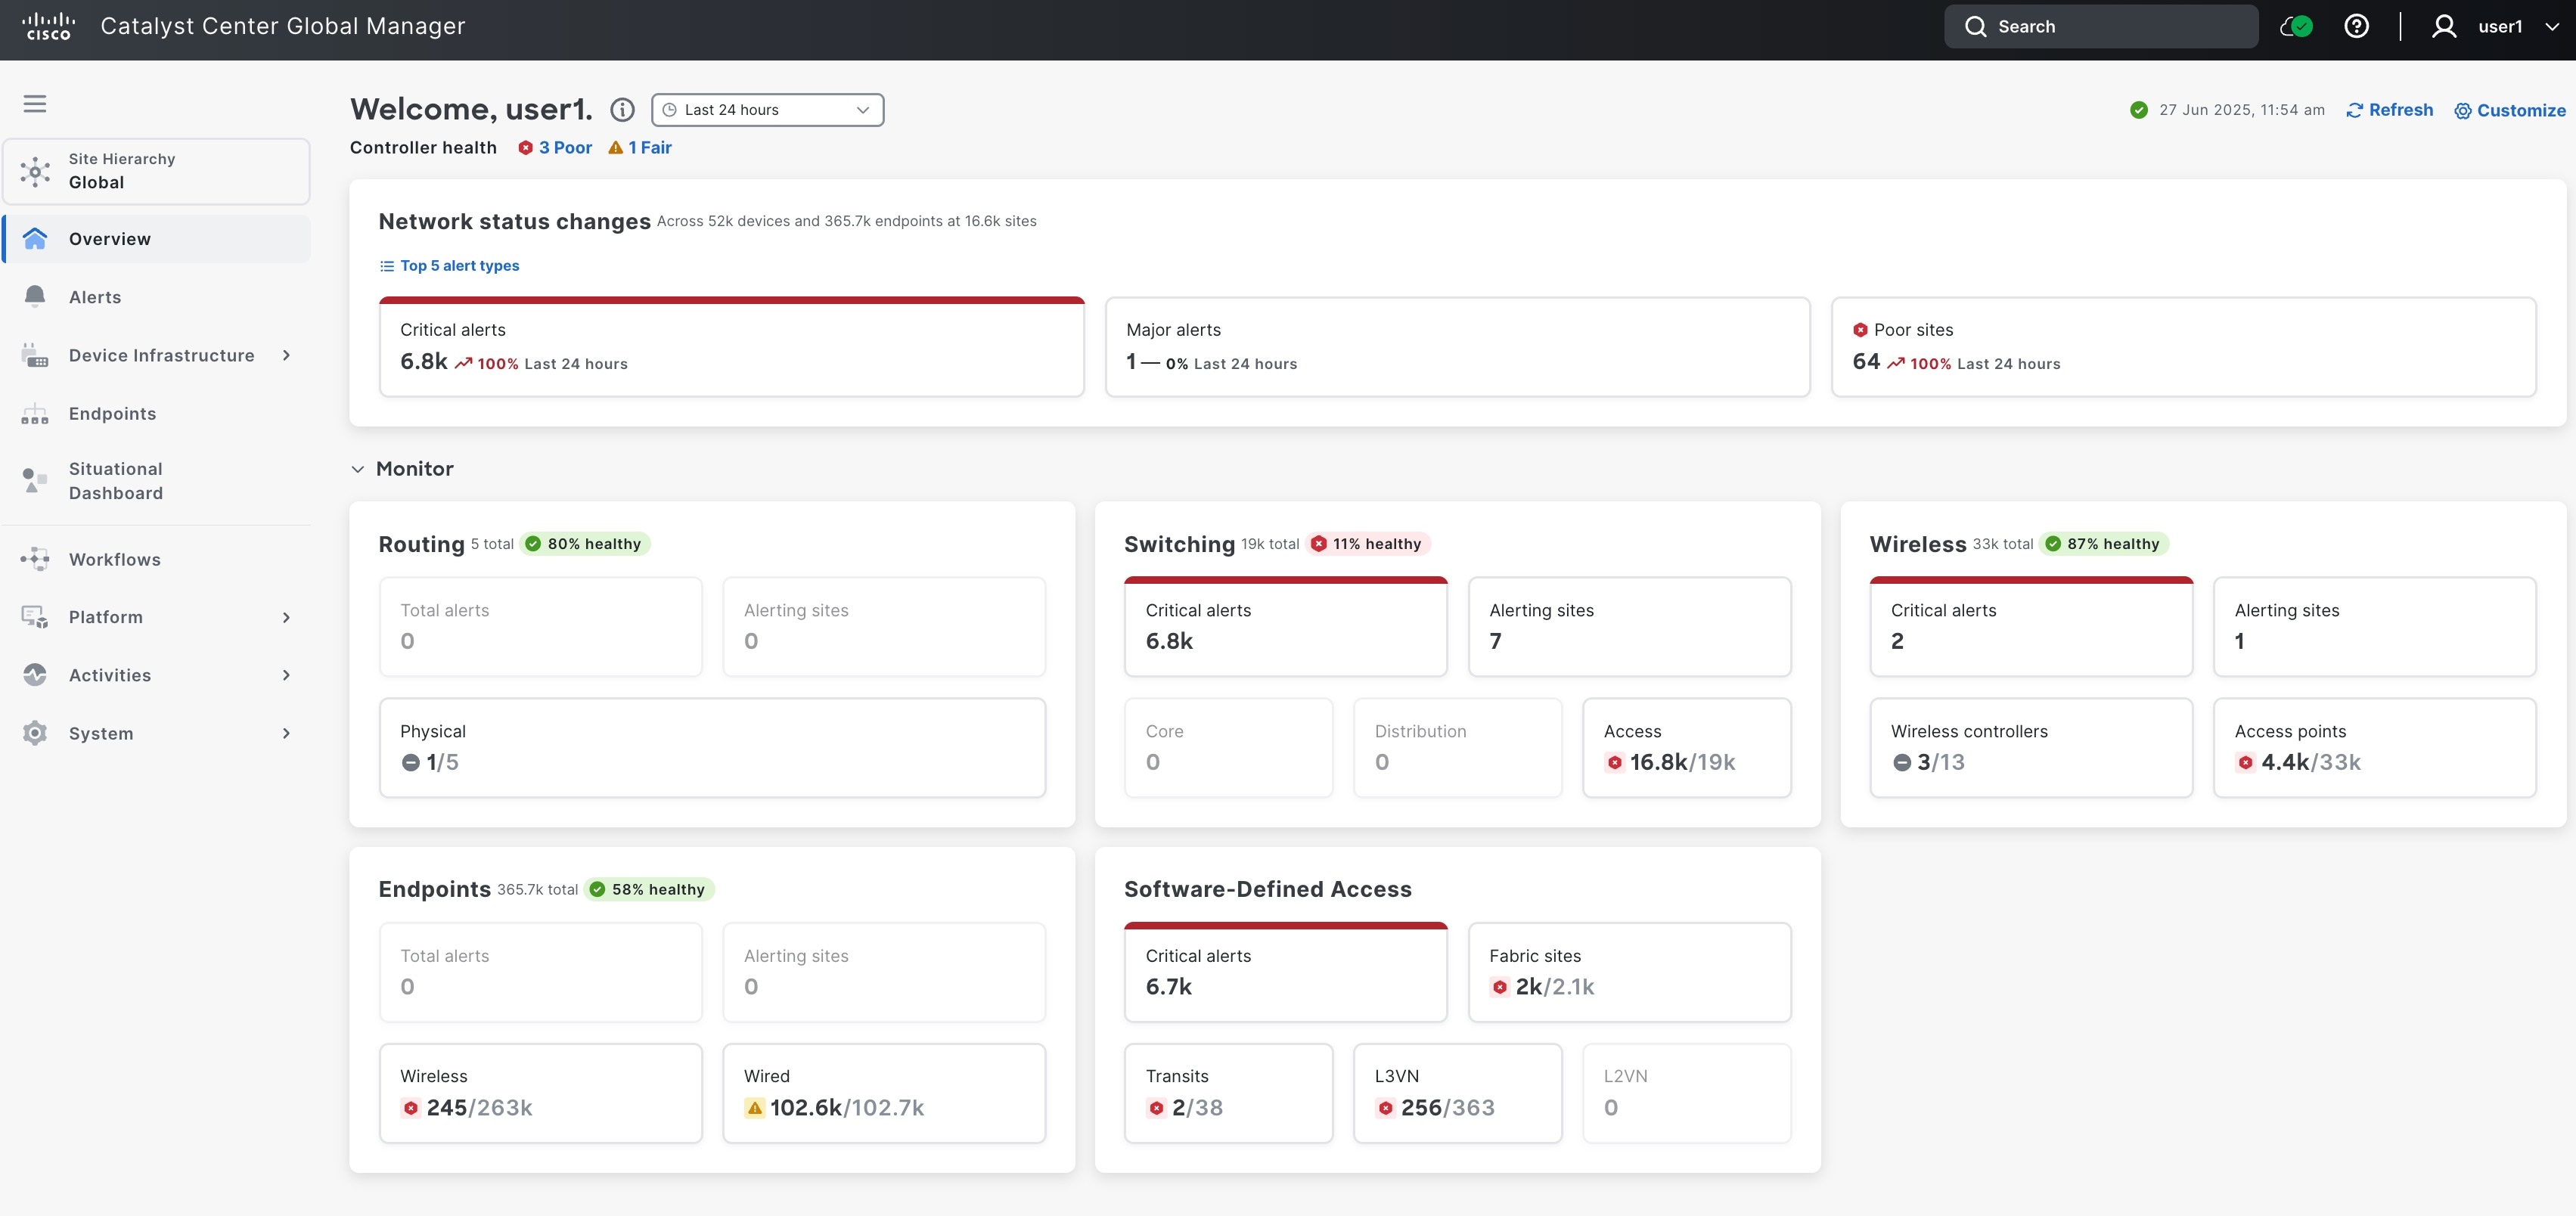
The Catalyst Center Global Manager Overview page includes controller health and additional details about individual controllers.

After you log in to Catalyst Center Global Manager and add controllers, the Catalyst Center Global Manager starts rendering data on the Overview page progressively. You can see a progress bar on the Overview page when the data loads incrementally as Catalyst Center Global Manager receives data from the enrolled controllers. This process is known as progressive loading.

Note

The total loading time of a page depends on the response time of each controller.

When all enrolled controllers respond with data, the progress bar turns green. The progress bar disappears within 5 seconds after the data load is complete.

All the second-level pages, including Alerts, Device infrastructure, Endpoints, and Situational Dashboards display a Loading complete progress indicator.

If the progess bar is:

  • Green- If the loading is success and it will vanish in five seconds.

  • Blue- While the loading is in progress.

  • Red- If the loading fails, and it will give you the loading error.

Note

If an error occurs while fetching data from enrolled controllers, the page displays a progress bar with error alerts. Hover over the bar to see how many controllers have responded. Click the loading status icon near the date and time to view detailed information about each failure for every dashlet in the Overview page.

Click Refresh to update the information displayed, ensuring you have the most current status of your network devices and components. This will provide you with the latest data on device health, performance, and any ongoing issues.

Click Customize to rearrange the dashlets within the different sections of the Overview page.


Monitor controller health

Support is available to view the controller health status from Catalyst Center Global Manager for individual Catalyst Centers.

From the Catalyst Center Global Manager Overview page, click on the controller's health status. This action will redirect you to the Controllers page within the Catalyst Center Global Manager displaying filtered data based on your selection.

Procedure

1.

On the Catalyst Center Global Manager dashboard, go to the Overview page and click the controller health status to view the health of the number of displayed controllers shown. Alternatively, go to System > Controllers to view the same information.

2.

Click one of the controller names to view the details. Use the cross-launch feature to access the respective controller's System health to view the health details and troubleshoot.

After this, you can proceed with additional troubleshooting steps on the Catalyst Center.

For information about controllers, see the Controllers.


Monitor network status changes

Network status changes provides an overview of networks across all devices and endpoints at multiple sites managed by all the Catalyst Centers. Use this information to identify potential issues that may require attention.

Procedure

From the Catalyst Center Global Manager dashboard, go to the Overview page to view the Network status changes section.

You can view these dashlets under Network status changes:

  • Critical Alerts

  • Major Alerts

  • Poor Sites


Monitor health of devices

Monitor these summaries and health of the devices:

  • Routing allows you to view:

    • Minor alerts

    • Alerting sites

    • Physical

  • Switching allows you to view:

    • Minor alerts

    • Alerting sites

    • Core

    • Distribution

    • Access

  • Wireless allows you to view:

    • Minor alerts

    • Alerting sites

    • Wireless controllers

    • Access points

  • Endpoints allows you to view:

    • Minor alerts

    • Alerting sites

    • Wireless

    • Wired

  • Software-Defined Access summaries allows you to view:

    • Total alerts

    • Fabric sites

    • Transits

    • L2 VN

    • L3 VN

Clicking each sub-card count opens the corresponding second-level pages, such as Alerts, Health, Software-Defined Access, and Endpoints.