
Technical Services
Trust at the Heart of Collaboration at LTM
LTM reimagined work by building trust into every meeting. With Cisco, collaboration became effortless, human-first, and inspiring.

Sports, Media, and Entertainment
A Smarter Gillette Stadium Performs in the Clutch
The Kraft Group, with a family of businesses including the New England Patriots and New England Revolution, ensures seamless operations and winning experiences for fans and broadcast teams on game days, at concerts and more.
AIDA Cruises
AIDA ensures 24/7 connectivity for customers and crew.
Solution: Cisco Catalyst Switches, Cisco Catalyst Wi-Fi 6E Access Points, Cisco Catalyst Center, Cisco Services, Cisco Spaces
AMD Anonymized
A modern server platform improves EHR performance and creates a future-proofed workplace.
Solution: Cisco UCS X-Series Modular System with Cisco Intersight, AMD EPYC™ processors, Cisco Application-Centric Infrastructure, Cisco Nexus 9000 Series switches

Adelaide Oval SMA Ltd
Cisco technology helped convert a historic facility into a world-class multi-use precinct.
Solution: Cisco Networking Solutions, Cisco Catalyst Center, Cisco Security, Wipro VisionEDGE
Admiral Insurance
Admiral Insurance uses AppDynamics and ThousandEyes to improve digital experiences for nine million.
Solution: Cisco ThousandEyes, Cisco AppDynamics

Admiral Solutions
Admiral India revamped its network to overcome manual processes and improve operational efficiency.
Solution: Cisco Catalyst Center, Cisco Catalyst Gear, Cisco Identity Services Engine (ISE)

Advanced UniByte GmbH
Advanced UniByte engineers strengthened teamwork while pursuing CCIE and Cisco Gold status.
Solution: Not Specified
Alcoa
Alcoa optimizes port operations with resilient wireless for autonomous systems.
Solution: Cisco Ultra-Reliable Wireless Backhaul, Cisco Catalyst IW9167E
American University in Cairo
The American University in Cairo (AUC) champions a future-proofed transformation.
Solution: Catalyst switches, NetScout, Cisco ACI, Cisco ThousandEyes, Splunk AppDynamics
Anonymous (Federal organization)
A federal organization improves security by deploying the latest Cisco Secure Firewall technology.
Solution: Cisco Secure Firewall 3105, Cisco Secure Firewall Threat Defense (FTD), Cisco Secure Firewall Threat Defense Virtual (FTDv), Cisco Secure Firewall Management Center (FMC), Cisco Secure Firewall Migration Tool (FMT)

Arelion Sweden AB
Arelion transforms customer experiences with transparency and operational excellence.
Solution: Cisco 8000 Series Routers, Cisco Agile Services Networking, Cisco Provider Connectivity Assurance, Cisco Crosswork Network Automation, Cisco coherent optics
Audi
Designing the future of manufacturing with a unified, secure, automated, and fault-tolerant network foundation for continuous, high-precision operations.
Solutions: Cisco Catalyst Center, Software-Defined Access (SDA), Cisco Catalyst 9000 switching family, Cisco Industrial Ethernet switches, Cisco Identity Services Engine (ISE)
Audi (German)
Audi läutet mit seinem Design die Zukunft der Automobilbranche ein – mit einer einheitlichen, sicheren, automatisierten und fehlertoleranten Netzwerkgrundlage für unterbrechungsfreie, äußerst präzise Betriebsabläufe.
Lösungen: Cisco Catalyst Center, Software-Defined Access (SDA), Switches der Cisco Catalyst 9000-Produktreihe, Cisco Industrial Ethernet-Switches, Cisco Identity Services Engine (ISE)
BBVA
Argentine bank establishes a new standard for software-defined networking across global locations.
Solution: Cisco SD-Access, Cisco Catalyst Center, Cisco Catalyst SD-WAN, Cisco ISE, Cisco ACI
BT Group
BT provides communications and connectivity services to UK businesses and the public sector.
Solution: Cisco Application Centric Infrastructure (Cisco ACI), Cisco Duo, Cisco Identity Services Engine (Cisco ISE), Cisco Common Services Platform Collector (Cisco CSPC)
Banco do Brasil
Software-defined networking improves leading bank’s agility, sustainability, and security.
Solution: Cisco ACI, Cisco N9000 Series Switches, Cisco Nexus Dashboard, Cisco Services
Banco do Brasil (Portuguese)
Redes definidas por software melhoram agilidade, sustentabilidade e segurança de um banco.
Solution: Cisco ACI, Cisco N9000 Series Switches, Cisco Nexus Dashboard, Cisco Services

Barts Health NHS Trust
Barts Health NHS Trust delivers healthcare to 2.5 million people.
Solution: Cisco Software-Defined Access (SDA), Cisco ThousandEyes, Cisco Secure Firewall
Bayside Health Peninsula
From empty building to living hospital. Bayside Health Peninsula and Cisco created a model for the future of digital healthcare.
Solution: Cisco Catalyst Center, Cisco Software-Defined Access, Cisco Nexus, Cisco UCS, Cisco FlashStack
BestPath
BestPath simplifies data center operations with cloud-managed fabrics and automation.
Solution: Cisco Nexus Hyperfabric, Cisco Application-Centric Infrastructure, Cisco Nexus 9000 Series switches, Cisco Meraki MS switches
Beutlhauser
Beutlhauser drives global efficiency with Cisco’s unified networking and security solutions.
Solution: Cisco Meraki, Webex, Cisco Umbrella, Cisco Identity Services Engine (ISE), Cisco Secure Client

Birla Opus Paints
Birla Opus Paints built six new factories with one digital backbone.
Solution: Cisco CPwE Arhitecture, Cisco Industrial Ethernet, Cisco Meraki, Cisco Firepower, Cisco Zero Trust
Bouygues Telecom
Addressing network blind spots and working to meet SLAs.
Solution: Cisco Provider Connectivity Assurance, Provider Connectivity Assurance Sensors, Provider Connectivity Assurance analytics
Bouygues Telecom
Two times network capacity at minimum cost.
Solution: Cisco Nexus 9000 Series switches, Cisco Enhanced Policy-Based Routing
Brentwood College
Rowing heritage meets global connection
Solution: Cisco Ultra-Reliable Wireless Backhaul (URWB), Meraki Access Points
Buckinghamshire Council
Combined network allows collaboration across key Buckinghamshire public sector providers.
Solution: Cisco Software-Defined Access, Cisco Software-Defined Wide Area Network, Cisco VPN technology

Buckinghamshire Council (English-UK)
Combined network allows collaboration across key Buckinghamshire public sector providers.
Solution: Cisco Software-Defined Access, Cisco Software-Defined Wide Area Network, Cisco VPN technology
CBMM
Companhia Brasileira de Metalurgia e Mineração (CBMM) is the world’s leading producer of niobium.
Solution: Cisco UCS X-Series Modular System with Cisco Intersight, Cisco UCS X-Series Direct, Cisco Compute Hyperconverged with Nutanix, Cisco Application-Centric Infrastructure
CILE
Building a network of sensors to serve the community.
Solution: Cisco Umbrella Secure Web Gateway (SWG), Cisco Wireless Gateway for LoRaWAN

CPFL Energia – SP
Brazil’s second-largest energy supplier, CPFL Energia, provides power generation and distribution.
Solution: Cisco Cyber Vision, Cisco Secure Firewall, Cisco Catalyst IE3400 Rugged Series
Canberra Institute of Technology
Canberra Institute of Technology redefines hybrid education by breaking down barriers to learning.
Solution: Webex Suite, Webex AI, Cisco Devices, Cisco Catalyst Switches, Wifi Solutions
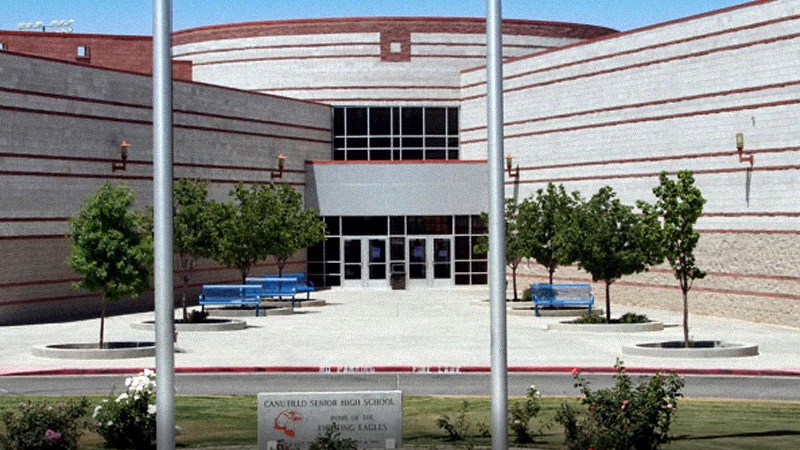
Canutillo Independent School District
Canutillo ISD created a blueprint to bring internet access to its students
Solution: Cisco Ultra-Reliable Wireless Backhaul, Cisco Industrial Ethernet Switches, Cisco Meraki Outdoor Access Points
Carhartt
Carhartt is a global premium workwear brand with a rich heritage of developing rugged products.
Solution: Cisco Full-Stack Observability, Cisco Customer Digital Experience Monitoring, Cisco AppDynamics, Cisco ThousandEyes
Carhartt (Chinese)
Carhartt is a global premium workwear brand with a rich heritage of developing rugged products.
Solution: Cisco Full-Stack Observability, Cisco Customer Digital Experience Monitoring, Cisco AppDynamics, Cisco ThousandEyes
Carhartt (English-Australian)
Carhartt is a global premium workwear brand with a rich heritage of developing rugged products.
Solution: Cisco Full-Stack Observability, Cisco Customer Digital Experience Monitoring, Cisco AppDynamics, Cisco ThousandEyes
Carhartt (English-Canadian)
Carhartt is a global premium workwear brand with a rich heritage of developing rugged products.
Solution: Cisco Full-Stack Observability, Cisco Customer Digital Experience Monitoring, Cisco AppDynamics, Cisco ThousandEyes
Carhartt (English-UK)
Carhartt is a global premium workwear brand with a rich heritage of developing rugged products.
Solution: Cisco Full-Stack Observability, Cisco Customer Digital Experience Monitoring, Cisco AppDynamics, Cisco ThousandEyes
Carhartt (French)
Carhartt is a global premium workwear brand with a rich heritage of developing rugged products.
Solution: Cisco Full-Stack Observability, Cisco Customer Digital Experience Monitoring, Cisco AppDynamics, Cisco ThousandEyes
Carhartt (French-Canadian)
Carhartt is a global premium workwear brand with a rich heritage of developing rugged products.
Solution: Cisco Full-Stack Observability, Cisco Customer Digital Experience Monitoring, Cisco AppDynamics, Cisco ThousandEyes
Carhartt (German)
Carhartt is a global premium workwear brand with a rich heritage of developing rugged products.
Solution: Cisco Full-Stack Observability, Cisco Customer Digital Experience Monitoring, Cisco AppDynamics, Cisco ThousandEyes
Carhartt (Japanese)
Carhartt is a global premium workwear brand with a rich heritage of developing rugged products.
Solution: Cisco Full-Stack Observability, Cisco Customer Digital Experience Monitoring, Cisco AppDynamics, Cisco ThousandEyes
Central Data Systems Pvt. Ltd
CDS enhances security, streamlines operations, and empowers teams to stay ahead of evolving threats.
Solution: Secure Firewall, Cisco Firepower Management Center, Cisco AIOps & AI Assistant for Security
Cincinnati Open
How a lean IT team leverages cloud-managed networking to elevate fan, player, and media experiences.
Solution: Cisco wireless access points, Cisco cloud-managed network platform, Catalyst 9300-M switches, Cisco AgenticOps, Cisco AI-Enhanced Radio Resource Management (AI-RRM)

City of El Paso
Helping residents in crisis get real-time assistance with a one-stop digital experience.
Solution: Webex Meetings, Webex Calling, Cisco Catalyst 9300 Series Switches, VOPS (Virtual Office for Public Services) by SWS
City of Fort Worth
The City of Fort Worth provides public Wi-Fi to underconnected neighborhoods.
Solution: Cisco Ultra-Reliable Wireless Backhaul (Cisco URWB), Cisco Catalyst IE3300 Rugged Series switches, Cisco Meraki MR86 access points, Cisco Umbrella web content filtering
Clarke County Hospital
Clarke County Hospital lights up a bright future.
Solution: Cisco Catalyst Switches
Cluster Power
Establishing a new, more sustainable business model.
Solution: Cisco UCS X-Series, Cisco Application Centric Infrastructure (Cisco ACI), Cisco Intersight
Colt Technology Services Group Limited
Meeting the surge in demand for smart networks.
Solution: Cisco Routed Optical Networking, Cisco Provider Connectivity Assurance, Cisco Crosswork Network Automation, Cisco Silicon One
DP World
Enhancing DP World’s mission-critical operations by reimagining infrastructure.
Solution: Cisco Software-Defined Access, Cisco Catalyst Center, Cisco Ultra-Reliable Wireless Backhaul, Cisco Catalyst Industrial Ethernet Switches
DP World Evyap
DP World Evyap Körfez network upgrade sets new standards in efficiency and automation.
Solution: Cisco Ultra-Reliable Wireless Backhaul
Dakota State University (DSU)
Accelerating the future of cyber, everywhere.
Solution: Cisco UCS X-Series, Cisco Intersight, Nexus 9000 Series Switches, Cisco Application Centric Infrastructure (Cisco ACI), Cisco Umbrella Secure Web Gateway
Decathlon
The world's largest sports retailer enhances network visibility, security, and automation.
Solution: Meraki dashboard, Cisco Meraki MS switches, Cisco Meraki MX security and SD-WAN, Cisco wireless access points, Cisco Meraki APIs
Distinctive Resorts
Distinctive Resorts is a hotel management company with resorts on the California coast.
Solution: Meraki dashboard, Meraki Vision portal, Cisco Meraki MV smart cameras, Cisco Meraki MT sensors, Meraki MR wireless access points
Elon University
Elon University effectively minimizes network downtime and data loss through a platform-centric approach.
Solution: Cisco Extended Detection and Response (XDR), Cisco Secure Cloud Analytics (SCA), Cisco Secure Endpoint, Cisco Umbrella, Cisco Identity Services Engine (ISE)
Engel
Engel tightens its partnership with Cisco as it embraces a global security managed service.
Solution: Cisco Identity Services Engine, Cisco Secure Firewall, Cisco AnyConnect, Cisco Umbrella, Cisco Secure Endpoint with Talos Threat Hunting
FLAME University
Flame University transforms into one of India’s most connected campuses achieving 99.9% uptime.
Solution: Cisco Meraki MR Series Access Points, Cisco Meraki MX Security, Cisco Meraki Cloud-Managed Switches
Fiserv
Global fintech and payments company with solutions for banking.
Solution: Cisco Professional Services, Cisco Catalyst Center , Cisco Splunk, Cisco Thousand Eyes
Flinders University
Flinders' Tonsley campus is an innovation hub for research, entrepreneurs, and future employers.
Solution: Webex by Cisco devices, Cisco Secure Firewall, Cisco Meraki MX security and SD-WAN appliances, Cisco Meraki MV smart cameras
France TV
France TV upgraded its legacy broadcast production network to be simpler and versatile.
Solution: Cisco IP Fabric for Media, Cisco Nexus Dashboard Fabric Controller, Cisco Nexus 9000 Series Switches
Geographic Solutions, Inc.
Essential support and resources for the U.S. workforce.
Solution: Cisco UCS X-Series, Cisco Intersight, Nexus 9000 Series Switches
George Sink PA Injury Lawyers
Legal firm elevates security measures to deliver timely and reliable client support.
Solution: Cisco Extended Detection and Response (Cisco XDR), Cisco Secure Endpoint, Cisco Duo
Gifu University Hospital (Japanese)
Gifu University Hospital provides high-quality medical care and trains future professionals.
Solution: Cisco Secure Client, Cisco Secure Firewall, Cisco Duo
Global Financial Services Provider
Global financial service provider streamlines data center operations to enable new levels of business agility.
Solution: Cisco ACI

Het Facilitair Bedrijf - Vlaamse overheid
Flemish government IT supports 30,000 users and 40,000 devices across 200 government sites.
Solution: Cisco Catalyst Center, Cisco Catalyst switches, Cisco Catalyst Wireless, Cisco Secure Firewall, Cisco SD-Access
Hitachi, LTD. (Japanese)
Hitachi, Ltd. introduces SASE for zero-trust implementation.
Solution: Cisco Umbrella, Cisco Duo
Hokuriku Computer Service Co. Ltd. (Japanese)
Hokuriku Computer Service provides one-stop ICT services from consulting to system operation.
Solution: Cisco Duo, Cisco Secure Network Analytics, Cisco SecureX
IPCONSUL
Remote Canadian maple syrup farm offers insights into impact of industrial IoT.
Solution: Cisco Converged Plantwide Ethernet (CPwE), Cisco Secure Equipment Access, Cisco Catalyst IE3400 Rugged Series Switches, Cisco Catalyst IR1101 Rugged Series Routers
IPCONSUL (French)
L’expérience d’une érablière canadienne en région éloignée aide à mieux comprendre l’incidence de l’IDO industriel.
Solution: Cisco Converged Plantwide Ethernet (CPwE), Cisco Secure Equipment Access, Cisco Catalyst IE3400 Rugged Series Switches, Cisco Catalyst IR1101 Rugged Series Routers
IndiQube
IndiQube built a digital-first workspace foundation that empowers startups to scale across India.
Solution: Cisco Meraki, Cisco Collaboration, Scalable architecture, Built-in security
Indosat Ooredoo Hutchison
Indosat Ooredoo Hutchison offers a wide range of services connecting people, businesses, and communities.
Solution: Cisco Security Services
International Christian School (Korean)
Uijeongbu International Christian School provides education to help students grow healthily.
Solution: Cisco Meraki dashboard, Cisco Meraki MS switches, Cisco Meraki MR access points, Cisco Meraki MX security and SD-WAN appliances
Interstellar Technologies Inc. (Japanese)
Interstellar Technologies handles confidential information developing rockets and satellites.
Solution: Cisco Meraki MX, Cisco Secure Connect
Jammu & Kashmir Bank Limited
J&K Bank's cybersecurity reinvention with Cisco for resilience.
Solution: Cisco Intersight, Cisco Secure Web, Cisco Application Centric Infrastructure (Cisco ACI)

Joris Zorg
Secure connected healthcare enables independent living.
Solution: Cisco Meraki platform, Cisco XDR, Cisco Secure Access, Cisco Talos
Kamstrup
Kamstrup uses Cisco SD-WAN and Cisco ThousandEyes for enhanced visibility.
Solution: Cisco Catalyst 8000 Edge Platforms, Cisco SD-WAN, Cisco ThousandEyes
Kistler Weigh In Motion
Detecting and removing overweight trucks helps make roadways safer.
Solution: Cisco Catalyst IE9300 Rugged Series switches
Klinikum Neumarkt (German)
Neumarkt Hospital relies on Cisco for secure and efficient network management.
Solution: Cisco Meraki, Cisco Catalyst, Cisco Identity Services Engine

Korea Zinc (Korean)
Korea Zinc is a global leader in non-ferrous metals, transforming into a green solution partner.
Solution: Cisco Software-Defined Access, Cisco Catalyst Center, Cisco ThousandEyes, Cisco Identity Services Engine

LTIMindtree
LTIMindtree reimagined work by building trust into every meeting.
Solution: Cisco Devices, Cisco Webex Control Hub, Cisco RoomOS, Webex AI, Cloud Calling
LTM
AI-powered secure access, visibility, and collaboration enhance hybrid work for 87,000+ employees.
Solution: Cisco Secure Access, Cisco ThousandEyes, Cisco Catalyst Center, Cisco Webex Control Hub, Cisco AI Assistant

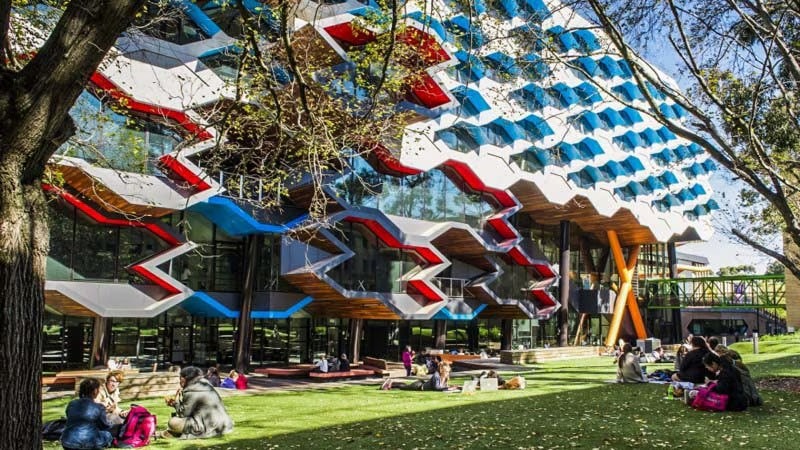
La Trobe University
La Trobe University's digital network enables students to communicate seamlessly from anywhere.
Solution: Enterprise networking, Data Center Solutions, Security hardware, Webex by Cisco
Labconco
Labconco improves the protection of its critical assets.
Solution: Cisco Secure Firewall, Cisco Secure Endpoint, Cisco Umbrella, Cisco Duo
Liebherr-International AG (English-UK)
Liebherr is a global group with an extensive portfolio of construction and household equipment.
Solution: Cisco Catalyst IE3400 Rugged Series switches, Cisco Catalyst 9000 switches
Liebherr-International AG (French)
Liebherr is a global group with an extensive portfolio of construction and household equipment.
Solution: Cisco Catalyst IE3400 Rugged Series switches, Cisco Catalyst 9000 switches
Live Nation Entertainment
Live Nation turns up the volume on festival experiences.
Solution: Cisco Wireless, Cisco Spaces, Cisco Meraki MV cameras, Splunk, Cisco Catalyst Center
Lohia Group
Lohia Corp overcomes connectivity challenges.
Solution: Cisco Webex, Webex Calling Apps

Lumen Technologies
As the trusted network for AI, Lumen provides metro connectivity and long-haul data transport.
Solution: Cisco QSFP-DD 400G ZR/ZR+ coherent pluggable optics, Cisco 8200 Series, Cisco Network Convergence System 5700 Series, Cisco Network Convergence System (NCS) 1001
Mansfield Independent School District
School district gains better visibility and correlation with a unified security solution.
Solution: Cisco Extended Detection and Response (Cisco XDR), Cisco Security Services
Marriott International
Cisco and Marriott have partnered with the Internet Watch Foundation (IWF) to block CSAM access.
Solution: Cisco Umbrella
Maruti Suzuki India Ltd.
Maruti Suzuki is India's leading automaker, revolutionizing the market with 16 diverse car models.
Solution: Webex by Cisco

Melbourne Cricket Club
Transforming one of the world’s oldest stadiums into one of the most digitally enabled.
Solution: Cisco Catalyst Center, Cisco Software-Defined Access, Cisco Nexus Dashboard
Milwaukee Electronics Corporation
Milwaukee Electronics chose a unified SASE solution to improve security and reduce network outages.
Solution: Cisco Secure Connect, Meraki dashboard, Cisco Meraki MR access points, Cisco Meraki MS switches

Ministry of Defence UK
Digital transformation is helping the UK Army outcompete its adversaries and improve operational efficiency.
Solution: Cisco Catalyst Centre, Catalyst Access Points, Catalyst Series Switches, Cisco Spaces, Meraki switches
Mitchells & Butlers Leisure Retail Limited
Mitchells & Butlers is one of the largest UK operators of restaurants, pubs, and bars.
Solution: Cisco Secure Connect, The Meraki dashboard, Cisco Meraki MR wireless access points, Cisco Meraki MS switches, Cisco Meraki MX security and SD-WAN
Mitsubishi Estate・Simon Co.,Ltd. (Japanese)
Building a foundation for high-quality customer experiences and future marketing initiatives.
Solution: Cisco Meraki MR, Meraki Dashboard
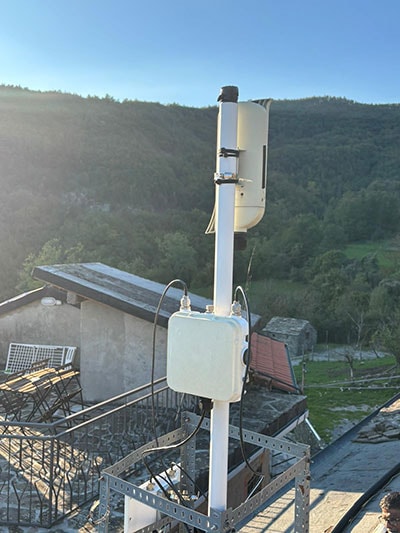
Montagna Verde
Montagna Verde uses wireless backhaul for reliable connectivity and better guest experiences.
Solution: Cisco Ultra-Reliable Wireless Backhaul (URWB), Cisco Wireless and Meraki Access Points, Cisco Industrial Ethernet Switches
MyInvestor
Simplifying security for greater agility and efficiency.
Solution: Cisco Multicloud Defense

NCS Pte Ltd
Network automation and improved network agility.
Solution: Cisco SD-WAN

NEP Group
The new broadcasting paradigm.
Solution: Cisco IP Fabric for Media, Cisco Nexus 9000 Series Switches

NTT DATA, Inc
Cisco helps NTT DATA evolve the modern office through sustainability, innovation, and collaboration.
Solution: Meraki dashboard, Cisco Meraki MR access points, Cisco Meraki MS switches, Cisco Meraki MV smart cameras
NatWest
NatWest Group is a leading banking and financial services group in the U.K. and Ireland.
Solution: Cisco Customer Recycling Solutions, Cisco Takeback and Reuse Program
Nestle
Nestlé leads as the world’s largest food and beverage company.
Solution: Cisco SD-WAN, Cisco ThousandEyes, Cisco Secure Routers

Newgen Software
Winning against data vulnerabilities and cyberattacks.
Solution: Cisco Secure Endpoint, Cisco XDR

Noida Power Company Limited
NPCL distributes power in Greater Noida, a city in Uttar Pradesh northern India, to over 150,000 customers.
Solution: Cisco Intersight
Nutrien
Nutrien is a leading provider of crop inputs and services that help growers increase food production.
Solution: Cisco Wireless, Cisco switching, Cisco Ultra-Reliable Wireless Backhaul, Cisco Identity Services Engine (ISE), Cisco Spaces
Ontario Clean Water Agency
Innovating to deliver clean safe water.
Solution: Cisco Industrial Routers, Cisco IOx
Osaka General Medical Center (Japanese)
Osaka Acute Care and General Medical Center provides high-quality medical care and emergency services.
Solution: Cisco Secure Network Analytics, Cisco XDR
PTC
PTC's AI-driven Servigistics software helps the world's largest companies make millions of decisions each day.
Solution: FlexPod, Cisco UCS X-Series, Cisco Intersight, Cisco Application Centric Infrastructure (ACI)
Paris Olympics (Olympic Committee)
A record number of broadcast media will rely on seamless connectivity to tell their stories to the world.
Solution: Cisco Spaces, Cisco Catalyst IR1800 Rugged Series Routers
Phuong Dong Hospital
When a doctor needs it, the system must be ready.
Solution: Cisco Meraki Dashboard, Cisco Meraki MR Wireless Access Points, Cisco Meraki MS Switches, Cisco Meraki MX Security and SD-WAN appliances
Planet Farms
Planet Farms is aiming to transform the way fresh vegetables are grown, sold, and distributed.
Solution: Cisco Ultra-Reliable Wireless Backhaul (URWB)
Proactive Data Systems Pvt. Ltd.
Proactive Data Systems (PDS) enhances security and streamlines operations.
Solution: Cisco Secure Firewall, Meraki MX, Cisco Duo, Cisco Email Threat Defense, Cisco AI Assistant
Reist
Cisco UCS X-Series and Red Hat OpenShift help a leading Swiss service provider innovate faster.
Solution: Cisco UCS X-Series Modular System with Cisco Intersight, Cisco Nexus 9000 Series switches
Reliance Jio
Cutting-edge technologies from Cisco drive end-to-end converged IP networking.
Solution: Cisco Agile Services Networking, Cisco 8000 Series Routers, Cisco Cloud-Native Broadband Network Gateway (cnBNG), Cisco Routed Optical Networking, Cisco Crosswork Network Automation

Room & Board
Room & Board ensures great customer service everywhere with Cisco solutions.
Solution: Cisco Catalyst SD-WAN, Cisco Umbrella, Cisco Meraki MX security and SD-WAN appliances, Cisco Meraki MR access points
Rosen Hotels & Resorts
Total network visibility starts here.
Solution: Cisco Umbrella, Cisco Secure Firewall, Cisco Secure Email Threat Defense, Cisco Duo

Royal Caribbean Cruise Lines
Royal Caribbean leverages Cisco FSO to ensure seamless guest experiences and digital performance.
Solution: Cisco Full-Stack Observability, Cisco AppDynamics, Cisco ThousandEyes
Royal Caribbean Cruise Lines (Chinese)
Royal Caribbean leverages Cisco FSO to ensure seamless guest experiences and digital performance.
Solution: Cisco Full-Stack Observability, Cisco AppDynamics, Cisco ThousandEyes
Royal Caribbean Cruise Lines (English-UK)
Royal Caribbean leverages Cisco FSO to ensure seamless guest experiences and digital performance.
Solution: Cisco Full-Stack Observability, Cisco AppDynamics, Cisco ThousandEyes
Royal Caribbean Cruise Lines (French)
Royal Caribbean leverages Cisco FSO to ensure seamless guest experiences and digital performance.
Solution: Cisco Full-Stack Observability, Cisco AppDynamics, Cisco ThousandEyes
Royal Caribbean Cruise Lines (French-Canadian)
Royal Caribbean leverages Cisco FSO to ensure seamless guest experiences and digital performance.
Solution: Cisco Full-Stack Observability, Cisco AppDynamics, Cisco ThousandEyes
Royal Caribbean Cruise Lines (German)
Royal Caribbean leverages Cisco FSO to ensure seamless guest experiences and digital performance.
Solution: Cisco Full-Stack Observability, Cisco AppDynamics, Cisco ThousandEyes
Royal Caribbean Cruise Lines (Japanese)
Royal Caribbean leverages Cisco FSO to ensure seamless guest experiences and digital performance.
Solution: Cisco Full-Stack Observability, Cisco AppDynamics, Cisco ThousandEyes
Royal College of Surgeons in Ireland
Royal College of Surgeons in Ireland confidently expands security with Cisco Hybrid Mesh Firewall.
Solution: Cisco Secure Firewall 4215, Cisco Multicloud Defense, Cisco Security Cloud Control, Cisco Umbrella, Cisco AnyConnect
Rush University System for Health
Rush University System for Health advanced Zero Trust with Cisco Hybrid Mesh Firewall solutions.
Solution: Cisco Secure Firewall 4200 Series, Cisco Secure Workload, Cisco Identity Services Engine (ISE), Cisco Secure Network Analytics

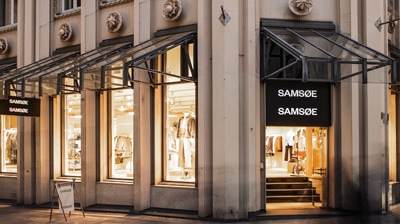
SAMSØE SAMSØE
Copenhagen clothier’s rapid growth is styled on cutting-edge wireless and in-store innovation.
Solution: Cisco Wi-Fi 7 access points, Meraki dashboard, Cisco Spaces, Cisco Meraki MV Smart Cameras, Cisco Security Suite
SEW Usocome
SEW boosts factory automation with Cisco's unified Wi-Fi and URWB for seamless, reliable operations.
Solution: Cisco URWB

SPAR ICS
SPAR ICS unified retail operations across 3500 stores with cloud managed networking.
Solution: Cisco Meraki dashboard, Cisco wireless access points, Cisco Meraki MS switches, Cisco Meraki MX security and SD-WAN appliances

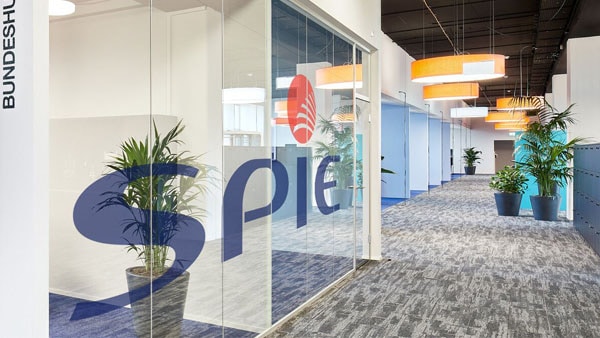
SPIE (French)
SPIE Switzerland collaborates with Cisco to showcase a workplace of the future.
Solution: Webex by Cisco, Cisco Board Pro, Webex App, Cisco Umbrella
SPIE (French-Canadian)
SPIE Switzerland collaborates with Cisco to showcase a workplace of the future.
Solution: Webex by Cisco, Cisco Board Pro, Webex App, Cisco Umbrella
SPIE (German)
SPIE Switzerland collaborates with Cisco to showcase a workplace of the future.
Solution: Webex by Cisco, Cisco Board Pro, Webex App, Cisco Umbrella
Saudi Telecom Company
Saudi Telecom Company (stc), leads national and regional digital transformation with innovative Information.
Solution: Cisco Provider Connectivity Assurance, Cisco ThousandEyes Assurance, Cisco 8000 Series Routers, Cisco Silicon One, Cisco Crosswork Network Automation
ScottishPower Renewables
ScottishPower Renewables created a blueprint with Cisco for offshore wind farm connectivity.
Solution: Cisco Validated Designs for Power Utilities, Cisco Ultra-Reliable Wireless Backhaul, Cisco Industrial Routers, Cisco Industrial Ethernet switches
Silks Place Tainan
Reimagining a more sustainable future for hospitality.
Solution: Cisco Green Pay

Silverstream Technologies
To keep pace with rapid expansion and strict security standards, Silverstream modernised its infrastructure with Cisco Meraki and Webex.
Solution: The Meraki dashboard, Meraki MS switches, Meraki MX security and SD-WAN appliances, Cisco wireless access points, Meraki MV smart cameras

SmartCap
South African truck parts maker SmartCap launches fully automated Texas manufacturing facility.
Solution: Meraki Dashboard,Cisco Meraki MR wireless access points, Cisco Meraki MS Series Switches, Cisco Meraki MX security and SD-WAN, Cisco Meraki MV smart cameras
SoFi / Hollywood Park
Cisco networking enhanced the experience for fans and visitors at SoFi Stadium.
Solution: Cisco Nexus 9000 Series switches, Cisco Catalyst 9690 switches, Cisco Vision Dynamic Signage
SoftCat
Softcat embraced ThousandEyes, and the team quickly achieved a new level of visibility with intuitive dashboards.
Solution: Cisco ThousandEyes

South Australian Jockey Club
South Australian Jockey Club transformed its venue to secure its legacy as a premier destination.
Solution: Cisco Meraki dashboard, Cisco Meraki MR wireless access points, Cisco Meraki MS switches
Spark New Zealand
Discover how Spark ignited a new era in IoT empowering customers with control and innovation.
Solution: Cisco Mobility Services Platform, Cisco IoT Control Center
State of Hawaii
Streamlining operations to gain greater efficiency and security helps the Aloha state meet citizen demands.
Solution: Cisco Hyperconverged Infrastructure (HCI), Cisco Identity Services Engine (ISE), Cisco Catalyst Center
State of Indiana Office of Technology (IOT)
Indiana Office of Technology improves critical services to citizens with end-to-end visibility.
Solution: Cisco Full-Stack Observability (FSO), Cisco AppDynamics, Cisco Secure Application, Cisco ThousandEyes
State of Indiana Office of Technology (IOT) (English-Canadian)
Indiana Office of Technology improves critical services to citizens with end-to-end visibility.
Solution: Cisco Full-Stack Observability (FSO), Cisco AppDynamics, Cisco Secure Application, Cisco ThousandEyes
State of Indiana Office of Technology (IOT) (English-UK)
Indiana Office of Technology improves critical services to citizens with end-to-end visibility.
Solution: Cisco Full-Stack Observability (FSO), Cisco AppDynamics, Cisco Secure Application, Cisco ThousandEyes
State of Indiana Office of Technology (IOT) (French)
Indiana Office of Technology improves critical services to citizens with end-to-end visibility.
Solution: Cisco Full-Stack Observability (FSO), Cisco AppDynamics, Cisco Secure Application, Cisco ThousandEyes
State of Indiana Office of Technology (IOT) (French-Canadian)
Indiana Office of Technology improves critical services to citizens with end-to-end visibility.
Solution: Cisco Full-Stack Observability (FSO), Cisco AppDynamics, Cisco Secure Application, Cisco ThousandEyes
State of Indiana Office of Technology (IOT) (German)
Indiana Office of Technology improves critical services to citizens with end-to-end visibility.
Solution: Cisco Full-Stack Observability (FSO), Cisco AppDynamics, Cisco Secure Application, Cisco ThousandEyes
Swisscom
Swisscom is Switzerland’s leading ICT company offeingr mobile, internet, and TV.
Solution: Cisco 8000 Series Routers, Cisco ASR 9903/9902, Cisco NCS 540, Cisco Crosswork Network Automation, Cisco Routed Optical Networking
Tech Mahindra Limited
Tech Mahindra reimagines network operations to deliver agility across 32 branches and 6 hubs.
Solution: Cisco Software-Defined WAN (SD-WAN), Cisco Catalyst Switches
Texas Education Service Center, Region 17
Cisco Security Cloud Control simplifies security management for ESC-17 across 57 school districts.
Solution: Cisco Security Cloud Control. Cisco Secure Firewall, Cisco AI Assistant for Security
The Kraft Group
The Kraft Group simplifies delivery of its broadcast capabilities at Gillette Stadium and beyond.
Solution: Cisco IP Fabric for Media, Cisco Nexus 9000 Series switches, Cisco Nexus Dashboard, Cisco Secure Firewall, Cisco Services
The Supreme Industries Limited
Supreme Industries enhances connectivity and visibility while keeping scalability goals in mind.
Solution: Cisco Meraki MS switches, Cisco Firepower 1010 NGFW Appliance, Cisco Meraki Wireless, Ultra-Reliable Wireless Backhaul

The University of the South Pacific
The University of the South Pacific modernized their hybrid security.
Solution: Cisco Security Cloud Control, Cisco AI Assistant, Cisco Secure Firewall 3140, Cisco Identity Services Engine (ISE)
Time of India Group
Bennett, Coleman & Co. Ltd. (BCCL) tackled network challenges to embrace digital agility and fortify security.
Solution: Cisco Catalyst Switches, Cisco Catalyst Center, Cisco Identity Services Engine (ISE)
Tripadvisor
Tripadvisor’s Strategy for Future-Proofed Workplaces.
Solution: Cisco Collaboration Devices, Cisco Spaces, Cisco Networking
Turkcell
Zero-touch network powers digital flexibility.
Solution: Cisco Customer Experience (CX), Cisco Application Centric Infrastructure (ACI), Cisco Nexus 9000 Series Switches, Cisco Network Services Orchestrator (NSO)
Unilin Group
Unilin is leveraging Cisco technology to gain full visibility into their industrial networks.
Solution: Cisco Cyber Vision, Cisco Identity Services Engine, Cisco Catalyst Center, Cisco Catalyst Industrial Ethernet switches
United States Golf Association (USGA)
Cisco technology improves network reliability and performance at USGA golf championships.
Solution: Cisco Secure Firewall, Cisco Umbrella DNS, Cisco Secure Client, Cisco Duo
University Hospital Frankfurt
Discover how one of Germany's leading university clinics improved patient care.
Solution: Cisco campus switching, Cisco Spaces
University of Copenhagen
Copenhagen University (KU) investment in the latest digital ideas will secure a promising future.
Solution: Cisco Catalyst Center, Cisco Catalyst 9000, Cisco Secure Network Analytics, Cisco Identity Services Engine (ISE)
University of Western Australia
Building UWA’s future-ready digital infrastructure.
Solution: Cisco Catalyst Center, Cisco Software-Defined Access, Cisco Spaces
University of Wollongong (UOW)
Elevating the learning experience via integration and interoperability of platforms, systems, and audiovisual spaces.
Solution: Webex Suite, Cisco Room Devices, Cisco Control Hub

Universitätsmedizin Frankfurt (German)
Entdecken Sie, wie eine der führenden Universitätskliniken Deutschlands die Patientenversorgung verbessert hat.
Solution: Cisco campus switching, Cisco Spaces
VaynerX
VaynerX Builds the wireless foundation for modern work.
Solution: Meraki dashboard, Cisco wireless access points, Meraki MS switches, Meraki MX SD-WAN
Vodafone Italy (Chinese)
Vodafone is a leading telecom company providing mobile and fixed services to 300 million customers.
Solution: Cisco Full-Stack Observability, Cisco AppDynamics, Cisco Cloud Observability, Cisco Professional Services
Vodafone Italy (English-Australian)
Vodafone is a leading telecom company providing mobile and fixed services to 300 million customers.
Solution: Cisco Full-Stack Observability, Cisco AppDynamics, Cisco Cloud Observability, Cisco Professional Services
Vodafone Italy (English-UK)
Vodafone is a leading telecom company providing mobile and fixed services to 300 million customers.
Solution: Cisco Full-Stack Observability, Cisco AppDynamics, Cisco Cloud Observability, Cisco Professional Services
Vodafone Italy (French)
Vodafone is a leading telecom company providing mobile and fixed services to 300 million customers.
Solution: Cisco Full-Stack Observability, Cisco AppDynamics, Cisco Cloud Observability, Cisco Professional Services
Vodafone Italy (French-Canadian)
Vodafone is a leading telecom company providing mobile and fixed services to 300 million customers.
Solution: Cisco Full-Stack Observability, Cisco AppDynamics, Cisco Cloud Observability, Cisco Professional Services
Vodafone Italy (German)
Vodafone is a leading telecom company providing mobile and fixed services to 300 million customers.
Solution: Cisco Full-Stack Observability, Cisco AppDynamics, Cisco Cloud Observability, Cisco Professional Services
Vulcan
Vulcan transformed its legacy network into one that is secure and scalable.
Solution: Cisco Meraki Dashboard, Cisco Meraki MR wireless access points, Cisco Meraki MS switches, Cisco Meraki MX security, SD-WAN appliances
WWE Corp.
WWE delivers faster and more efficient broadcasts from its venues to viewers worldwide.
Solution: Cisco Nexus 9000 Series Switches, Cisco Nexus Dashboard, Cisco ThousandEyes
Wepa Hygieneprodukte GmbH (German)
The WEPA Group offers sustainable and innovative hygiene solutions for millions across Europe.
Solution: Meraki MS Switches, Meraki MR Wi-Fi Access Points, Meraki MV Cameras
West Ada School District
A nimble West Ada School District IT department provides consistent wireless access to 40,000 students.
Solution: Cisco Meraki dashboard, Cisco Meraki MS switches, Cisco Meraki MR series access points, Cisco ThousandEyes
West Ada School District (English-Canadian)
A nimble West Ada School District IT department provides consistent wireless access to 40,000 students.
Solution: Cisco Meraki dashboard, Cisco Meraki MS switches, Cisco Meraki MR series access points, Cisco ThousandEyes
West Ada School District (French-Canadian)
A nimble West Ada School District IT department provides consistent wireless access to 40,000 students.
Solution: Cisco Meraki dashboard, Cisco Meraki MS switches, Cisco Meraki MR series access points, Cisco ThousandEyes
Workday
Workday fuels 22.5 percent subscription growth with new high-capacity data center network.
Solution: Cisco Nexus 9000 Series Switches, Cisco NX-OS, Cisco Customer Experience (Cisco CX)
World Wide Technology (WWT)
Evolving data center networks for high-performance computing.
Solution: Cisco Nexus Dashboard, Nexus Dashboard Insights, Nexus Dashboard Fabric Controller (NDFC), Nexus 9000 Series Switches
Xigent Solutions
Xigent is taking its managed services business to new heights with Cisco data center technologies.
Solution: Cisco UCS X-Series, Cisco Intersight, Cisco Nexus 9000 Series Switches, Cisco AppDynamics
YMCA of Niagara
YMCA of Niagara relies on Cisco to unify networking and security across 125+ distributed sites.
Solution: Cisco Meraki dashboard, Cisco Meraki MX security and SD-WAN, Cisco Wireless, Cisco Meraki
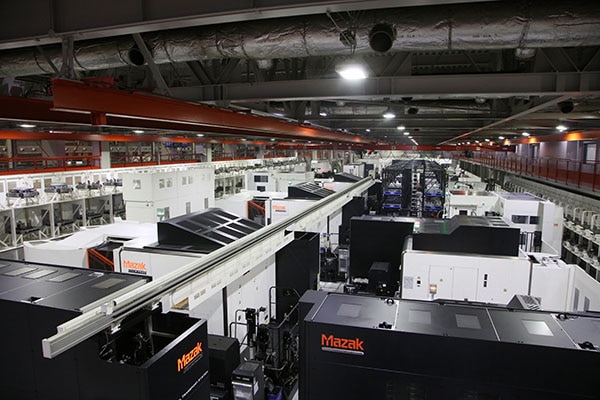
Yamazaki Mazak Corporation (Japanese)
Data-driven solutions help manufacturers achieve smart factories and carbon neutrality.
Solution: Cisco industrial network switches
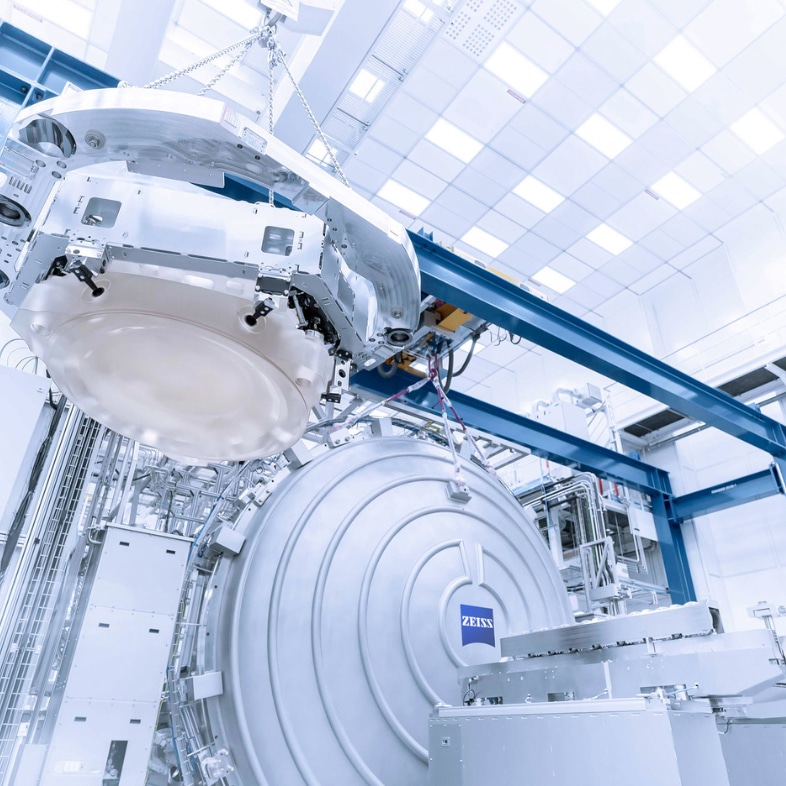
ZEISS
ZEISS defends industrial assets with Cisco security solutions and managed services from Orange.
Solution: Cisco Cyber Vision, Cisco Secure Firewall, Cisco Identity Services Engine
appknot (Korean)
Appknot is a group of Digital Transformation experts solving challenges in the mobile ecosystem.
Solution: Cisco Meraki MS switches, Cisco Meraki MR access points, Cisco Meraki MX security and SD-WAN appliances, Cisco Meraki dashboard
easyJet Airline Company
UK-based easyJet is a prominent point-to-point airline serving 927 routes in 34 nations.
Solution: Cisco Full-Stack Observability, Cisco AppDynamics, Cisco ThousandEyes

easyJet Airline Company (Chinese)
UK-based easyJet is a prominent point-to-point airline serving 927 routes in 34 nations.
Solution: Cisco Full-Stack Observability, Cisco AppDynamics, Cisco ThousandEyes
easyJet Airline Company (English-Australian)
UK-based easyJet is a prominent point-to-point airline serving 927 routes in 34 nations.
Solution: Cisco Full-Stack Observability, Cisco AppDynamics, Cisco ThousandEyes
easyJet Airline Company (English-Canadian)
UK-based easyJet is a prominent point-to-point airline serving 927 routes in 34 nations.
Solution: Cisco Full-Stack Observability, Cisco AppDynamics, Cisco ThousandEyes
easyJet Airline Company (English-UK)
UK-based easyJet is a prominent point-to-point airline serving 927 routes in 34 nations.
Solution: Cisco Full-Stack Observability, Cisco AppDynamics, Cisco ThousandEyes
easyJet Airline Company (French)
UK-based easyJet is a prominent point-to-point airline serving 927 routes in 34 nations.
Solution: Cisco Full-Stack Observability, Cisco AppDynamics, Cisco ThousandEyes
easyJet Airline Company (French-Canadian)
UK-based easyJet is a prominent point-to-point airline serving 927 routes in 34 nations.
Solution: Cisco Full-Stack Observability, Cisco AppDynamics, Cisco ThousandEyes
easyJet Airline Company (German)
UK-based easyJet is a prominent point-to-point airline serving 927 routes in 34 nations.
Solution: Cisco Full-Stack Observability, Cisco AppDynamics, Cisco ThousandEyes
easyJet Airline Company (Japanese)
UK-based easyJet is a prominent point-to-point airline serving 927 routes in 34 nations.
Solution: Cisco Full-Stack Observability, Cisco AppDynamics, Cisco ThousandEyes
Cisco customers in the news
A 40-year-old fintech on the cutting edge
Fiserv is the global tech engine driving 90 billion transactions each year. With support from Cisco, it’s still growing and innovating.
Cisco on Cisco
Turning our learnings into your insights
Explore real-life stories of how our teams utilize Cisco technologies to drive innovation, achieve business outcomes, and shape product development—plus the lessons we've learned along the way.