-
Cisco MDS 9000 Family Fabric Manager Configuration Guide, Release 3.4(1a)
-
Index
-
New and Changed Information
-
Preface
- Getting Started
- Installation and Switch Management
- Switch Configuration
-
Fabric Configuration
-
Configuring and Managing VSANs
-
SAN Device Virtualization
-
Creating Dynamic VSANs
-
Configuring Inter-VSAN Routing
-
Configuring and Managing Zones
-
Distributing Device Alias Services
-
Configuring Fibre Channel Routing Services and Protocols
-
Dense Wavelength Division Multiplexing
-
Managing FLOGI, Name Server, FDMI, and RSCN Databases
-
Discovering SCSI Targets
-
Configuring FICON
-
Advanced Features and Concepts
-
-
Security
-
Configuring FIPS
-
Configuring Users and Common Roles
-
Configuring SNMP
-
Configuring RADIUS and TACACS+
-
Configuring IPv4 Access Control Lists
-
Configuring Certificate Authorities and Digital Certificates
-
Configuring IPsec Network Security
-
Configuring FC-SP and DHCHAP
-
Configuring Port Security
-
Configuring Fabric Binding
-
- IP Services
- Intelligent Storage Services
- Network and Switch Monitoring
- Traffic Management
- Troubleshooting
-
Launching Fabric Manager in Cisco SAN-OS Releases Prior to 3.2(1)
-
Cisco Fabric Manager Unsupported Feature List
-
Interface Nonoperational Reason Codes
-
Managing Cisco FabricWare
-
Configuration Limits for Cisco MDS SAN-OS Release 3.1(x) and 3.2(x)
-
 Feedback
Table Of Contents
Troubleshooting Tools and Techniques
Analyzing Switch Device Health
Analyzing Switch Fabric Configuration
Analyzing End-to-End Connectivity
Using Traceroute (fctrace) and Other Troubleshooting Tools
Analyzing the Results of Merging Zones
Issuing the Show Tech Support Command
Adjusting for Daylight Savings Time
Getting Oversubscription Information in Device Manager
Timer Configuration Across All VSANs
About the Cisco Fabric Analyzer
Configuring the Cisco Fabric Analyzer
Sending Captures to Remote IP Addresses
Configuring a Secondary MAC Address
Troubleshooting Your Fabric
This chapter describes basic troubleshooting methods used to resolve issues with switches. This chapter contains the following sections:
•
Troubleshooting Tools and Techniques
•
•
•
•
•
•
•
•
•
•
Troubleshooting Tools and Techniques
Multiple techniques and tools are available to monitor and trouble shoot the Cisco MDS 9000 Family of switches. These tools provide a complete, integrated, multi-level analysis solution.
Fabric Manager Server—The Cisco Fabric Manager Server provides a long-term, high level view of storage network performance. Fabric wide performance trends can be analyzed using Performance Manager. It provides the starting point for deeper analysis to resolve network hot-spots.
Device Manager—If a performance problem is detected with the Fabric Manager Server, use Cisco Device Manager to view port level statistics in real-time. Details on protocols, errors, discards, byte and frame counts are available. Samples can be taken as frequently as every 2 seconds, and values can be viewed in text form or graphically as pie, bar, area and line changes.
Traffic Analyzer—Another option is to launch the Cisco Traffic Analyzer for Fibre Channel from the Fabric Manager Server to analyze the traffic in greater depth. The Cisco Traffic Analyzer allows you to breakdown traffic by VSANs and protocols and to examine SCSI traffic at a logical unit number (LUN) level.
Protocol Analyzer—If even deeper investigation is needed, the Cisco Protocol Analyzer for Fibre Channel can be launched in-context from the Cisco Traffic Analyzer. The Cisco Protocol Analyzer enables you to examine actual sequences of Fibre Channel frames easily using the Fibre Channel and SCSI decoders Cisco developed for Ethereal.
Port Analyzer Adapter—Fabric Manager Server and Device Manager use SNMP to gather statistics. They fully utilize the built in MDS statistics counters. Even so, there are limits to what the counters can collect.
Integration with the Cisco Traffic Analyzer and Cisco Protocol Analyzer extend the MDS analysis capabilities by analyzing the Fibre Channel traffic itself. The Cisco MDS 9000 Family Switched Port Analyzer (SPAN) enables these solutions via a flexible, non-intrusive technique to mirror traffic selectively from one or more ports to another MDS port within a fabric.
The Cisco Port Analyzer Adapter (PAA) encapsulates SPAN traffic in an Ethernet header for transport to a PC or workstation for analysis. Both Fibre Channel control and data plane traffic are available using SPAN. The PAA broadcasts the Ethernet packets, so they cannot be routed across IP networks. Hubs and switches can be used, provided they are in the same Ethernet subnet. Direct connections between a PAA and the PC are also supported. The PAA can reduce Ethernet traffic by truncating Fibre Channel data.
Both the Cisco Traffic Analyzer and Cisco Protocol Analyzer require the PAA to transport MDS SPAN traffic to a PC or workstation.
Note
Cisco Traffic Analyzer
The Cisco Traffic Analyzer for Fibre Channel provides real-time analysis of SPAN traffic or traffic captured previously using the Cisco Protocol Analyzer. The Fibre Channel traffic from multiple Cisco Port Analyzer Adapters (PAA) can be aggregated and analyzed by the Cisco Traffic Analyzer.
There are limits to how may SPAN sources can be sent to a single SPAN destination port on an MDS. Aggregation extends the amount of information that can be analyzed in a unified set of reports by the Cisco Traffic Analyzer.
Note
The Cisco Traffic Analyzer presents it reports through a Web server, so you can view them locally or remotely. The traffic analysis functions are provided by `ntop' open-source software, which was enhanced by Cisco to add Fibre Channel and SCSI analysis and MDS enhanced inter-switch link (ISL) header support for SPAN. ntop is available on the Cisco.com software download center, under the Cisco Port Analyzer Adapter. ntop is also available on the Internet at http://www.ntop.org/ntop.html. The Cisco enhanced ntop runs under Microsoft Windows and Linux operating systems.
The Cisco Traffic Analyzer for Fibre Channel presents reports with network wide statistics. The Summary Traffic report shows what percentage of traffic was within different ranges of frames sizes. A breakdown of the percentage of traffic for each protocol like SCSI, ELS, etc. is provided. The average and peak throughput for the SPAN traffic being analyzed are also provided.
Fibre Channel traffic can be analyzed on a per VSAN basis with the Cisco Traffic Analyzer. The Domain Traffic Distribution graphs indicate how much traffic (bytes) were transmitted or received by a switch for a particular VSAN. FC Traffic Matrix graphs show how much traffic is transmitted and received between Fibre Channel sources and destinations. The total byte and frame counts for each VSAN are also provided.
Statistics can be analyzed for individual host and storage ports. You can see the percentage of SCSI read vs. write traffic, SCSI vs. other traffic, and percentage of transmitted vs. received bytes and frames. The peak and average throughput values are available for data transmitted and received by each port.
Cisco Protocol Analyzer
The Cisco Protocol Analyzer for Fibre Channel enables you to view Fibre Channel traffic frames in real-time or from a capture file. Fibre Channel and SCSI decoders enable you to view and analyze traffic at the frame level. It matches response with request for complete decoding, which greatly simplifies navigation. Response time between response and status are presented.
The Cisco Protocol Analyzer is VSAN aware, so VSANs can be used as criteria for capture and display filters, and to colorize the display. VSAN #s can also be displayed in a column. Summary statistics are available for protocol distribution percentages and total bytes/frames transferred between specific Fibre Channel source/destination pairs. File capture and filtering controls are available. Captured files can be analyzed by either the Cisco Protocol Analyzer or the Cisco Traffic Analyzer.
Numerous features have been included for ease-of-use. You can find frames that meet particular criteria and mark them. Entries in the frame (packet) list can be colorized to highlight items of interest, and columns can be added/removed as desired.
The protocol analysis functions are provided by `Ethereal' open-source software, which was enhanced by Cisco to decode Fibre Channel and SCSI protocols and support MDS enhanced inter-switch link (ISL) headers for SPAN. Ethereal is available on the Cisco.com software download center, under the Cisco Port Analyzer Adapter. Ethereal is also available on the Internet at http://www.ethereal.com. Ethereal runs under Microsoft Windows, Solaris, and Linux operating systems.
Analyzing Switch Device Health
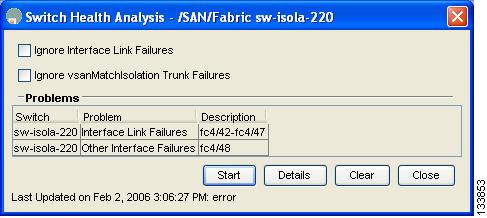
The Switch Health option lets you determine the status of the components of a specific switch.
To use the Switch Health option in Fabric Manager to determine the status of the components of a specific switch, follow these steps:
Step 1
You see the Switch Health Analysis window.
Step 2
You see any problems listed in the switch health analysis window shown in Figure 68-1.
Figure 68-1 Results of a Switch Health Analysis
Step 3
Step 4
Analyzing Switch Fabric Configuration
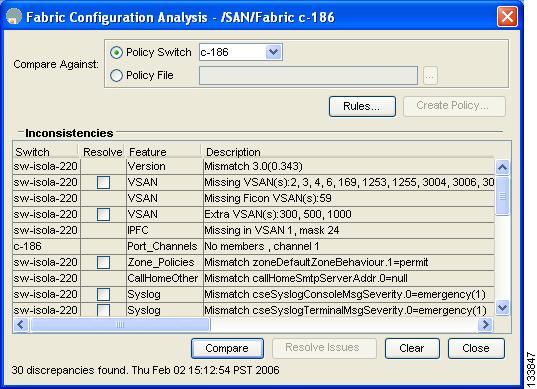
The Fabric Configuration option lets you analyze the configuration of a switch by comparing the current configuration to a specific switch or to a policy file. You can save a switch configuration to a file and then compare all switches against the configuration in the file.
To use the Fabric Configuration option in Fabric Manager to analyze the configuration of a switch, follow these steps:
Step 1
You see the Fabric Configuration Analysis dialog box.
Step 2
•
•
Step 3
You see the Rules window.
Step 4
Step 5
The system analyzes the configuration and displays issues that arise as a result of the comparison as shown in Figure 68-2.
Figure 68-2 Results of a Fabric Configuration Analysis
Step 6
Step 7
Step 8
Step 9
Analyzing End-to-End Connectivity
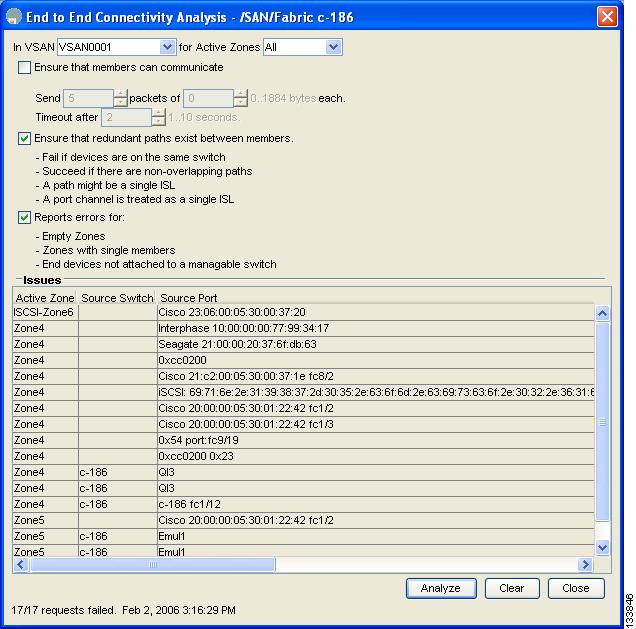
You can use the End to End Connectivity option to determine connectivity and routes among devices with the switch fabric. The connectivity tool checks to see that every pair of end devices can talk to each other, using a Ping test and by determining if they are in the same VSAN or in the same active zone. This option uses versions of the ping and traceroute commands modified for Fibre Channel networks.
- End to End Connectivity
The ping and redundancy tests are now mutually exclusive, you cannot run both at the same time.
To use the End to End Connectivity option in Fabric Manager to determine connectivity and routes, follow these steps:
Step 1
You see the End to End Connectivity Analysis dialog box.
Step 2
Step 3
Step 4
Step 5
Step 6
Step 7
Step 8
The End to End Connectivity Analysis window displays the selected endpoints including the switch to which each is attached, and the source and target ports used to connect it, as shown in Figure 68-3.
Figure 68-3 Results of an End-to-End Connectivity Analysis
The output shows all the requests that have failed. The possible descriptions are:
•
•
•
•
•
•
•
Step 9
Step 10
Using the Ping Tool (fcping)
You can use the Ping tool to determine connectivity from another switch to a port on your switch.
To use the Ping tool in Fabric Manager to determine connectivity, follow these steps:
Step 1
You see the Ping dialog box.
Step 2
Step 3
Step 4
Step 5
You see the results in the dialog box shown in Figure 68-4.
Figure 68-4 Ping Results
Step 6
Using Traceroute (fctrace) and Other Troubleshooting Tools
You can use the following options on the Fabric Manager Tools menu to verify connectivity to a selected object or to open other management tools:
•
•
•
To use the Traceroute option in Fabric Manager to verify connectivity, follow these steps:
Step 1
You see the Trace Route dialog box.
Step 2
Step 3
Step 4
Step 5
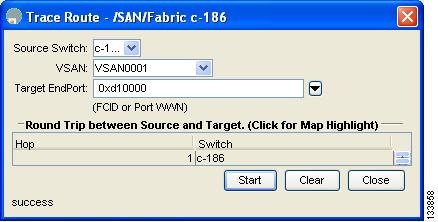
You see the results at the bottom of the dialog box as shown in Figure 68-5.
Figure 68-5 Successful Trace Route Results
Step 6
Analyzing the Results of Merging Zones
You can use the Zone Merge option on the Zone menu to determine if two connected switches have compatible zone configurations.
To use the Zone Merge option in Fabric Manager to determine zone configuration compatibility, follow these steps:
Step 1
You see the Zone Merge Analysis dialog box.
Step 2
Step 3
Step 4
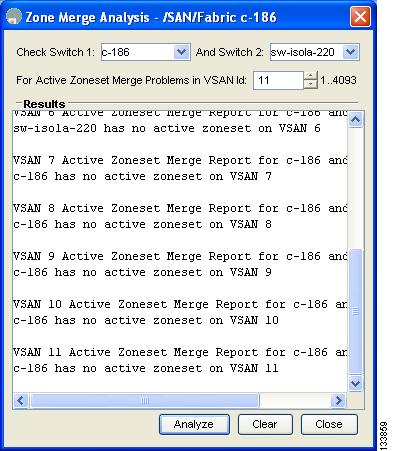
Step 5
The Zone Merge Analysis window displays any inconsistencies between the zone configuration of the two selected switches as shown in Figure 68-6.
Figure 68-6 Results of Zone Merge Analysis
Step 6
Step 7
Issuing the Show Tech Support Command
The show tech support command is useful when collecting a large amount of information about your switch for troubleshooting purposes. The output can be provided to technical support representatives when reporting a problem.
You can issue a show tech support command from Fabric Manager for one or more switches in a fabric. The results of each command are written to a text file, one file per switch, in a directory you specify. You can then view these files using Fabric Manager.
You can also save the Fabric Manager map as a JPG file. The file is saved with the name of the seed switch (for example, 172.22.94.250.jpg).
You can zip up all the files (the show tech support output and the map file image) and send the resulting zipped file to technical support.
To issue the show tech support command using Fabric Manager, follow these steps:
Step 1
You see the Show Tech Support dialog box.
Step 2
Step 3
The default is 30 seconds.
Step 4
Step 5
Step 6
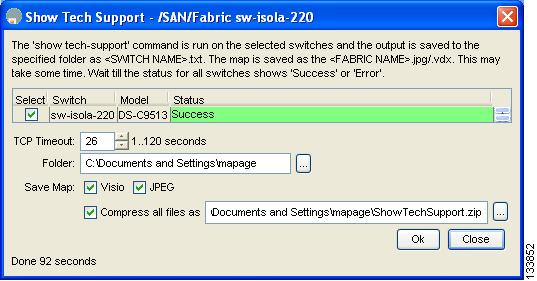
Step 7
In the Status column next to each switch, you see a highlighted status. A yellow highlight indicates that the show tech support command is currently running on that switch. A red highlight indicates an error. A green highlight like the one shown in Figure 68-7 indicates that the show tech support command has completed successfully.
Figure 68-7 Successful Results of the Show Tech Support Command
Step 8
Note
Note
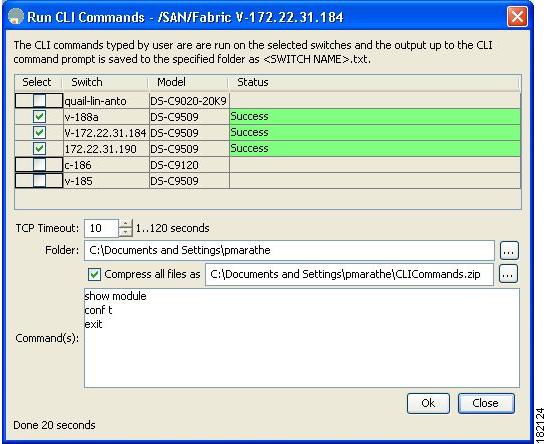
Running CLI Commands
Running CLI Commands
As of Cisco MDS SAN-OS Release 3.1(2), you can use the Run CLI Commands feature to run a CLI command on multiple switches.
To run CLI commands using Fabric Manager, follow these steps:
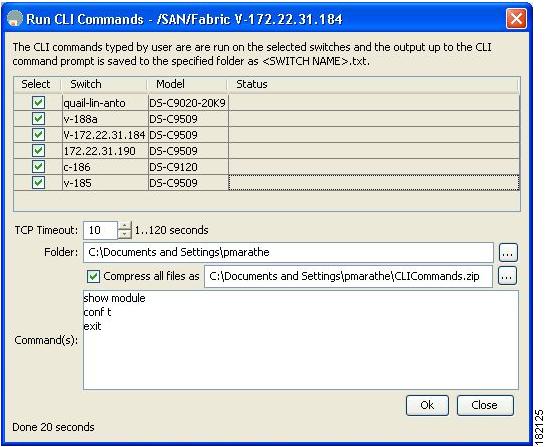
Step 1
You see the Run CLI Commands dialog box with all switches selected as shown in Figure 68-8.
Figure 68-8 Run CLI Commands Dialog Box
Step 2
Step 3
Note
Step 4
Note
Step 5
You see the Run CLI Commands dialog box showing the status of each switch as shown in Figure 68-9.
Figure 68-9 Run CLI Commands Status
Step 6
Adjusting for Daylight Savings Time
Note
You can use the Run CLI Commands feature in Fabric Manager to adjust the time change configuration in your switches. Enter the following commands in the Command(s) text box.
config tno clock summer-timeclock summer-time daylight_timezone_name 2 Sunday March 02:00 1 Sunday November 02:00 60exitLocating Other Switches
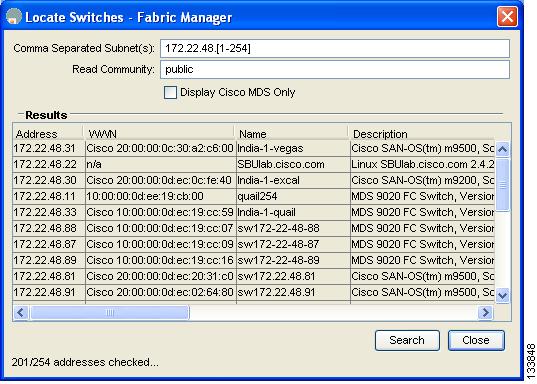
The Locate Switches option uses SNMPv2 and discovers devices responding to SNMP requests with the read-only community string public. You can use this feature if:
•
•
To locate switches that are not included in the currently discovered fabric using Fabric Manager, follow these steps:
Step 1
You see the Locate Switches dialog box.
Step 2
192.168.100.[1-254]
Multiple ranges can be specified, separated by commas. For example, to look for all the devices in the two subnets 192.168.199.0 and 192.169.100.0, use the following string:
192.168.100.[1-254], 192.169.100.[1-254]
Step 3
The default value for this string is public.
Step 4
Step 5
You see the results of the discovery in the Locate Switches window. (See Figure 68-10.)
Figure 68-10 Search Results for Switches and Devices
Note
Step 6
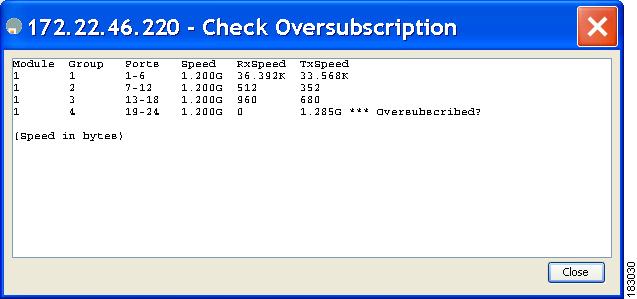
Getting Oversubscription Information in Device Manager
To determine oversubscription for a module using Device Manager, follow these steps:
Step 1
You see the Check Oversubscription dialog box shown in Figure 68-11.
Figure 68-11 Check Oversubscription Dialog Box
Step 2
Note
Fibre Channel Time Out Values
You can modify Fibre Channel protocol related timer values for the switch by configuring the following time out values (TOVs):
•
•
•
Note
Timer Configuration Across All VSANs
You can modify Fibre Channel protocol related timer values for the switch.
Caution
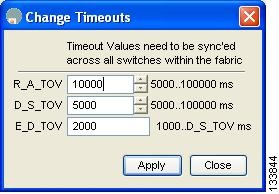
To configure timeouts using Fabric Manager, follow these steps:
Step 1
Step 2
You see the timers for switches in the Information pane.
Step 3
You see the Change Timeouts dialog box shown in Figure 68-12.
Figure 68-12 Change Timeouts Dialog Box
Step 4
Step 5
Step 6
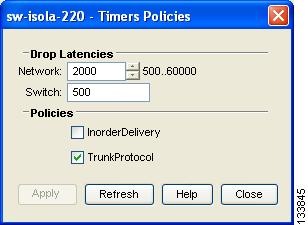
To configure timer policies in Device Manager, follow these steps:
Step 1
You see timer policies for a single switch in the dialog box shown in Figure 68-13.
Figure 68-13 Configure Timer Policies in Device Manager
Step 2
Step 3
Step 4
Step 5
Timer Configuration Per-VSAN
You can also issue an fctimer for a specified VSAN to configure different TOV values for VSANs with special links like FC or IP tunnels. You can configure different E_D_TOV, R_A_TOV, and D_S_TOV values for individual VSANs. Active VSANs are suspended and activated when their timer values are changed.
Caution
Note
If a switch is downgraded to Cisco MDS SAN-OS Release 1.2 or 1.1 after the timer is configured for a VSAN, an error message is issued to warn against strict incompatibilities.
To configure per-VSAN FC timers using Fabric Manager, follow these steps:
Step 1
Step 2
You see timeouts for only switches in the selected VSAN shown in the Information pane.
Step 3
You see the dialog shown in Figure 68-14
Figure 68-14 Change Timeouts per VSAN in Fabric Manager
Step 4
Step 5
Step 6
Step 7
Configuring a Fabric Analyzer
Fibre Channel protocol analyzers capture, decode, and analyze frames and ordered sets on a link. Existing Fibre Channel analyzers can capture traffic at wire rate speed. They are expensive and support limited frame decoding. Also, to snoop traffic, the existing analyzers disrupt the traffic on the link while the analyzer is inserted into the link.
Cisco has brought protocol analysis within a storage network to a new level with the Cisco Fabric Analyzer. You can capture Fibre Channel control traffic from a switch and decode it without having to disrupt any connectivity, and without having to be local to the point of analysis.
The Cisco Fibre Channel protocol analyzer is based on two popular public-domain software applications:
•
•
Note
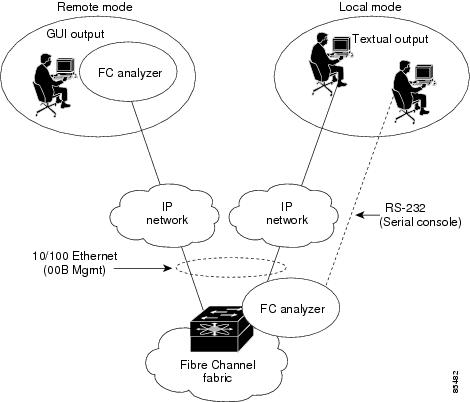
About the Cisco Fabric Analyzer
The Cisco Fabric Analyzer consists of two separate components (see Figure 68-15):
•
–
–
•
Figure 68-15 Cisco Fabric Analyzer Use
Local Text-Based Capture
This component is a command-line driven text-based interface that captures traffic to and from the supervisor module in a Cisco MDS 9000 Family switch. It is a fully functional decoder that is useful for quick debug purposes or for use when the remote capture daemon is not enabled. Additionally, because this tool is accessed from within the Cisco MDS 9000 Family switch, it is protected by the roles-based policy that limits access in each switch.
Remote Capture Daemon
This daemon is the server end of the remote capture component. The Ethereal analyzer running on a host is the client end. They communicate with each other using the Remote Capture Protocol (RPCAP). RPCAP uses two endpoints, a TCP-based control connection and a TCP or UDP-based data connection based on TCP (default) or UDP. The control connection is used to remotely control the captures (start or stop the capture, or specify capture filters). Remote capture can only be performed to explicitly configured hosts. This technique prevents an unauthorized machine in the network from snooping on the control traffic in the network.
RPCAP supports two setup connection modes based on firewall restrictions.
•
•
Using capture filters, you can limit the amount of traffic that is actually sent to the client. Capture filters are specified at the client end—on Ethereal, not on the switch.
GUI-Based Client
The Ethereal software runs on a host, such as a PC or workstation, and communicates with the remote capture daemon. This software is available in the public domain from http://www.ethereal.com. The Ethereal GUI front-end supports a rich interface such as a colorized display, graphical assists in defining filters, and specific frame searches. These features are documented on Ethereal's website.
While remote capture through Ethereal supports capturing and decoding Fibre Channel frames from a Cisco MDS 9000 Family switch, the host running Ethereal does not require a Fibre Channel connection to the switch. The remote capture daemon running on the switch sends the captured frames over the out-of-band Ethernet management port. This capability allows you to capture and decode Fibre Channel frames from your desktop or laptop.
Configuring the Cisco Fabric Analyzer
You can configure the Cisco Fabric Analyzer to perform one of two captures.
•
•
To use the Cisco Fabric Analyzer feature, traffic should be flowing to or from the supervisor module.
Sending Captures to Remote IP Addresses
Caution
To capture remote traffic, use one of the following options:
•
rpcap://<ipaddress or switch hostname>/eth2For example:
rpcap://cp-16/eth2rpcap://17.2.1.1/eth2•
ethereal -i rpcap://<ipaddress|hostname>[:<port>]/<interface>For example:
ethereal -i rpcap://172.22.1.1/eth2or
ethereal -i rpcap://customer-switch.customer.com/eth2
Note
Displaying Captured Frames
You can selectively view captured frames by using the display filters feature. For example, instead of viewing all the frames from a capture, you may only want to view Exchange Link Protocol (ELP) request frames. This feature only limits the captured view—it does not affect the captured or the saved frames. Procedures to specify, use, and save display filters are already documented in the Ethereal website (http://www.ethereal.com). Some examples of how you can use this feature are as follows:
•
mdshdr.vsan == 2•
fcswils•
mdshdr.sof == SOFf•
swils.opcode == HLO || swils.opcode == LSU || swils.opcode == LSA•
fcels.opcode == FLOGI•
fcels.opcode == FLOGI && mdshdr.vsan == 2•
dNSDefining Display Filters
Display filters limit the frames that can be displayed, but not what is captured (similar to any view command). The filters to be displayed can be defined in multiple ways in the GUI application:
•
•
•
•
•
Regardless of the definition, each filter must be saved and identified with a name.
Note
Capture Filters
You can limit what frames are captured by using the capture filters feature in a remote capture. This feature limits the frames that are captured and sent from the remote switch to the host. For example, you can capture only class F frames. Capture filters are useful in restricting the amount of bandwidth consumed by the remote capture.
Unlike display filters, capture filters restrict a capture to the specified frames. No other frames are visible until you specify a completely new capture.
The syntax for capture filter is different from the syntax for display filters. Capture filters use the Berkeley Packet Filter (BPF) library that is used in conjunction with the libpcap freeware. The list of all valid Fibre Channel capture filter fields are provided later in this section.
Procedures to configure capture filters are already documented in the Ethereal website (http://www.ethereal.com). Some examples of how you can use this feature as follows:
•
vsan = 1•
class_f•
els•
dns•
fcp_cmd
Note
Permitted Capture Filters
This section lists the permitted capture filters.
o vsan
o src_port_idx
o dst_port_idx
o sof
o r_ctl
o d_id
o s_id
o type
o seq_id
o seq_cnt
o ox_id
o rx_id
o els
o swils
o fcp_cmd   (FCP Command frames only)
o fcp_data (FCP data frames only)
o fcp_rsp   (FCP response frames only)
o class_f
o bad_fc
o els_cmd
o swils_cmd
o fcp_lun
o fcp_task_mgmt
o fcp_scsi_cmd
o fcp_status
o gs_type      (Generic Services type)
o gs_subtype   (Generic Services subtype)
o gs_cmd
o gs_reason
o gs_reason_expl
o dns   (name server)
o udns (unzoned name server)
o fcs   (fabric configuration server)
o zs    (zone server)
o fc    (use as fc[x:y] where x is offset and y is length to compare)
o els   (use as els[x:y] similar to fc)
o swils (use as swils[x:y] similar to fc)
o fcp   (use as fcp[x:y] similar to fc)
o fcct (use as fcct[x:y] similar to fc)
Configuring World Wide Names
The world wide name (WWN) in the switch is equivalent to the Ethernet MAC address. As with the MAC address, you must uniquely associate the WWN to a single device. The principal switch selection and the allocation of domain IDs rely on the WWN. The WWN manager, a process-level manager residing on the switch's supervisor module, assigns WWNs to each switch.
Cisco MDS 9000 Family switches support three network address authority (NAA) address formats (see Table 68-1).
Caution
Link Initialization WWN Usage
Exchange Link Protocol (ELP) and Exchange Fabric Protocol (EFP) use WWNs during link initialization. The usage details differ based on the Cisco SAN-OS software release:
Both ELPs and EFPs use the VSAN WWN by default during link initialization. However, the ELP usage changes based on the peer switch's usage:
•
•
Note
Configuring a Secondary MAC Address
To allocate a secondary MAC address, follow these steps:
Step 1
You see a list of switches in the Information pane.
Step 2
Step 3
Figure 68-16 Setting secondary MAC addresses
Step 4
Step 5
Step 6
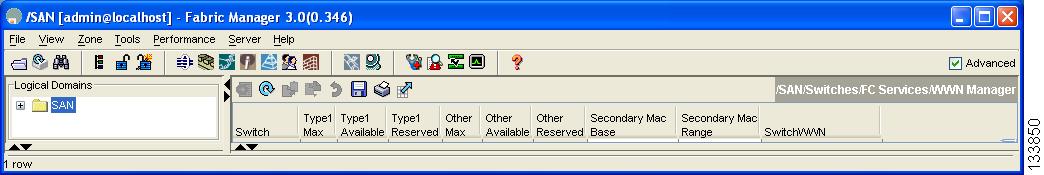
Displaying WWN Information
To display the status of the WWN configuration, follow these steps:
Step 1
You see a list of switches in the Information pane.
Step 2
You see the WWN information for each switch in the SAN or VSAN.
FC ID Allocation for HBAs
Fibre Channel standards require a unique FC ID to be allocated to an N port attached to a Fx port in any switch. To conserve the number of FC IDs used, Cisco MDS 9000 Family switches use a special allocation scheme.
Some HBAs do not discover targets that have FC IDs with the same domain and area. Prior to Cisco SAN-OS Release 2.0(1b), the Cisco SAN-OS software maintained a list of tested company IDs which do not exhibit this behavior. These HBAs were allocated with single FC IDs, and for others a full area was allocated.
The FC ID allocation scheme available in Release 1.3 and earlier, allocates a full area to these HBAs. This allocation isolates them to that area and are listed with their pWWN during a fabric login. The allocated FC IDs are cached persistently and are still available in Cisco SAN-OS Release 2.0(1b) (see the "FC ID Allocation for HBAs" section).
As of Cisco SAN-OS Release 2.0(1b), to allow further scalability for switches with numerous ports, the Cisco SAN-OS software maintains a list of HBAs exhibiting this behavior. Each HBA is identified by its company ID (also know as Organizational Unit Identifier, or OUI) used in the pWWN during a fabric log in. Hence a full area is allocated to the N ports with company IDs that are listed and for the others, a single FC ID is allocated. Irrespective of the kind (whole area or single) of FC ID allocated, the FC ID entries remain persistent.
Default Settings
Table 68-2 lists the default settings for the features included in this chapter.