-
Cisco MDS 9000 Family Fabric Manager Configuration Guide, Release 3.4(1a)
-
Index
-
New and Changed Information
-
Preface
- Getting Started
- Installation and Switch Management
- Switch Configuration
-
Fabric Configuration
-
Configuring and Managing VSANs
-
SAN Device Virtualization
-
Creating Dynamic VSANs
-
Configuring Inter-VSAN Routing
-
Configuring and Managing Zones
-
Distributing Device Alias Services
-
Configuring Fibre Channel Routing Services and Protocols
-
Dense Wavelength Division Multiplexing
-
Managing FLOGI, Name Server, FDMI, and RSCN Databases
-
Discovering SCSI Targets
-
Configuring FICON
-
Advanced Features and Concepts
-
-
Security
-
Configuring FIPS
-
Configuring Users and Common Roles
-
Configuring SNMP
-
Configuring RADIUS and TACACS+
-
Configuring IPv4 Access Control Lists
-
Configuring Certificate Authorities and Digital Certificates
-
Configuring IPsec Network Security
-
Configuring FC-SP and DHCHAP
-
Configuring Port Security
-
Configuring Fabric Binding
-
- IP Services
- Intelligent Storage Services
- Network and Switch Monitoring
- Traffic Management
- Troubleshooting
-
Launching Fabric Manager in Cisco SAN-OS Releases Prior to 3.2(1)
-
Cisco Fabric Manager Unsupported Feature List
-
Interface Nonoperational Reason Codes
-
Managing Cisco FabricWare
-
Configuration Limits for Cisco MDS SAN-OS Release 3.1(x) and 3.2(x)
-
 Feedback
Table Of Contents
Using Cisco Traffic Analyzer with Performance Manager
Understanding Cisco Traffic Analyzer
Installing Cisco Traffic Analyzer
Accessing Traffic Analyzer from Fabric Manager Web Server
Cisco Traffic Analyzer
Cisco Traffic Analyzer is a version of network top (ntop) software that is modified to support Fibre Channel and SCSI.
This chapter contains the following sections:
•
Using Cisco Traffic Analyzer with Performance Manager
•
•
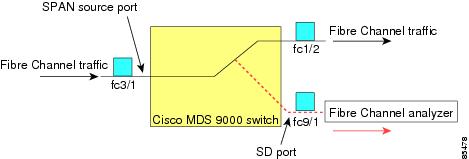
Understanding SPAN
The SPAN feature is specific to switches in the Cisco MDS 9000 Family. It monitors network traffic though a Fibre Channel interface. Traffic through any Fibre Channel interface can be replicated to a special port called the SPAN destination port (SD port). Any Fibre Channel port in a switch can be configured as an SD port. Once an interface is in SD port mode, it cannot be used for normal data traffic. You can attach a Fibre Channel analyzer to the SD port to monitor SPAN traffic.
SD ports do not receive frames, they merely transmit a copy of the SPAN source traffic. The SPAN feature is nonintrusive and does not affect switching of network traffic for any SPAN source ports (see Figure 9-1).
Figure 9-1 SPAN Transmission
For information on configuring SPAN, refer to the Cisco MDS 9000 Family CLI Configuration Guide.
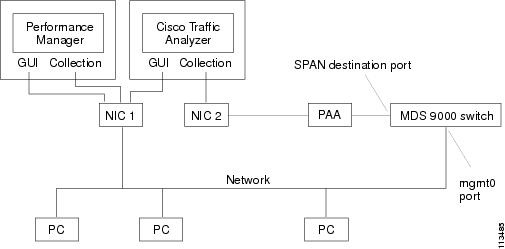
Using Cisco Traffic Analyzer with Performance Manager
Performance Manager works in conjunction with Cisco Traffic Analyzer to monitor and manage the traffic on your fabric. Using Cisco Traffic Analyzer with Performance Manager requires the following components:
•
•
•
Note
Figure 9-2 shows how Performance Manager works with Cisco Traffic Analyzer to monitor traffic on your fabric.
Figure 9-2 Overview of Performance Manager Working with Cisco Traffic Analyzer
Understanding the PAA-2
The PAA-2 enables effective, low-cost analysis of Fibre Channel traffic. The device is a standalone Fibre Channel-to-Ethernet adapter, designed primarily to analyze SPAN traffic from a Fibre Channel port on a Cisco MDS 9000 Family switch. The main function of the Port Analyzer Adapter 2 is to encapsulate Fibre Channel frames into Ethernet frames. This allows low-cost analysis of Fibre Channel traffic while leveraging the existing Ethernet infrastructure.
The PAA-2 allows you to examine Fibre Channel frames of various sizes. Fibre Channel frames from Layers 2, 3, and 4 may be examined without network disruption.
Understanding Cisco Traffic Analyzer
Performance Manager collects Fibre Channel level performance statistics using SNMP to access counters on Cisco MDS 9000 Family switches. To view detailed SCSI I/O statistics, you need to look at the data on an SD port with the help of Cisco Traffic Analyzer, which uses the Cisco Port Analyzer Adapter 2 (PAA-2).
Cisco Traffic Analyzer provides real-time analysis of SPAN traffic or analysis of captured traffic through a Web browser user interface. Traffic encapsulated by one or more Port Analyzer Adapter 2 products can be analyzed concurrently with a single workstation running Cisco Traffic Analyzer, which is based on ntop, a public domain software enhanced by Cisco for Fibre Channel traffic analysis.
Round-trip response times, SCSI I/Os per second, SCSI read or traffic throughput and frame counts, SCSI session status, and management task information are monitored. Additional statistics are also available on Fibre Channel frame sizes and network management protocols.
For seamless performance analysis and troubleshooting, Cisco Traffic Analyzer can be launched in-context from Fabric Manager. Port world wide name (pWWN), Fibre Channel ID (FC ID), FC alias, and VSAN names are passed to Cisco Traffic Analyzer.
Cisco Traffic Analyzer must be downloaded and installed separately from the following website:
http://www.cisco.com/public/sw-center/sw-stornet.shtml.
Cisco Traffic Analyzer software is available under the Port Analyzer Adapter link. See the "Installing Cisco Traffic Analyzer" section.
Caution
Note
Installing Cisco Traffic Analyzer
To install Cisco Traffic Analyzer on a UNIX workstation, follow these steps:
Step 1
http://cisco.com/cgi-bin/tablebuild.pl/mds-fm.Step 2
http://www.ntop.org.Step 3
Step 4
Step 5
Step 6
Step 7
Caution
To install Cisco Traffic Analyzer on a Windows workstation, follow these steps:
Step 1
http://cisco.com/cgi-bin/tablebuild.pl/mds-fm.Step 2
Step 3
Note
http://winpcap.polito.it/.Step 4
Step 5
a.
b.
c.
d.
e.
Note
Step 6
Step 7
Step 8
Step 9
Step 10
Tip
—Linux platforms use the shell script path. The ntop output is sent to the syslog file (/var/log/messages by default).
—Windows platforms use the batch file. The ntop output is sent to a file located in the same directory as the one from which ntop is launched.
Accessing Traffic Analyzer from Fabric Manager Web Server
Fabric Manager supports discovering instances of Traffic Analyzer and SPAN ports configured within your fabric.
Fabric Manager Web Server supports the following Traffic Analyzer integration features:
•
•
•
•
•
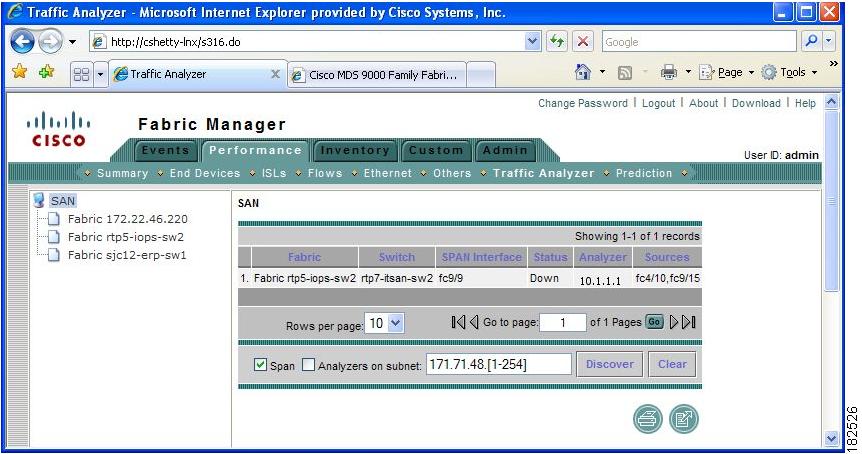
To access an instance of Traffic Analyzer running in your fabric using Fabric Manager Web Server, follow these steps:
Step 1
You see a summary table of all SPAN destination ports and configured Traffic Analyzers in your fabric (see Figure 9-3). The source column shows the ports that are monitored by the SPAN destination port.
Figure 9-3 Traffic Analyzer in Fabric Manager Web Server
Step 2
To rediscover instances of Traffic Analyzer running in your fabric using Fabric Manager Web Server, follow these steps:
Step 1
You see a summary table of all SPAN destination ports and configured Traffic Analyzers in your fabric shown in Figure 9-4.
Figure 9-4 Traffic Analyzer in Fabric Manager Web Server
Step 2
Step 3
Step 4