-
Cisco MDS 9000 Family Fabric Manager Configuration Guide, Release 3.4(1a)
-
Index
-
New and Changed Information
-
Preface
- Getting Started
- Installation and Switch Management
- Switch Configuration
-
Fabric Configuration
-
Configuring and Managing VSANs
-
SAN Device Virtualization
-
Creating Dynamic VSANs
-
Configuring Inter-VSAN Routing
-
Configuring and Managing Zones
-
Distributing Device Alias Services
-
Configuring Fibre Channel Routing Services and Protocols
-
Dense Wavelength Division Multiplexing
-
Managing FLOGI, Name Server, FDMI, and RSCN Databases
-
Discovering SCSI Targets
-
Configuring FICON
-
Advanced Features and Concepts
-
-
Security
-
Configuring FIPS
-
Configuring Users and Common Roles
-
Configuring SNMP
-
Configuring RADIUS and TACACS+
-
Configuring IPv4 Access Control Lists
-
Configuring Certificate Authorities and Digital Certificates
-
Configuring IPsec Network Security
-
Configuring FC-SP and DHCHAP
-
Configuring Port Security
-
Configuring Fabric Binding
-
- IP Services
- Intelligent Storage Services
- Network and Switch Monitoring
- Traffic Management
- Troubleshooting
-
Launching Fabric Manager in Cisco SAN-OS Releases Prior to 3.2(1)
-
Cisco Fabric Manager Unsupported Feature List
-
Interface Nonoperational Reason Codes
-
Managing Cisco FabricWare
-
Configuration Limits for Cisco MDS SAN-OS Release 3.1(x) and 3.2(x)
-
 Feedback
Table Of Contents
Supervisor and Switching Modules
Setting Device Manager Preferences
Device Manager
This chapter contains descriptions of, and instructions for using, the Cisco MDS 9000 Device Manager. This chapter contains the following sections:
•
Setting Device Manager Preferences
Device Manager Overview
Device Manager provides a graphic representation of a Cisco MDS 9000 Family switch chassis, including the installed switching modules, the supervisor modules, the status of each port within each module, the power supplies, and the fan assemblies.
The tables in the Fabric Manager Information pane basically correspond to the dialog boxes that appear in Device Manager. However, while Fabric Manager tables show values for one or more switches, a Device Manager dialog box shows values for a single switch. Also, Device Manager provides more detailed information for verifying or troubleshooting device-specific configuration than Fabric Manager.
Device Manager Features
Device Manager provides two views, Device View and Summary View. Use Summary View to monitor interfaces on the switch. Use Device View to perform switch-level configurations including the following:
•
•
•
•
•
•
•
•
Launching Device Manager
You can launch Device Manager two ways.
To launch Device Manager from your desktop, double-click the Device Manager icon and follow the instructions described in the "Integrating Cisco Fabric Manager with Other Management Tools" section on page 2-38.
Launch Device Manager from Fabric Manager, any of three ways:
•
•
•
Using Device Manager
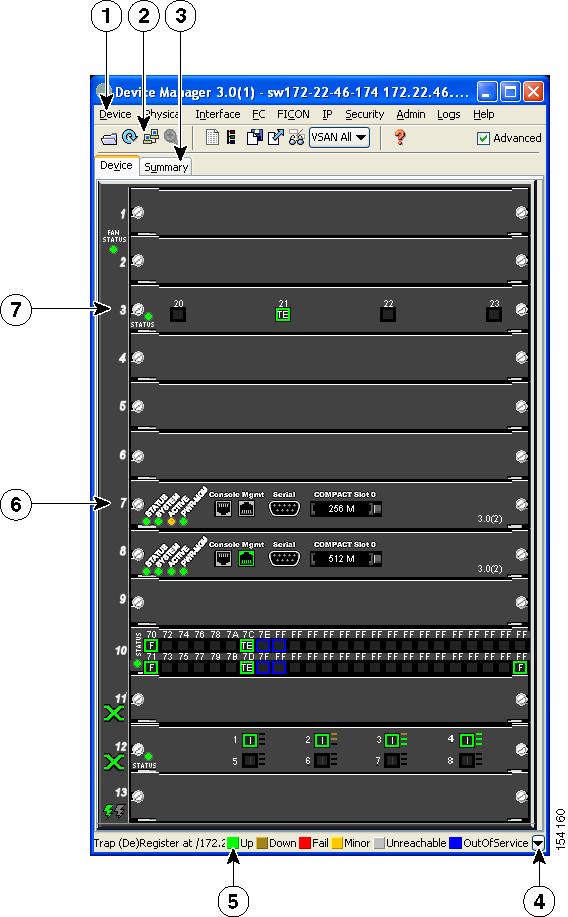
This section describes the Device Manager interface, as shown in Figure 6-1.
Figure 6-1 Device Manager, Device Tab
Menu Bar
The menu bar at the top of the Device Manager main window provides options for managing and troubleshooting a single switch. The menu bar provides the following options:
•
•
•
•
•
•
•
•
•
•
Toolbar Icons
The Device Manager toolbar provides quick access to many Device Manager features. Once the icon is selected, a dialog box may open that allows configuration of the feature. The toolbar provides the main Device and Summary View icons as shown in Table 6-1.
Dialog Boxes
If a toolbar icon is selected, a dialog box may open that allows configuration of the selected feature. The dialog box may include table manipulation icons. See the "Information Pane" section on page 5-11 for descriptions of these icons.
Tabs
Click the Device tab on the Device Manager main window to see a graphical representation of the switch chassis and components.
Click the Summary tab on the Device Manager main window to see a summary of active interfaces on a single switch, as well as Fibre Channel and IP neighbor devices. The Summary View also displays port speed, link utilization, and other traffic statistics. There are two buttons in the upper left corner of the Summary View tab used to monitor traffic. To monitor traffic for selected objects, click the Monitor Selected Interface Traffic Util% button. To display detailed statistics for selected objects, click the Monitor Selected Interface Traffic Details button. You can set the poll interval, the type or Rx/Tx display, and the thresholds.
Legend
The legend at the bottom right of the Device Manager indicates port status, as follows:
Colors
•
•
•
•
•
•
Labels
•
•
•
•
•
•
•
•
•
Supervisor and Switching Modules
In the Device View, you can right-click an object and get information on it, or configure it. If you right-click a module, the menu shows the module number and gives you the option to configure or reset the module. If you right-click a port, the menu shows the port number and gives you the option to configure, monitor, enable/disable, set beacon mode, or perform diagnostics on the port.
Tip
To enable or disable a port, right-click the port and click Enable or Disable from the pop-up menu. To enable or disable multiple ports, drag the mouse to select the ports and then right-click the selected ports. Then click Enable or Disable from the pop-up menu.
To manage trunking on one or more ports, right-click the ports and click Configure. In the dialog box that appears, right-click the current value in the Trunk column and click nonTrunk, trunk, or auto from the pull-down list.
To create PortChannels using Device Manager, click PortChannels from the Interface menu. For detailed instructions, see Chapter 23, "Configuring PortChannels." You can also use Fabric Manager to conveniently create a PortChannel.
Note
Context Menus
Context menus are available in both Device Manager views by right-clicking a device or table.
From Device View:
•
•
From Summary View:
•
Setting Device Manager Preferences
To set your preferences for the behavior of the Device Manager application, choose Device > Preferences from the Device menu. You can set the following preferences:
•
•
•
•
•
•
•
•
Note
•
•
•
•
•