-
Cisco MDS 9000 Family Fabric Manager Configuration Guide, Release 3.4(1a)
-
Index
-
New and Changed Information
-
Preface
- Getting Started
- Installation and Switch Management
- Switch Configuration
-
Fabric Configuration
-
Configuring and Managing VSANs
-
SAN Device Virtualization
-
Creating Dynamic VSANs
-
Configuring Inter-VSAN Routing
-
Configuring and Managing Zones
-
Distributing Device Alias Services
-
Configuring Fibre Channel Routing Services and Protocols
-
Dense Wavelength Division Multiplexing
-
Managing FLOGI, Name Server, FDMI, and RSCN Databases
-
Discovering SCSI Targets
-
Configuring FICON
-
Advanced Features and Concepts
-
-
Security
-
Configuring FIPS
-
Configuring Users and Common Roles
-
Configuring SNMP
-
Configuring RADIUS and TACACS+
-
Configuring IPv4 Access Control Lists
-
Configuring Certificate Authorities and Digital Certificates
-
Configuring IPsec Network Security
-
Configuring FC-SP and DHCHAP
-
Configuring Port Security
-
Configuring Fabric Binding
-
- IP Services
- Intelligent Storage Services
- Network and Switch Monitoring
- Traffic Management
- Troubleshooting
-
Launching Fabric Manager in Cisco SAN-OS Releases Prior to 3.2(1)
-
Cisco Fabric Manager Unsupported Feature List
-
Interface Nonoperational Reason Codes
-
Managing Cisco FabricWare
-
Configuration Limits for Cisco MDS SAN-OS Release 3.1(x) and 3.2(x)
-
 Feedback
Table Of Contents
Performance Manager Architecture
Performance Manager
The primary purpose of Fabric Manager is to manage the network. A key management capability is network performance monitoring. This chapter includes the following topics:
Performance Manager Architecture
Performance Manager Architecture
Performance Manager gathers network device statistics historically and provides this information graphically using a web browser. It presents recent statistics in detail and older statistics in summary. Performance Manager also integrates with external tools such as Cisco Traffic Analyzer.
The Performance Manager has three operational stages:
•
Definition—The Flow Wizard sets up flows in the switches.
•
•
Performance Manager can collect statistics for ISLs, hosts, storage elements, and configured flows. Flows are defined based on a host-to-storage (or storage-to-host) link. Performance Manager gathers statistics from across the fabric based on collection configuration files. These files determine which SAN elements and SAN links Performance Manager gathers statistics for. Based on this configuration, Performance Manager communicates with the appropriate devices (switches, hosts, or storage elements) and collects the appropriate information at fixed five-minute intervals.
Performance Manager uses a round-robin database to hold the statistical data collected from the fabric. This data is stored based on the configured parameters in the collection configuration file. At each polling interval, Performance Manager gathers the relevant statistics and stores them in the round-robin database. This database is a fixed size and will not grow beyond its preset limits.
Performance Manager creates a series of archived data to hold summarized information present in the real-time round-robin database. This archived data is used to generate daily, weekly, monthly, and yearly consolidated reports. In this way, Performance Manager maintains significant historical data without the cost of an ever-increasing database size.
Note
Data Interpolation
One of the unique features of Performance Manager is its ability to interpolate data when statistical polling results are missing or delayed. Other performance tools may store the missing data point as zero, but this can distort historical trending. Performance Manager interpolates the missing data point by comparing the data point that preceded the missing data and the data point stored in the polling interval after the missing data. This maintains the continuity of the performance information.
Data Collection
One year's worth of data for two variables (Rx and Tx bytes) requires a round-robin database (rrd) file size of 76K. If errors and discards are also collected, the rrd file size becomes 110K. The default internal values are:
•
•
•
•
A 1000-port SAN requires 110 MB for a year's worth of historical data that includes errors and discards. If there were 20 switches in this SAN with equal distribution of fabric ports, about two to three SNMP packets per switch would be sent every 5 minutes for a total of about 100 request or response SNMP packets required to monitor the data.
Flows, because of their variable counter requests, are more difficult to predict storage space requirements for. But as a rule of thumb, each extra flow adds another 76 kB.
Note
Using Performance Thresholds
The Performance Manager Configuration Wizard allows you to set up two thresholds that will trigger events when the monitored traffic exceeds the percent utilization configured. These event triggers can be set as either Critical or Warning events that are reported on the Fabric Manager web client Events browser page.
Absolute value thresholds apply directly to the statistics gathered. These statistics, as a percent of the total link capacity, are compared to the percent utilization configured for the threshold type. If the statistics exceed either configured threshold, an event is shown on the Fabric Manager web client Events tab.
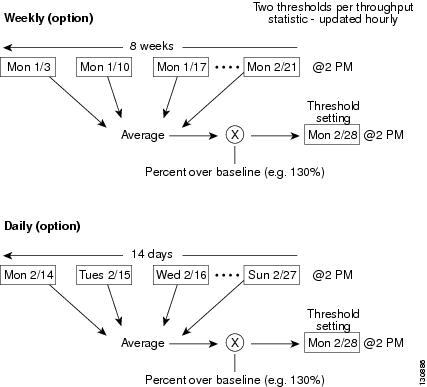
Baseline thresholds create a threshold that adapts to the typical traffic pattern for each link for the same time window each day, week, or every two weeks. Baseline thresholds are set as a percent of the average (110% to 500%), where 100% equals the calculated weighted average. Figure 8-1 shows an example of setting a baseline threshold for a weekly or daily option.
Figure 8-1 Baseline Threshold Example
The threshold is set for Monday at 2 p.m. The baseline threshold is set at 130% of the average for that statistic. The average is calculated from the statistics value that occurred at 2 p.m. on Monday, for every prior Monday (for the weekly option) or the statistics value that occurred at 2 p.m. on each day, for every prior day (for the daily option).
Flow Setup Wizards
The Performance Manager Flow and Performance Manager Setup wizards greatly simplify configuration. All you need to do is select the categories of statistics to capture and the wizards provide a list of flows and links to monitor. You can remove entries if desired, or just accept the provided list and start data collection. Statistics for host and storage links are not associated with a specific port on a switch, so you do not lose long term statistics if a connection is moved to a different port.
Flow Statistics Configuration
Flow statistics count the ingress traffic in the aggregated statistics table. You can collect two kinds of statistics:
•
•
This section includes the following topics:
About Flow Statistics
If you enable flow counters, you can enable a maximum of 1K entries for aggregate flow and flow statistics. Be sure to assign an unused flow index to a module for each new flow. Flow indexes can be repeated across modules. The number space for flow index is shared between the aggregate flow statistics and the flow statistics.
Generation 1 modules allow a maximum of 1024 flow statements per module. Generation 2 modules allow a maximum of 2048-128 flow statements per module.
Table 8-1 explains the Flow Type radio button that defines the type of traffic monitored.
Counting Flow Statistics
To count the flow statistics for an active zone set using Fabric Manager, follow these steps:
Step 1
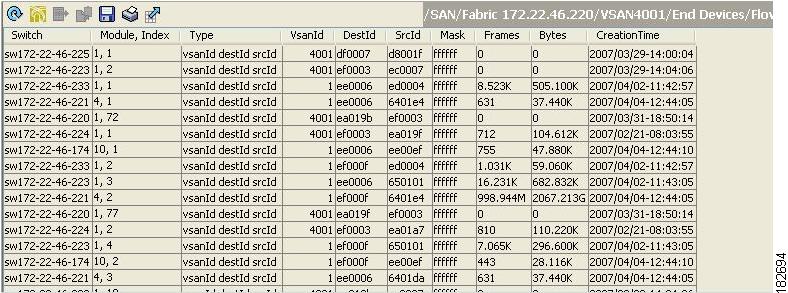
You see the Flow Statistics shown in Figure 8-2.
Figure 8-2 Flow Statistics in Fabric Manager
Step 2
Note
See the "Historical Performance Monitoring" section on page 60-4 for a full description on Performance Manager features.
Note
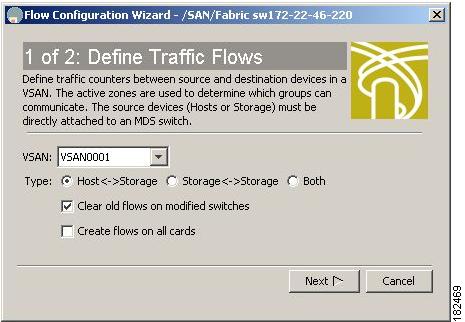
You see the dialog box shown in Figure 8-3.
Figure 8-3 Define Traffic Flows Dialog Box
Step 3
Step 4
Step 5
Step 6
Step 7
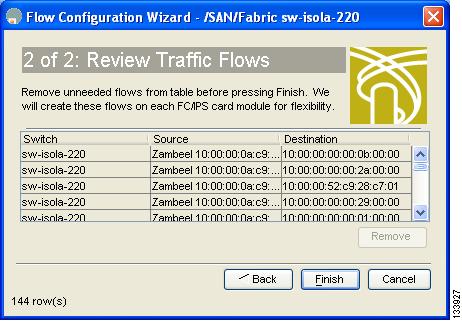
You see the dialog box shown in Figure 8-4.
Figure 8-4 Review Traffic Flows Dialog Box
Step 8
Step 9