View Campus Utilization Reports
Procedure
|
Step 1 |
In the Space Utilization App left navigation menu, choose Campuses. |
|
Step 2 |
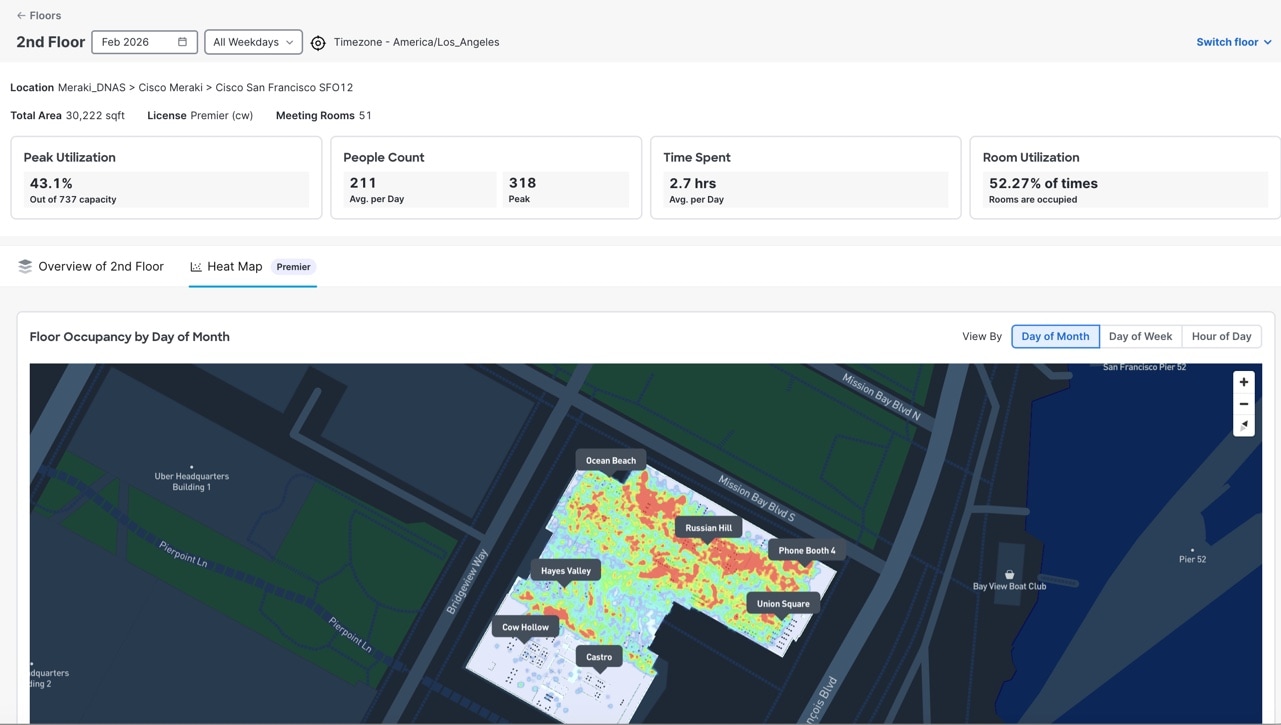
Use the calendar filters at the top to select the month and dates as needed. |
|
Step 3 |
View these details:
|
|
Step 4 |
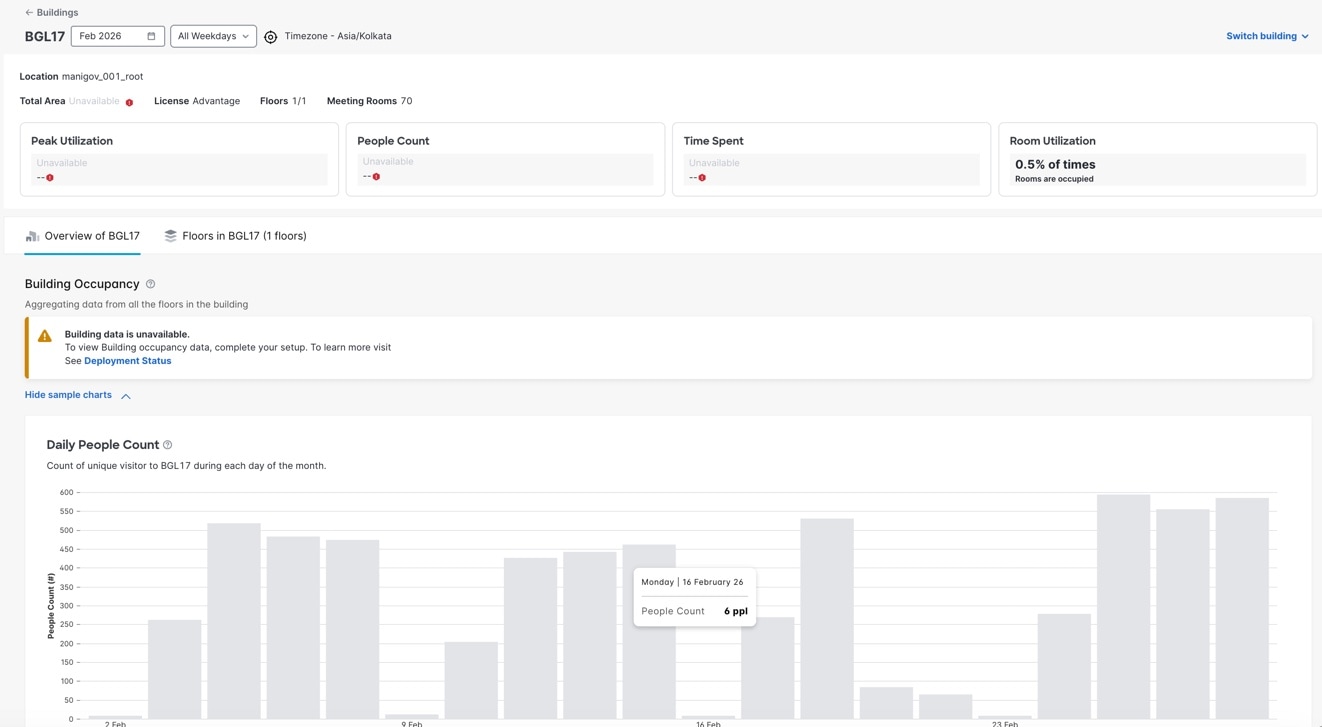
Use Search or click on the desired campus name to display its detailed view. 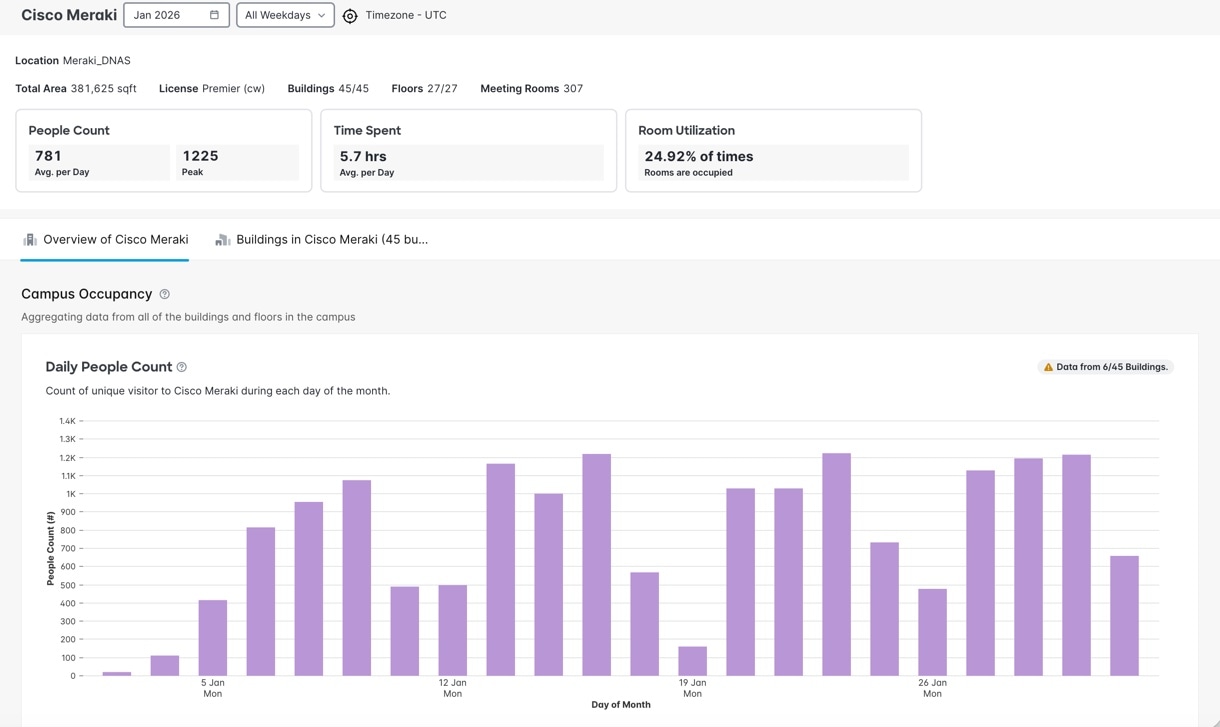
|
|
Step 5 |
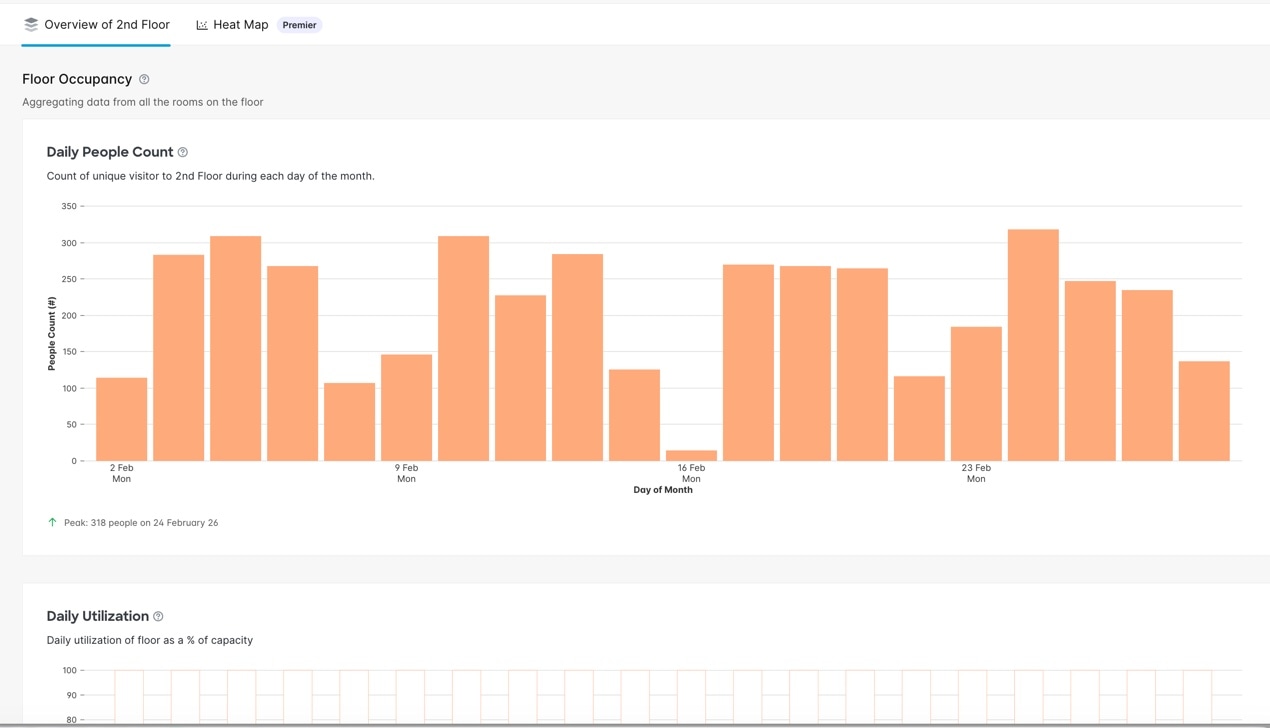
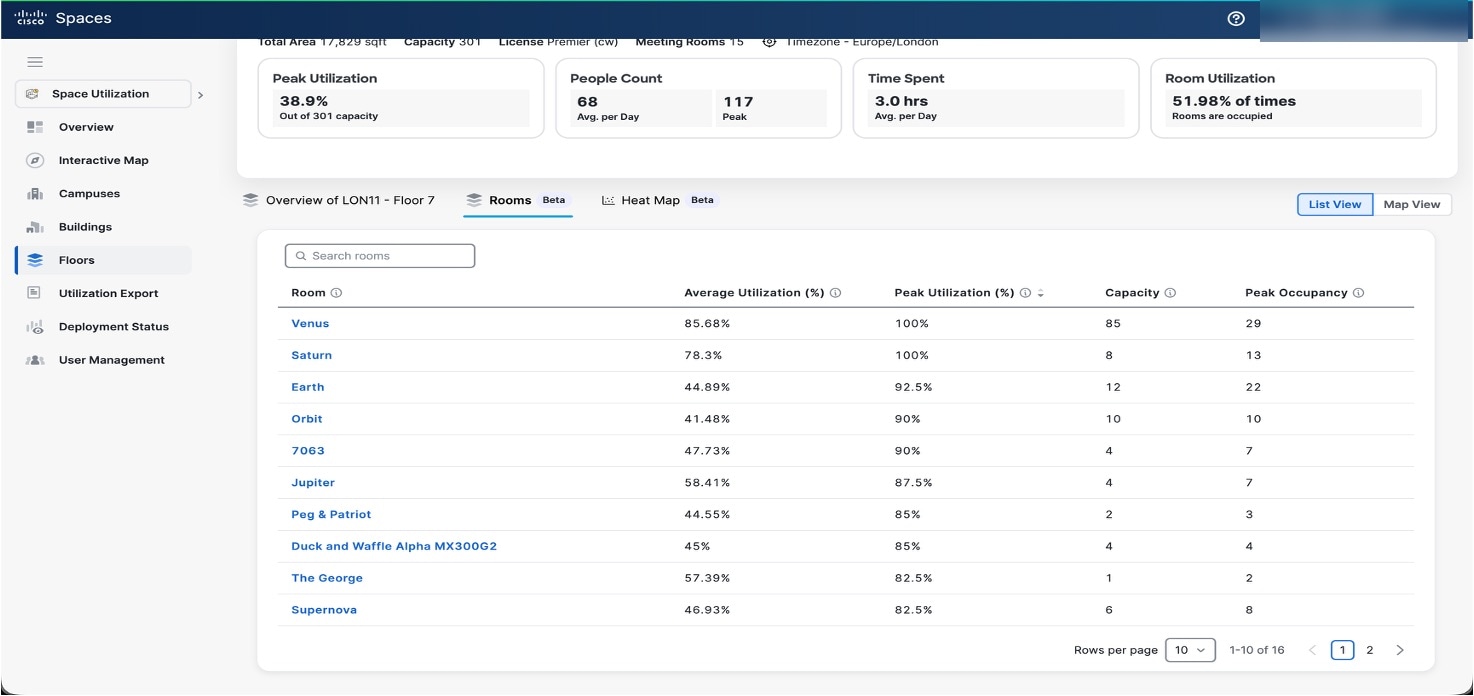
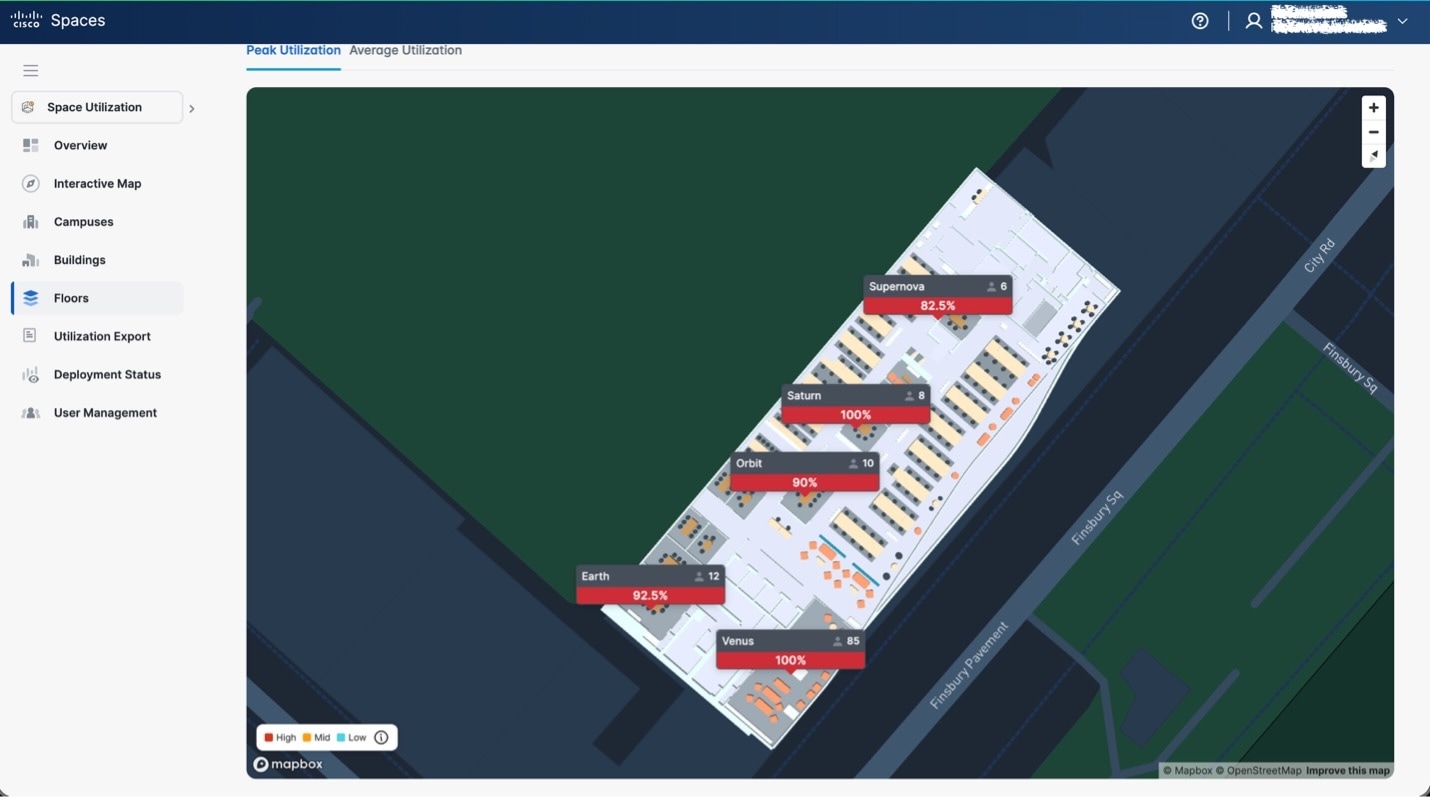
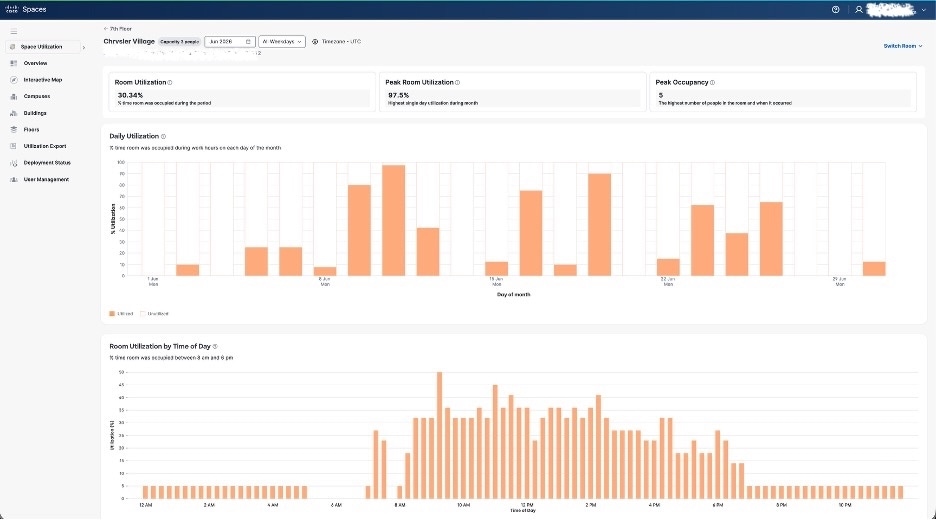
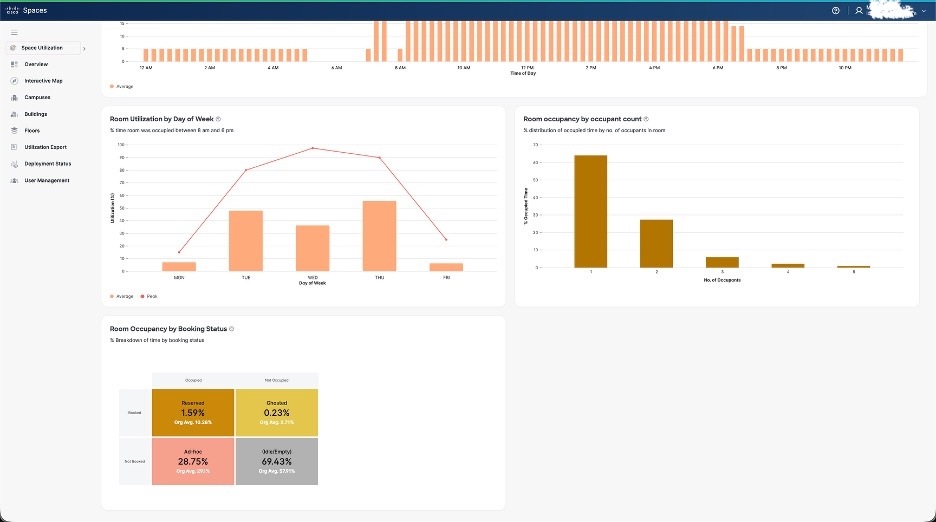
Choose either the Overview tab or the View by Buildings tab to understand the space utilization at a campus or building level.
|
 Feedback