Interactive Maps
The Interactive Maps section in Cisco Spaces provides users with a dynamic, map-based interface to visualize and analyze space utilization across different campuses, buildings, and floors. This map tool leverages real-time and historical data to display metrics such as people count and time spent within various locations, supporting effective workspace management and planning.
The map is interactive and supports multiple utilization metrics for comprehensive analysis.
Key features:
-
Map Navigation: You can zoom, pan, and select specific regions on the map to explore facilities in detail.
-
Filtering Options: The interface allows filtering by date (e.g., Nov 2025), type of location (e.g., Buildings), and utilization metric (e.g., People Count or Time Spent).
-
Search Functionality: A search bar enables you to quickly locate specific campuses, buildings, or floors.
-
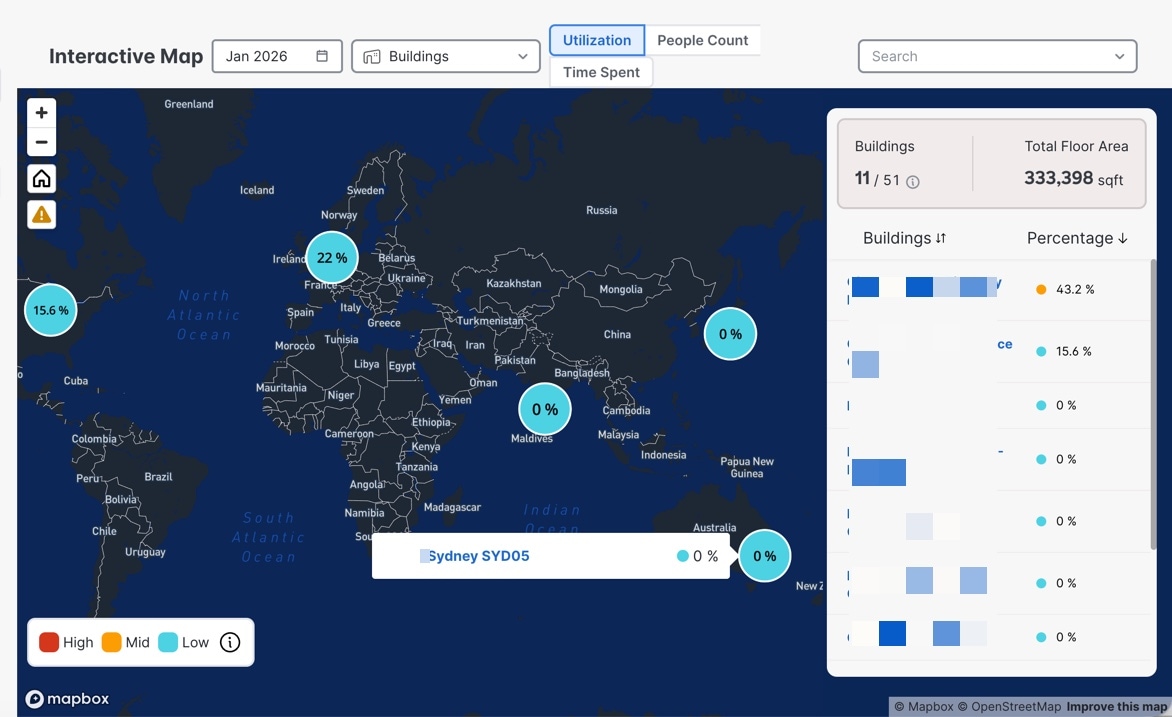
Data Visualization: Utilizes an overlay on a geographic map (powered by Mapbox and OpenStreetMap) to represent real-world locations and their utilization statistics.
-
Summary Panel: Provides a snapshot of the number of buildings and total floor area selected. If data is not available, a notification is displayed (e.g., "Building data is unavailable").
-
Color-coded Bubble Markers: Display aggregated values and clicking on these bubbles zooms into the campus, building, or floor view. Tooltips for bubble markers show campus details for campuses, building details for buildings, and building with all floor details for floors. Clicking on the names in the bubble marker tooltip or the summary panel redirects to the respective campus, building, or floor details pages.
 Feedback