- Preface
- Overview
- Installing the Server Operating System or Hypervisor
- Managing the Server
- Managing Storage Using RAID
- Viewing Server Properties
- Viewing Server Sensors
- Managing Remote Presence
- Managing User Accounts
- Configuring Network-Related Settings
- Configuring Communication Services
- Managing Certificates
- Configuring Platform Event Filters
- Firmware Management
- Viewing Faults and Logs
- Server Utilities
- Diagnostic Tests
- Index
Configuring Platform Event Filters
This chapter includes the following sections:
- Platform Event Filters
- Enabling Platform Event Alerts
- Disabling Platform Event Alerts
- Configuring Platform Event Filters
- Interpreting Platform Event Traps
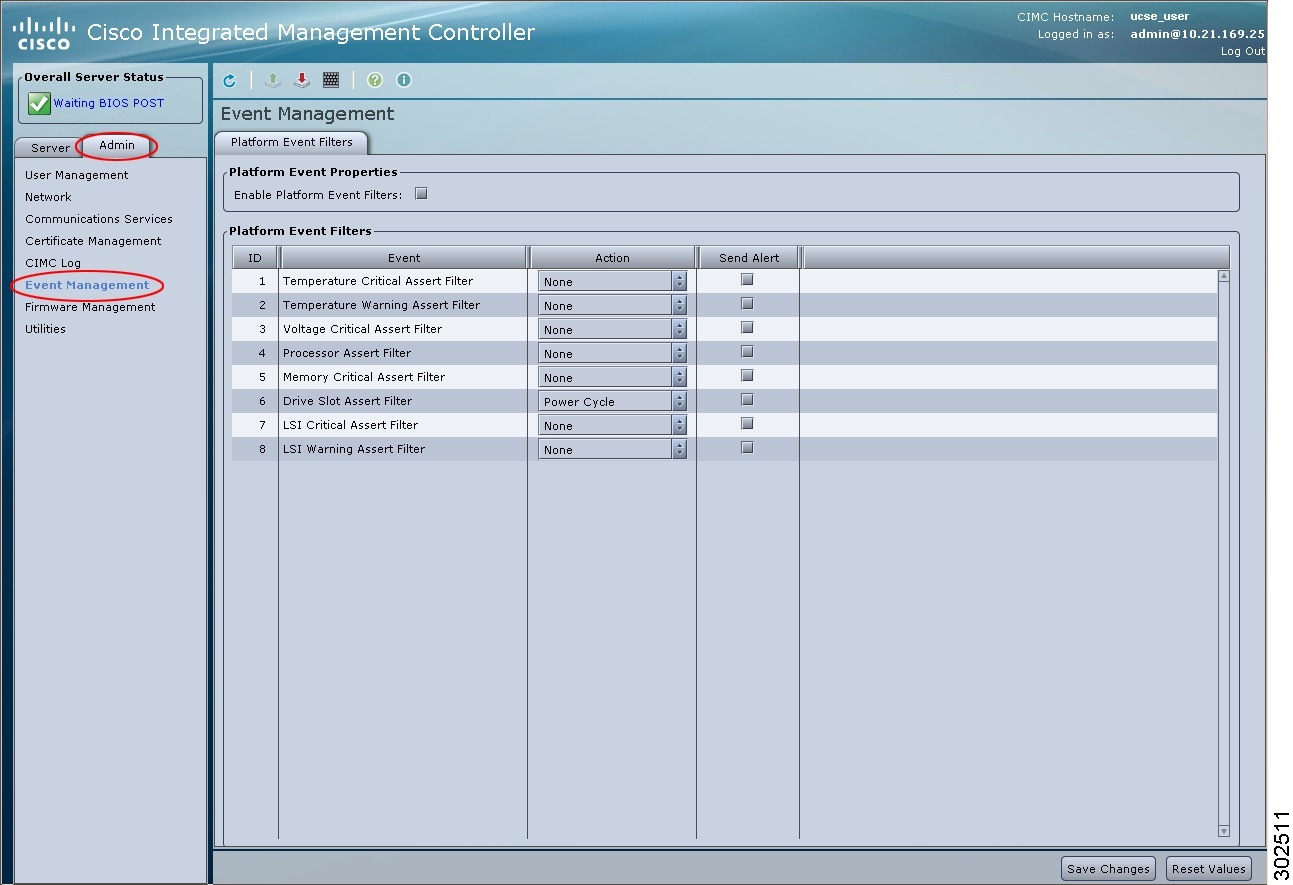
Platform Event Filters
A platform event filter (PEF) can trigger an action and generate an alert when a critical hardware-related event occurs. For each PEF, you can choose the action to be taken (or take no action) when a platform event occurs. You can also choose to generate and send an alert when a platform event occurs. Alerts are sent as an SNMP trap, so you must configure an SNMP trap destination before the alerts can be sent.
You can globally enable or disable the generation of platform event alerts. When disabled, alerts are not sent even if PEFs are configured to send them.
Enabling Platform Event Alerts
You must log in as a user with admin privileges to enable platform event alerts.
Disabling Platform Event Alerts
You must log in as a user with admin privileges to disable platform event alerts.
Configuring Platform Event Filters
You must log in as a user with admin privileges to configure platform event filters.
What to Do Next
If you configure any PEFs to send an alert, complete the following tasks:
Interpreting Platform Event Traps
A CIMC platform event alert sent as an SNMP trap contains an enterprise object identifier (OID) in the form 1.3.6.1.4.1.3183.1.1.0.event. The first ten fields of the OID represent the following information: iso(1).org(3).dod(6).internet(1).private(4).enterprises(1).wired_for_management(3183).PET(1).version(1).version(0), indicating an IPMI platform event trap (PET) version 1.0 message. The last field is an event number, indicating the specific condition or alert being notified.
Platform Event Trap Descriptions
The following table provides a description of the event being notified in a platform event trap message, based on the event number in the trap OID.
| Event Number [Note 1] | Platform Event Description | |||
|---|---|---|---|---|
| 0 | 0h | Test Trap | ||
| 65799 | 010107h | Temperature Warning | ||
| 65801 | 010109h | Temperature Critical | ||
| 131330 | 020102h | Under Voltage, Critical | ||
| 131337 | 020109h | Voltage Critical | ||
| 196871 | 030107h | Current Warning | ||
| 262402 | 040102h | Fan Critical | ||
| 459776 | 070400h | Processor related (IOH-Thermalert/Caterr sensor) – predictive failure deasserted | ||
| 459777 | 070401h | Processor related (IOH-Thermalert/Caterr sensor) – predictive failure asserted | ||
| 460032 | 070500h | Processor Power Warning – limit not exceeded | ||
| 460033 | 070501h | Processor Power Warning – limit exceeded | ||
| 524533 | 0800F5h | Power Supply Critical | ||
| 524551 | 080107h | Power Supply Warning | ||
| 525313 | 080401h | Discrete Power Supply Warning | ||
| 527105 | 080B01h | Power Supply Redundancy Lost | ||
| 527106 | 080B02h | Power Supply Redundancy Restored | ||
| 552704 | 086F00h | Power Supply Inserted | ||
| 552705 | 086F01h | Power Supply Failure | ||
| 552707 | 086F03h | Power Supply AC Lost | ||
| 786433 | 0C0001h | Correctable ECC Memory Errors, Release 1.3(1) and later releases, filter set to accept all reading types [Note 4] | ||
| 786439 | 0C0007h | DDR3_INFO sensor LED - RED bit asserted (Probable ECC error on a
DIMM), Generic Sensor [Notes 2,3]
|
||
| 786689 | 0C0101h | Correctable ECC Memory Errors, Release 1.3(1) and later releases | ||
| 818945 | 0C7F01h | Correctable ECC Memory Errors, Release 1.2(x) and earlier releases | ||
| 818951 | 0C7F07h | DDR3_INFO sensor LED - RED bit asserted (Probable ECC error on a
DIMM), 1.2(x) and earlier releases [Note 3]
|
||
| 851968 | 0D0000h | HDD sensor indicates no fault, Generic Sensor [Note 2] | ||
| 851972 | 0D0004h | HDD sensor indicates a fault, Generic Sensor [Note 2] | ||
| 854016 | 0D0800h | HDD Absent, Generic Sensor [Note 2] | ||
| 854017 | 0D0801h | HDD Present, Generic Sensor [Note 2] | ||
| 880384 | 0D6F00h | HDD Present, no fault indicated | ||
| 880385 | 0D6F01h | HDD Fault | ||
| 880512 | 0D6F80h | HDD Not Present | ||
| 880513 | 0D6F81h | HDD is deasserted but not in a fault state | ||
| 884480 | 0D7F00h | Drive Slot LED Off | ||
| 884481 | 0D7F01h | Drive Slot LED On | ||
| 884482 | 0D7F02h | Drive Slot LED fast blink | ||
| 884483 | 0D7F03h | Drive Slot LED slow blink | ||
| 884484 | 0D7F04h | Drive Slot LED green | ||
| 884485 | 0D7F05h | Drive Slot LED amber | ||
| 884486 | 0D7F01h | Drive Slot LED blue | ||
| 884487 | 0D7F01h | Drive Slot LED read | ||
| 884488 | 0D7F08h | Drive Slot Online | ||
| 884489 | 0D7F09h | Drive Slot Degraded | ||
|
||||
 Feedback