AI Policy Statistics in Secure Workload
The AI Policy Statistics feature in Secure Workload offers the following key functionalities:
-
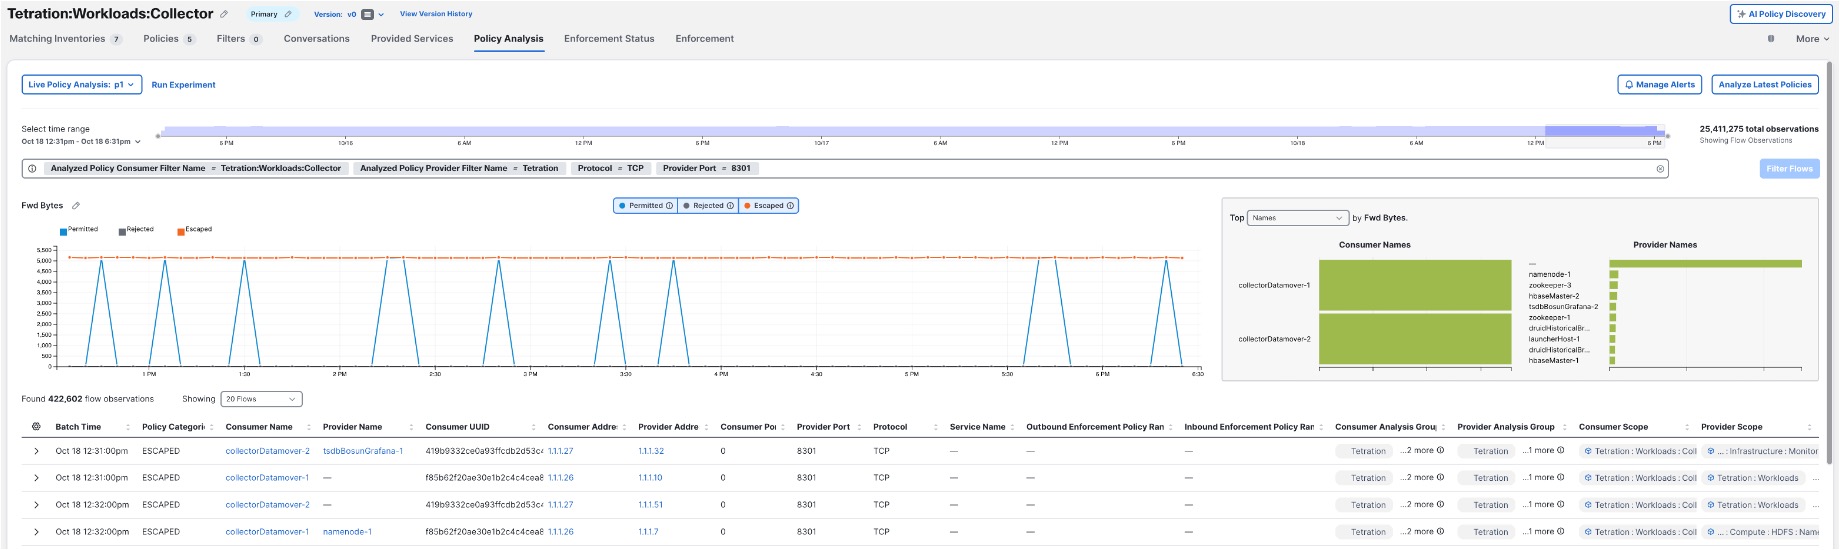
Policy trend analysis: Users can view the performance trends of policies over a specific time period while comparing the expected number of flows to the actual performance of the policies.
-
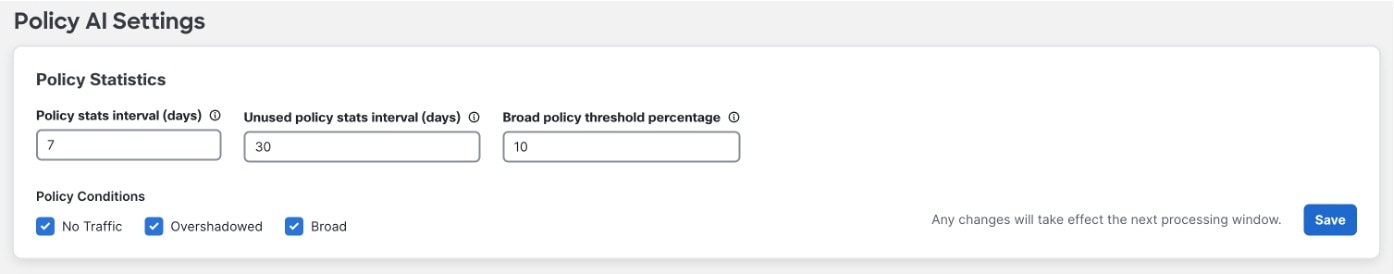
Policy conditions: The AI engine identifies and flags policies that meet specific conditions and require user attention.
Note that a policy condition rule cannot be in more than one condition at a time. For example, a rule can either be in Broad or Overshadowed condition at a time, but not in both the conditions at the same time.
-
No Traffic–policy that does not affect any flow for a configured period.
Figure 1. Policy condition–No Traffic 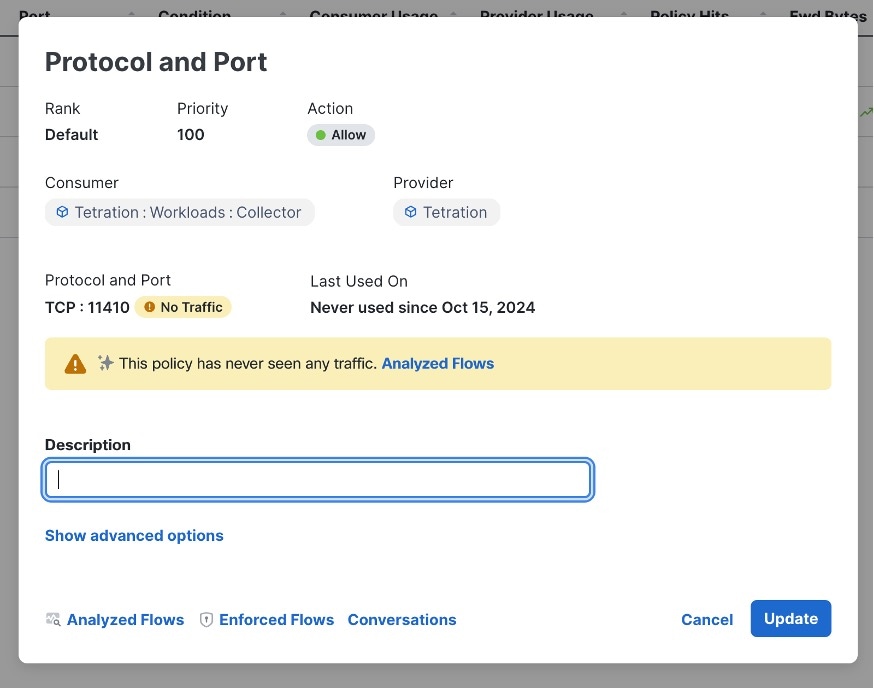
-
Overshadowed–a policy that overshadows another policy.
Figure 2. Policy Condition–Overshadowed 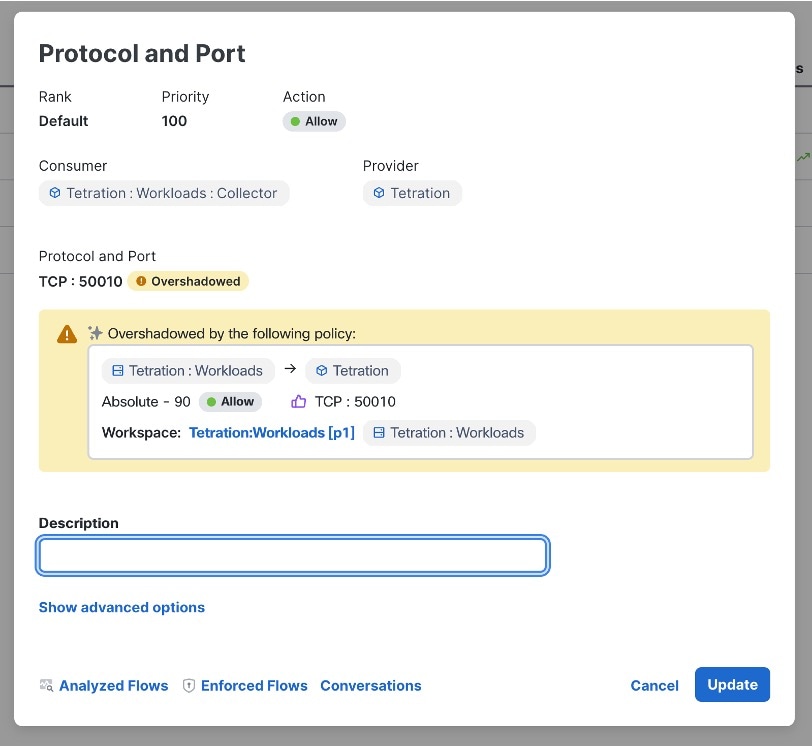
-
Broad–a policy source filter or destination filter that has underutilized policy filters. For example, if a filter consists of 10 inventories and only 2 out of the 10 inventories participate in the flows that are affected by the policy, the filter will be at only 20% utilization.
Figure 3. Policy Condition–Broad 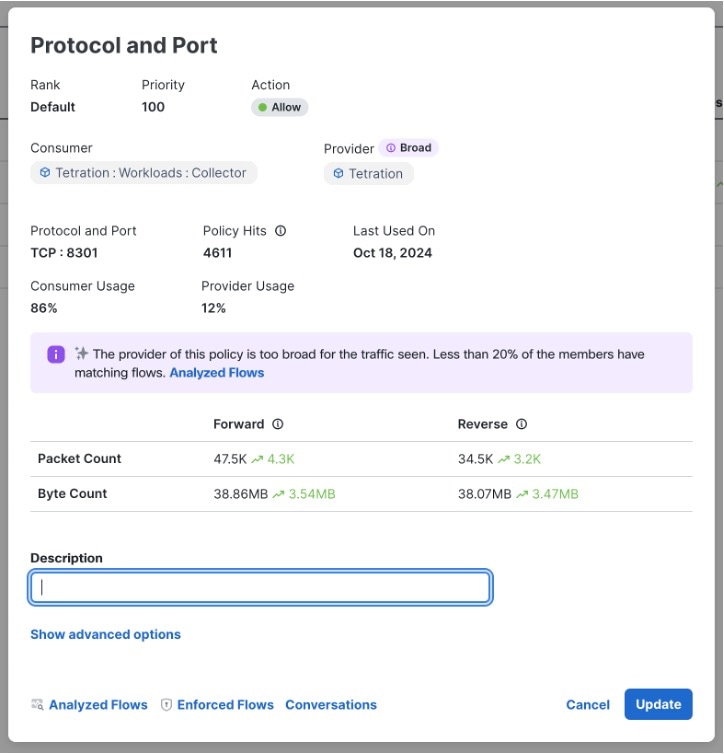
-
AI Policy Statistics on Traffic Flows
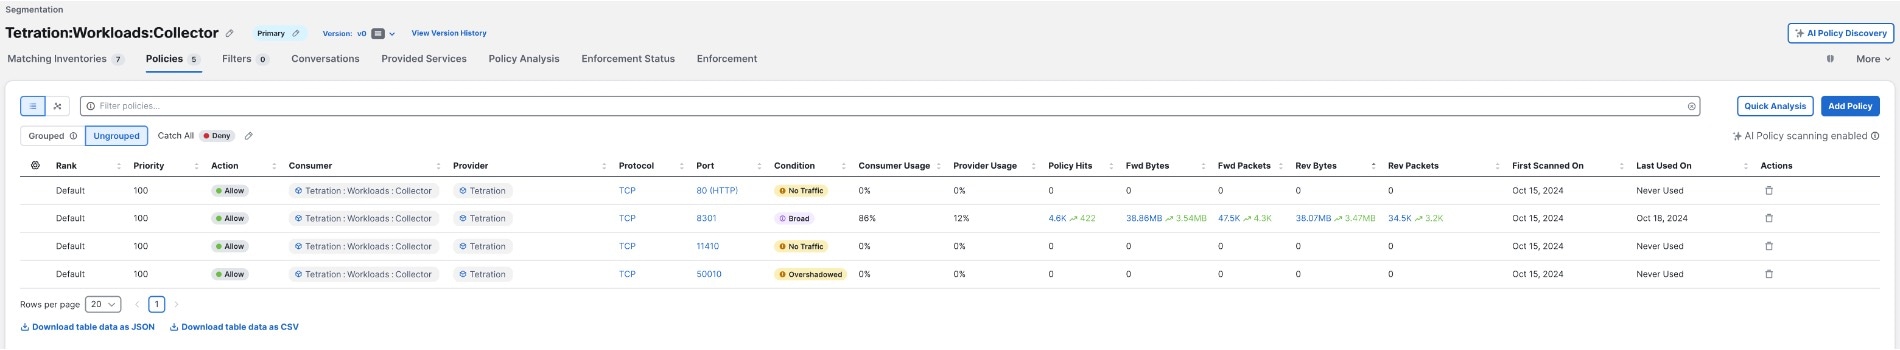
Policy statistics or hits on traffic flows are based on the number of flows that are affected by each policy. The hit count is for the deployed policy and not for policy versions that are in draft form or have not been published yet.
 Note |
The First Scanned On and Last Used On columns represent the timestamps when the AI engine first scanned a particular policy and the last time it scanned the same policy. |
High Volume Trends in Traffic Flows
To capture high-volume trends in traffic during peak events, the system processes data, focusing on identifying anomalous patterns in network traffic. The AI engine uses historical data to establish a baseline of normal traffic patterns. During high-volume events, any significant deviation from this baseline is detected and flagged as a potential anomaly. The insights into policies provide real-time data on policy performance, which can be used to monitor and respond to traffic spikes during peak events. The system's analysis algorithms take into account the dynamic nature of network traffic to accurately identify and report anomalies without generating false positives.
Calculate Policy Statistics
Policy statistics or hit counts are calculated based on the number of flows that match a policy's criteria. Policy statistics are updated every six hours over a window of one week. The AI aspect involves using machine learning algorithms to identify patterns and trends in the hit counts, offering a more nuanced understanding of policy performance compared to simple hit counts on a firewall.
 Feedback