Global Visualization of Network Traffic Flows

In today’s complex and challenging networking world, securing the network is crucial for any organization. To address the challenges of visibility into network and data traffic, Global Visualization feature provides comprehensive visibility into the intricate details of connections, patterns, and relationships within a network.


Attention


Due to recent GUI updates, some of the images or screenshots used in the user guide may not fully reflect the current design of the product. We recommend using this guide in conjunction with the latest version of the software for the most accurate visual reference.


Introduction to Global Visualization

Cisco Secure Workload's microsegmentation solution includes Global Visualization, a tool that helps organisations to gain near real-time network visibility, segmentation of the network, discover vulnerabilities, and overall improvement in the security posture.
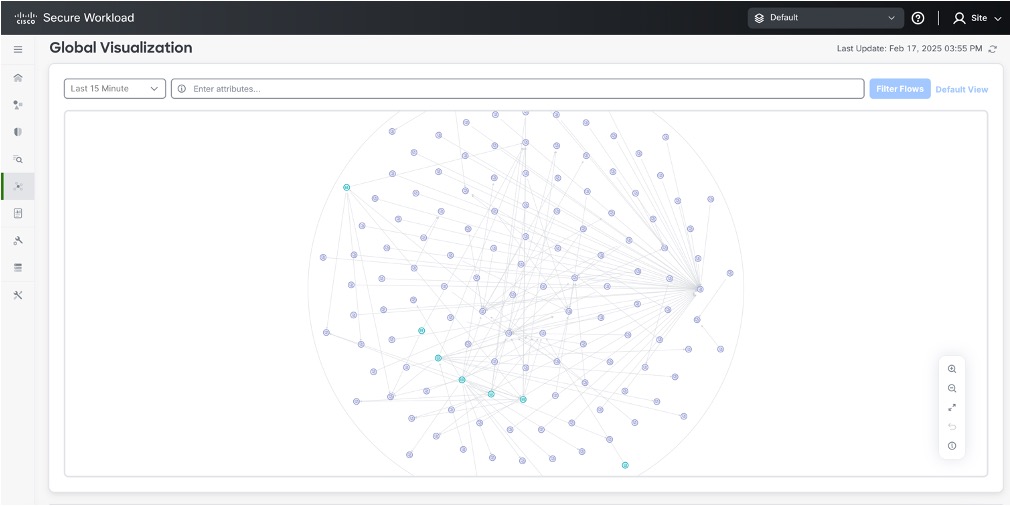
Figure 1. Global visualization
Global Visualization screen in Cisco Secure Workload. It displays a network graph with nodes and connections, with options to filter flows and view the default view.

Limitations of Global Visualization

Global visualization is accessible only to users with root scope access.

Toolbar Options

Various options, such as, enlarging or reducing the canvas, adjusting the canvas on the page, or using the Back button to return to the earlier view can be performed using the toolbar options that are available.
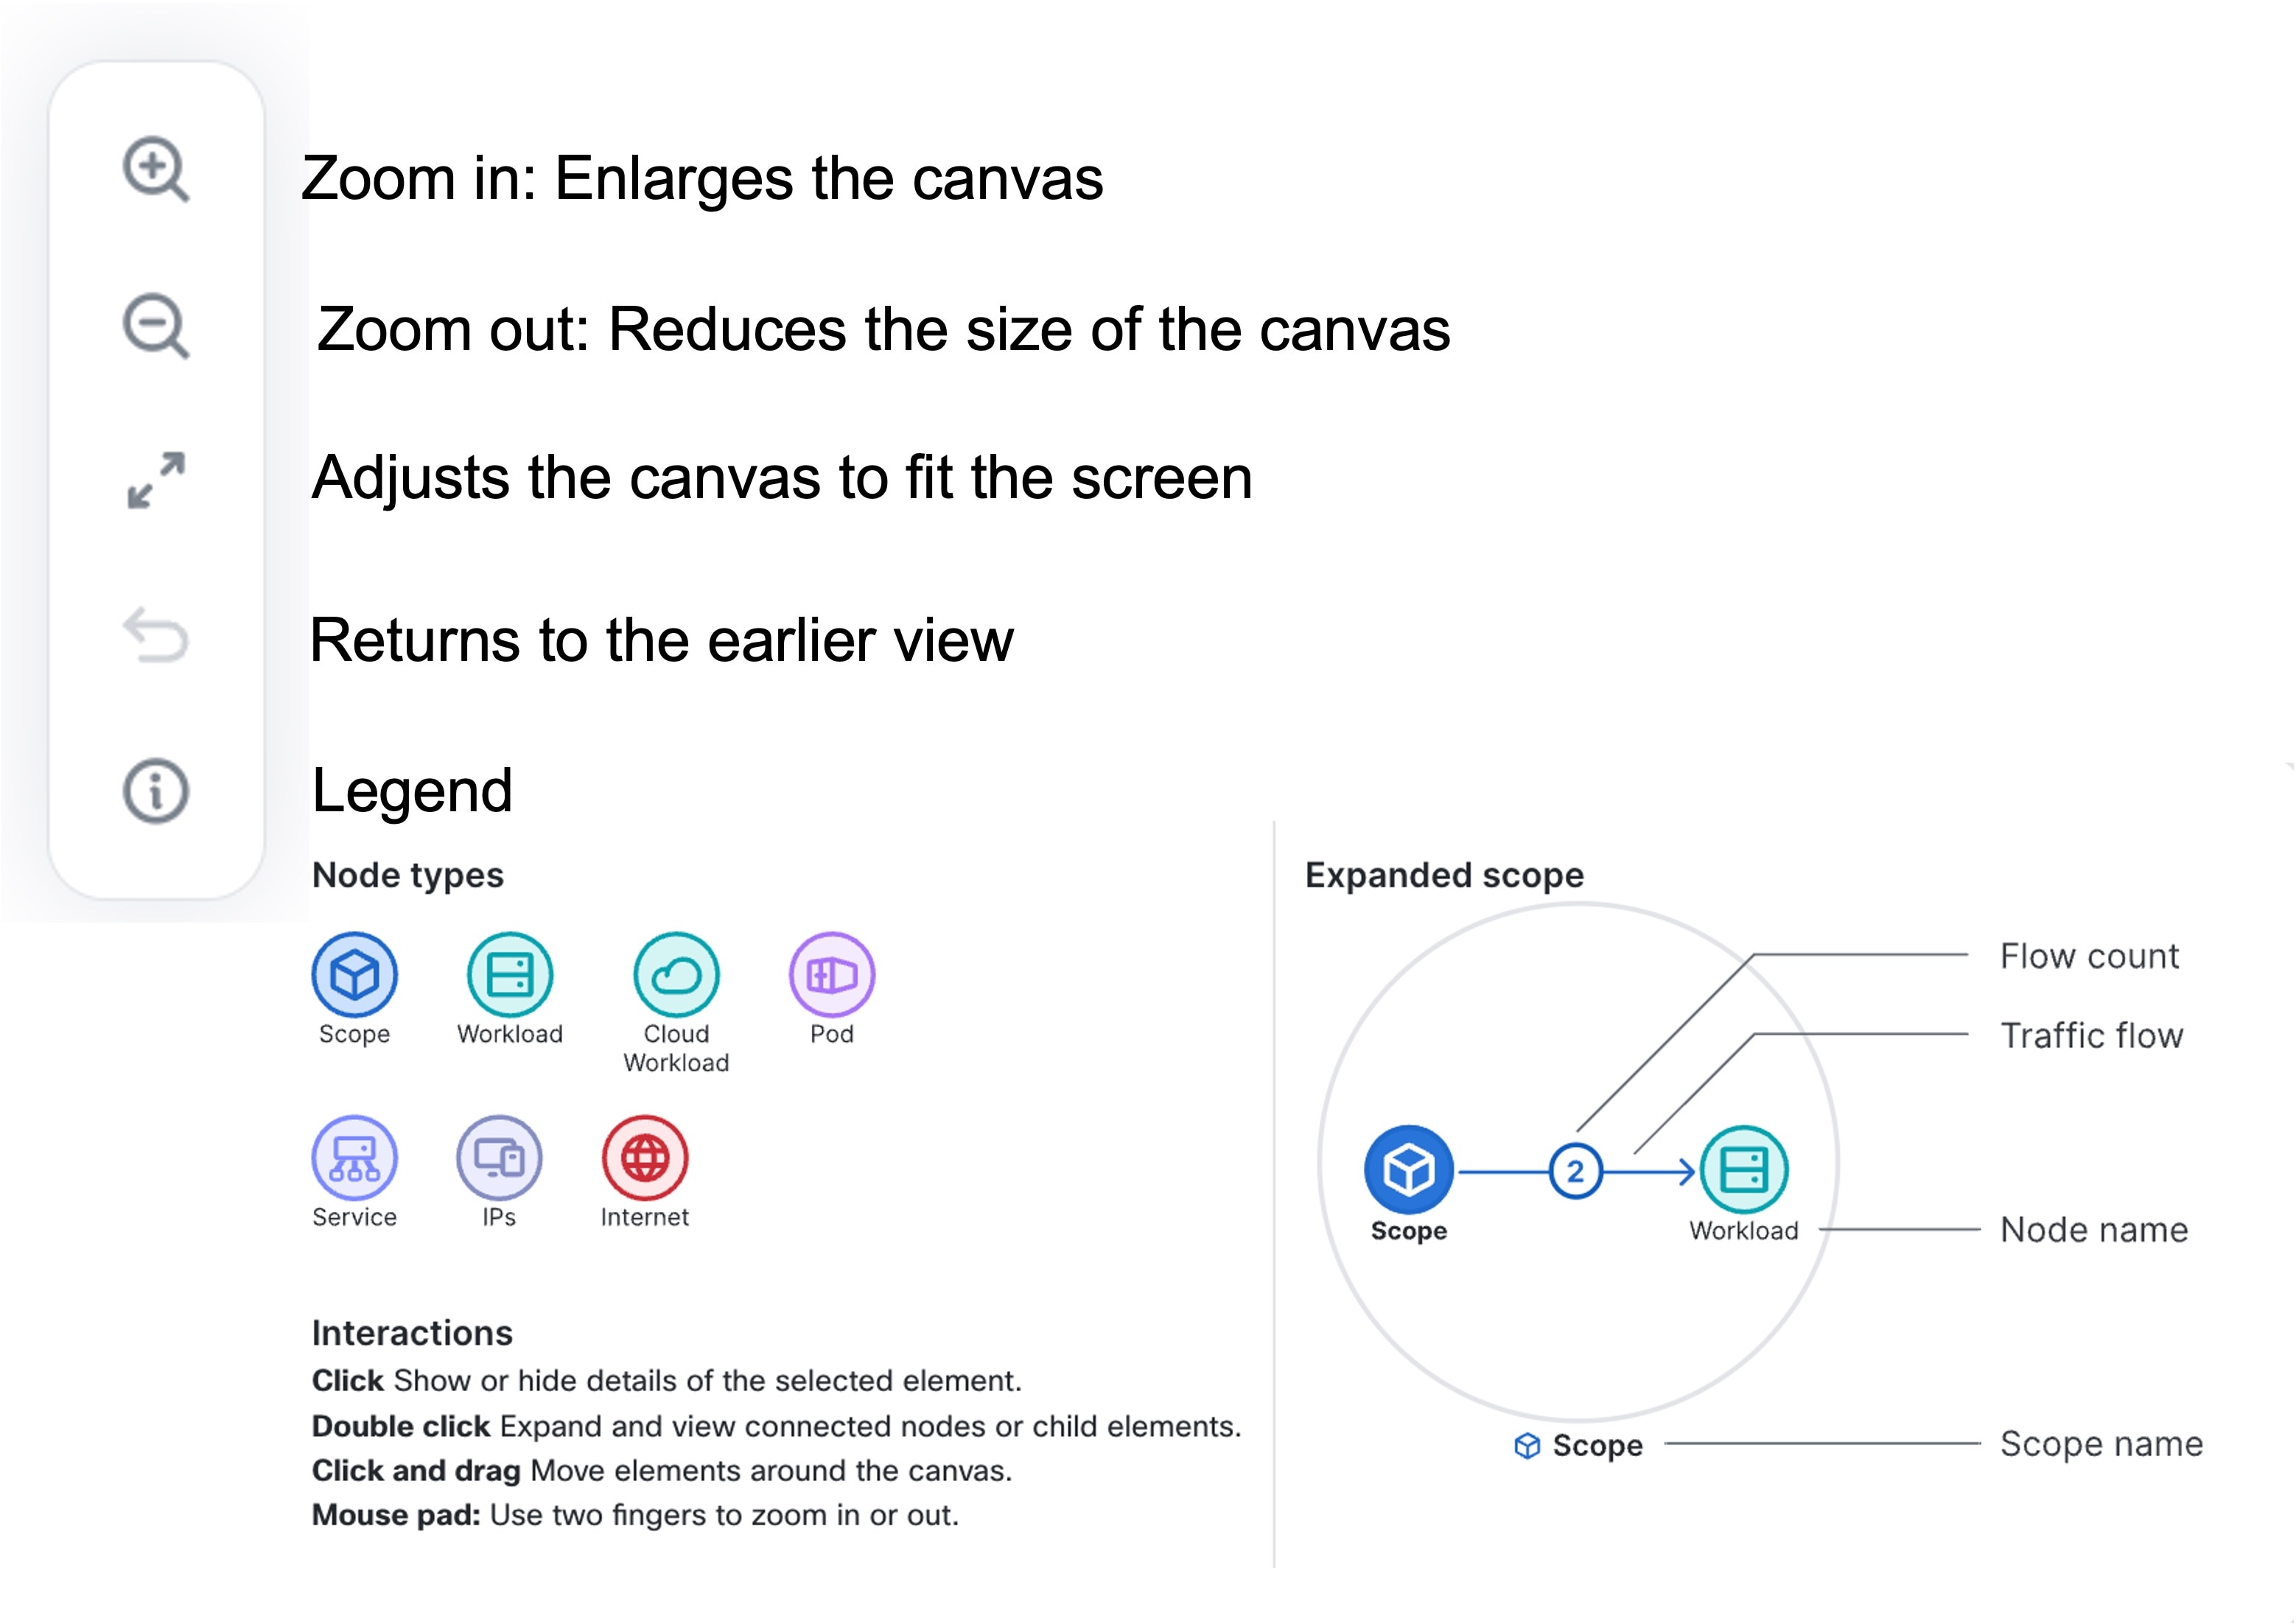
Figure 2. Toolbar options

Nodes refer to a physical or virtual server that is part of a cluster where services and workloads are distributed. A node is a Scope, Workload, Cloud workload, Pods, Services, IP Addresses or the Internet.

Scopes categorize all the inventory using a hierarchical structure. Displays the inflow or outflow traffic flows (Edges) to or from the inventory. Time ranges from the real-time selection and query the flow. Each scope is displayed with its name, consumer name, provider address, total flow count, and only the top 10 provider protocol, port and flow count. For more details about the flow count, navigate to the Flow Page.

Secure Workload Edge (Observed flow): Each root scope on Secure Workload can deploy at the most one Secure Workload Edge appliance. Secure Workload Edge is a control appliance that streams alerts to various notifiers and collects inventory metadata from network access controllers, such as Cisco ISE.

Benefits of Global Visualization

Global Visualization offers a suite of benefits that enhance the clarity and depth of network traffic analysis. Some of the key features of Global Visualization are:

  • Holistic overview of the network: Views of traffic flows from scopes and inventory when an agent is installed on it without running Auto Policy Discovery. This holistic overview lets you see how different parts of the network interact and depend on each other, therefore providing a deeper understanding of the network's structure and flows.

  • Intuitive hierarchical layout: A unique circular map layout, the layout simplifies the representation of hierarchical relationships within the network formed by scopes and inventory. You can drill down from high-level scopes, for example, by application to specific IP addresses.

  • Real-time application mapping: Near real-time mapping and visibility for microsegmentation that displays the communication between root scope and child scopes, between different scopes, between scopes and inventory and so on.

  • Manual refresh: Users can click the Refresh icon on the top bar to refresh the flows for the last hour.

  • Auto refresh: In the default view, the flows are automatically refreshed every 15 minutes if there is no activity in the canvas.

  • Time range for flow data: Displays the time range for the flow data to display real-time data. Refreshes the flow data for the last 15 minutes, last hour and from the last 24 hours.

  • Filter options for flow data: You can filter the flow data based on the the following

    • Scope name

    • Scope details

    • IP Address

    • Hostname

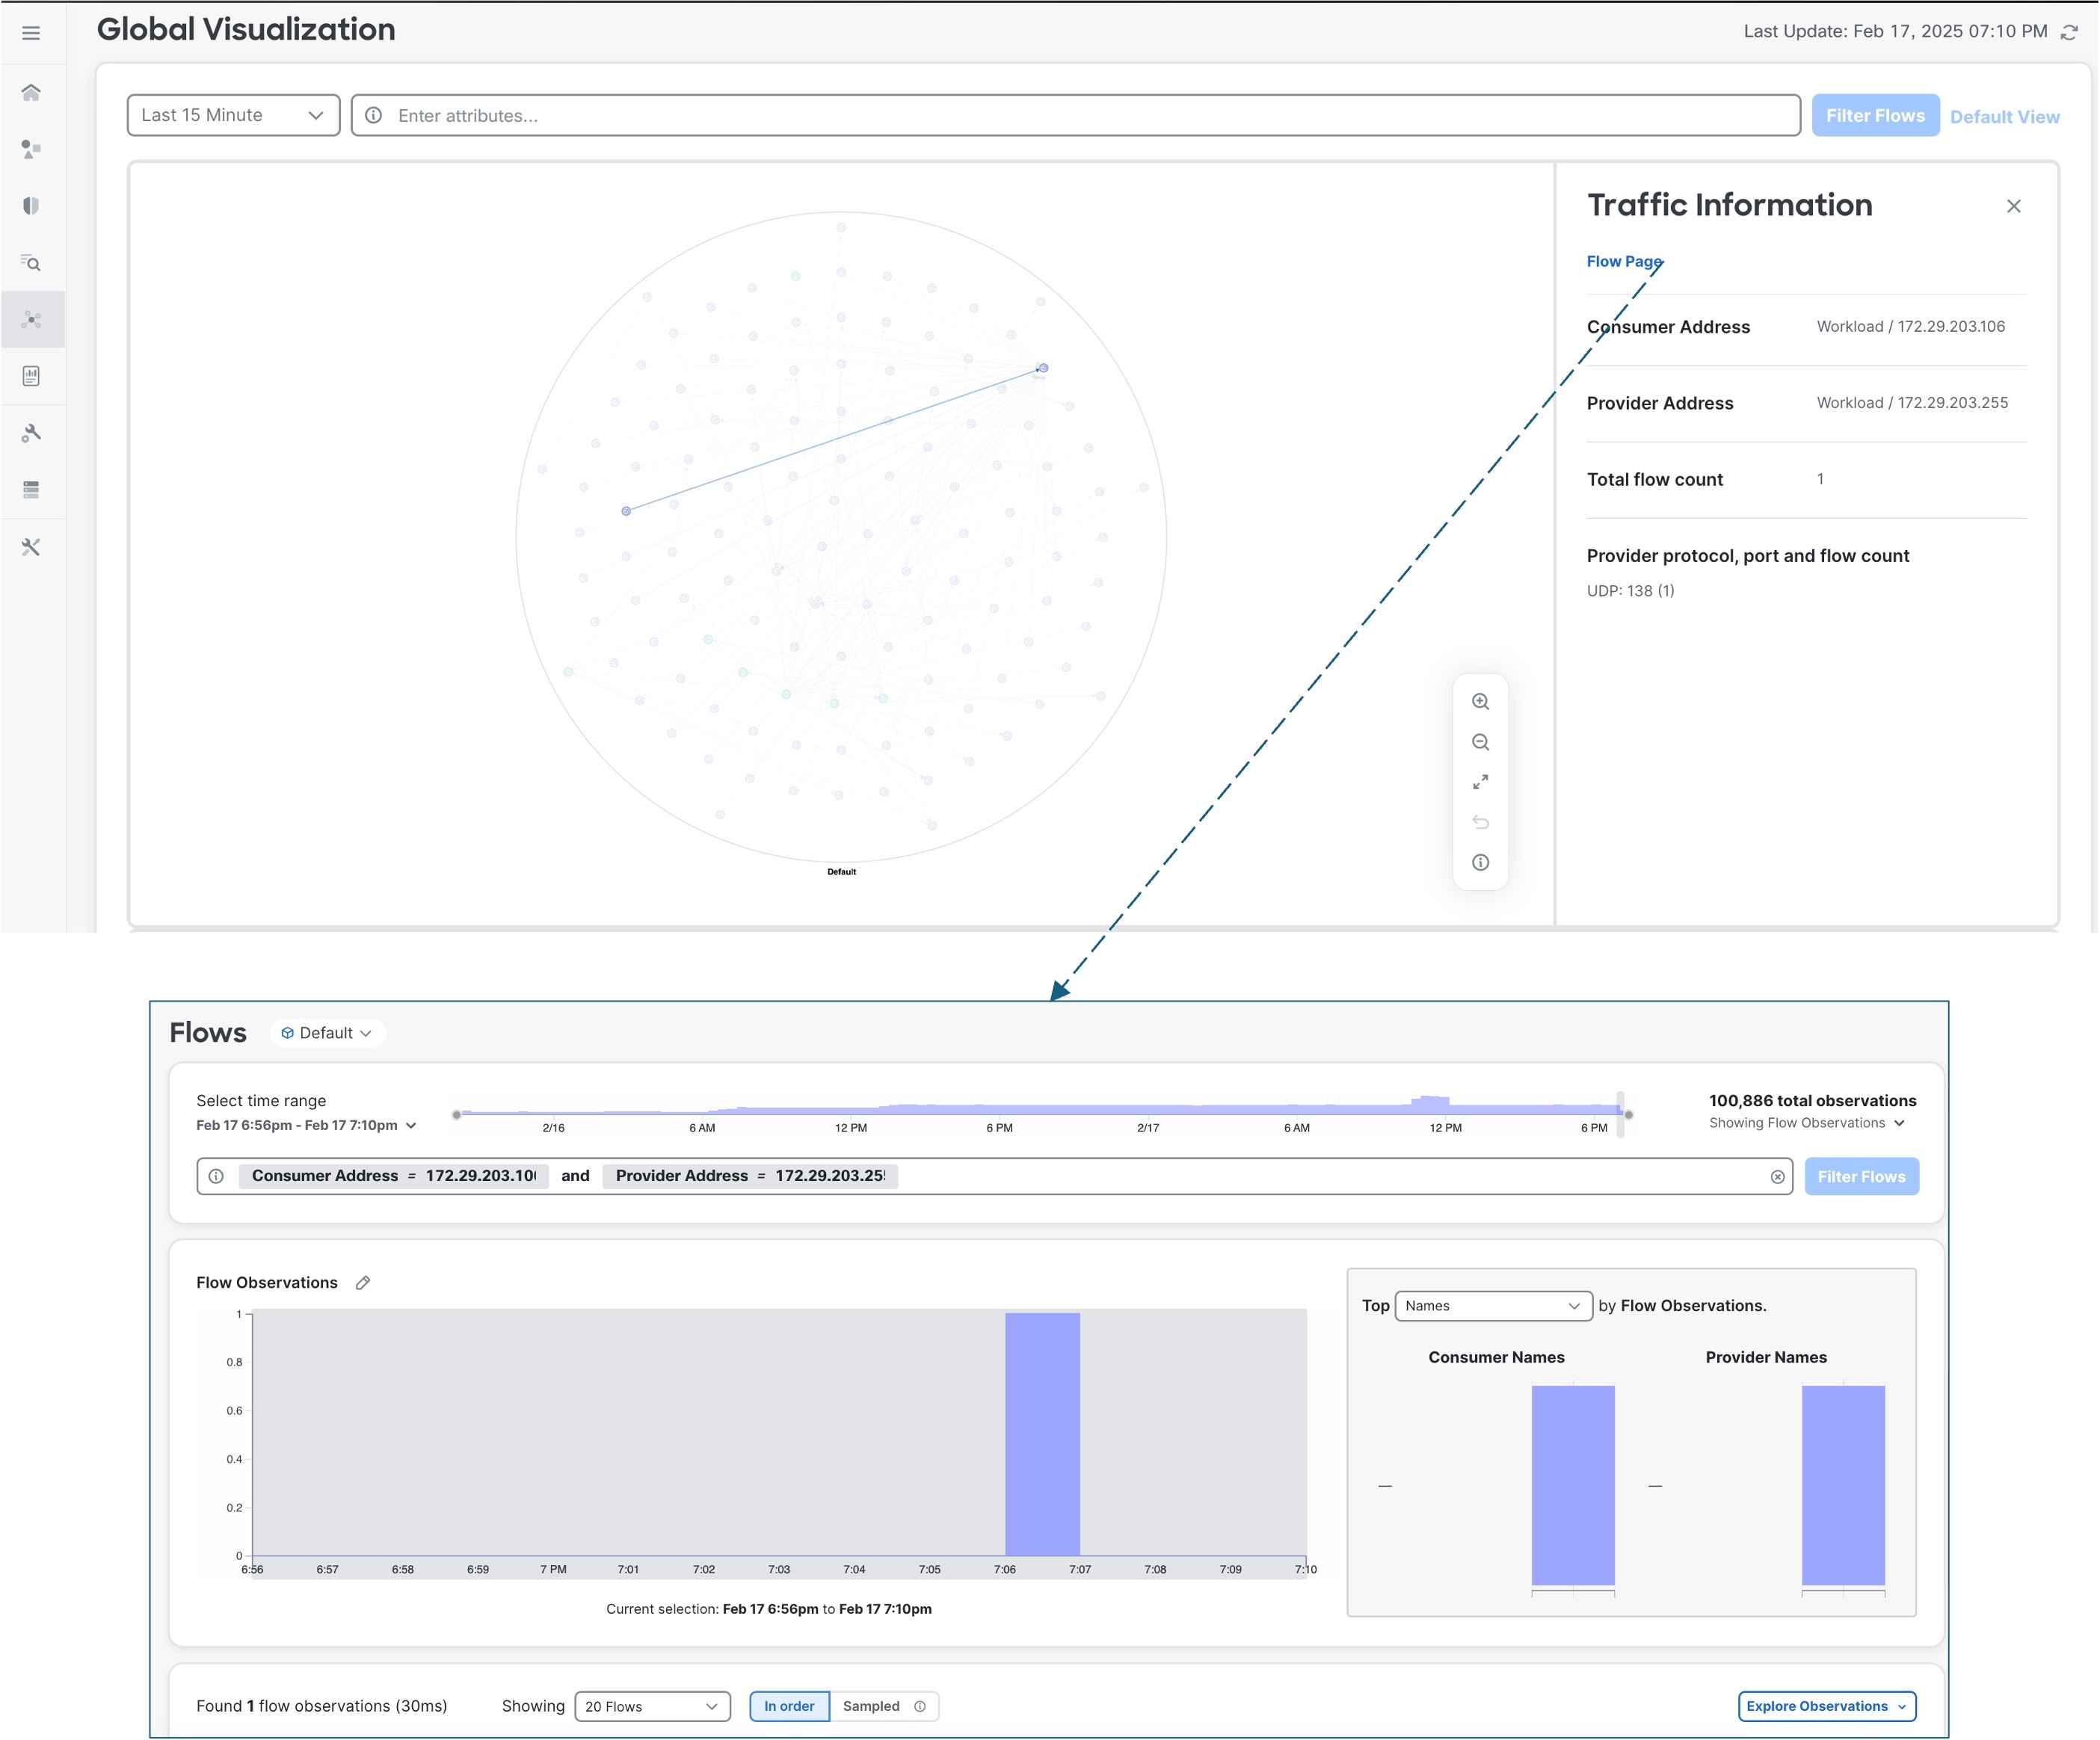
  • Insights into traffic information: Provides complete and detailed view of traffic from these fields-Consumer name, Provider name, Flow counts and the Traffic flow page with consumer or provider name in the filter bar.

    • Figure 3. Traffic information - Flow page
  • Scope view: Displays all inventory that have recorded the flow data for the selected time range:

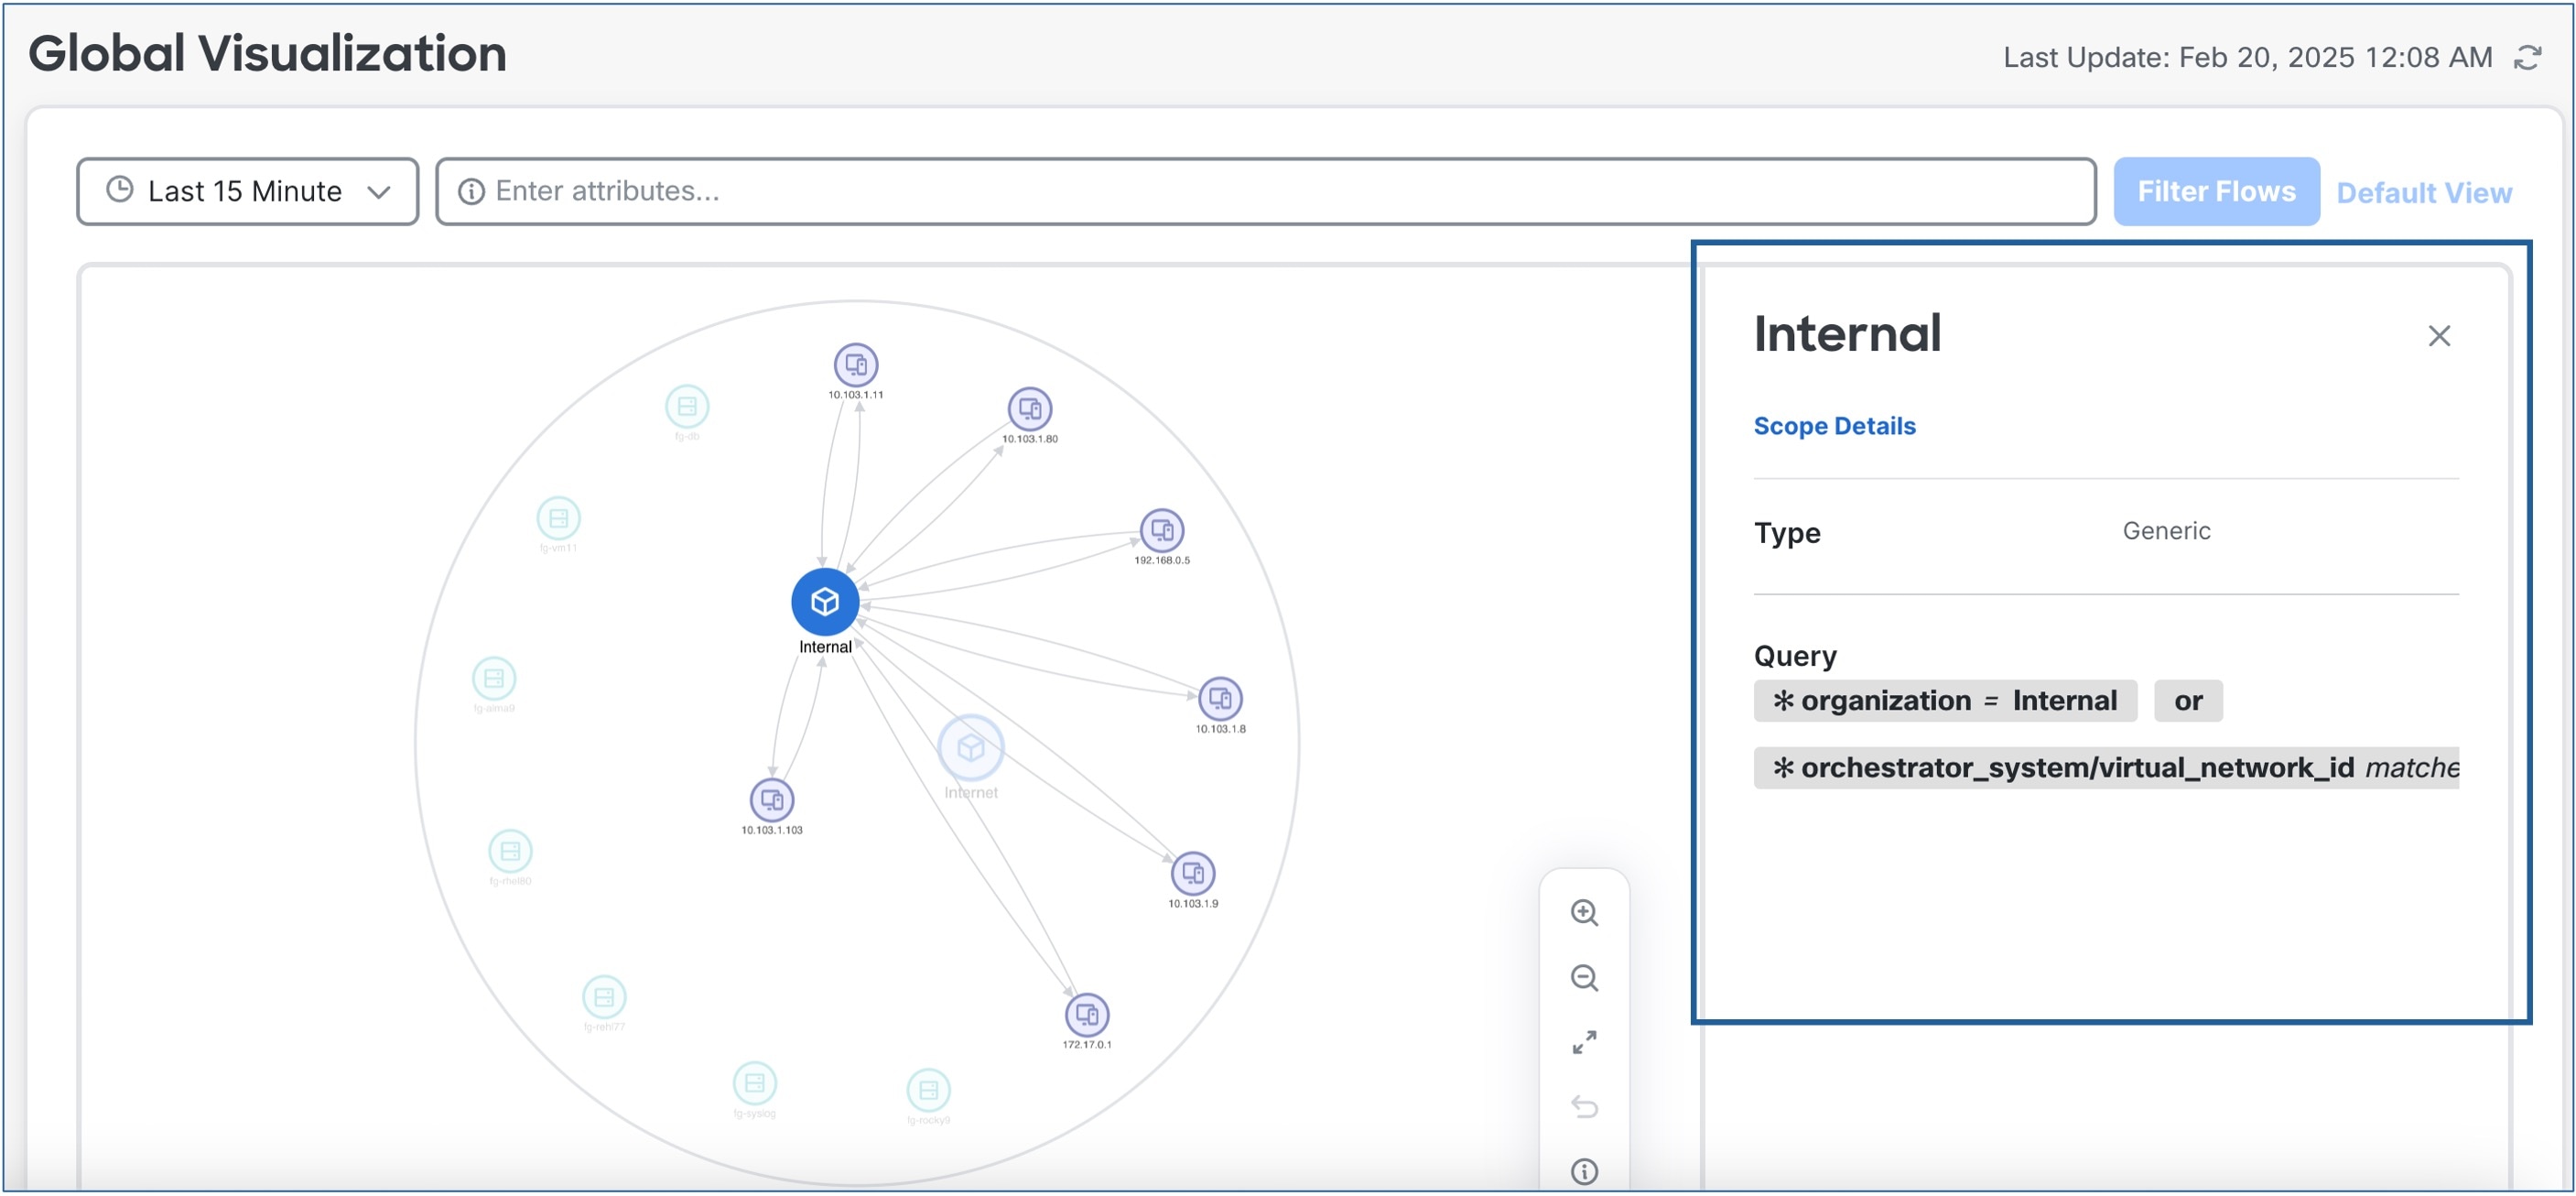
    Figure 4. Scope view
  • Scope name

  • Type

  • Filter query

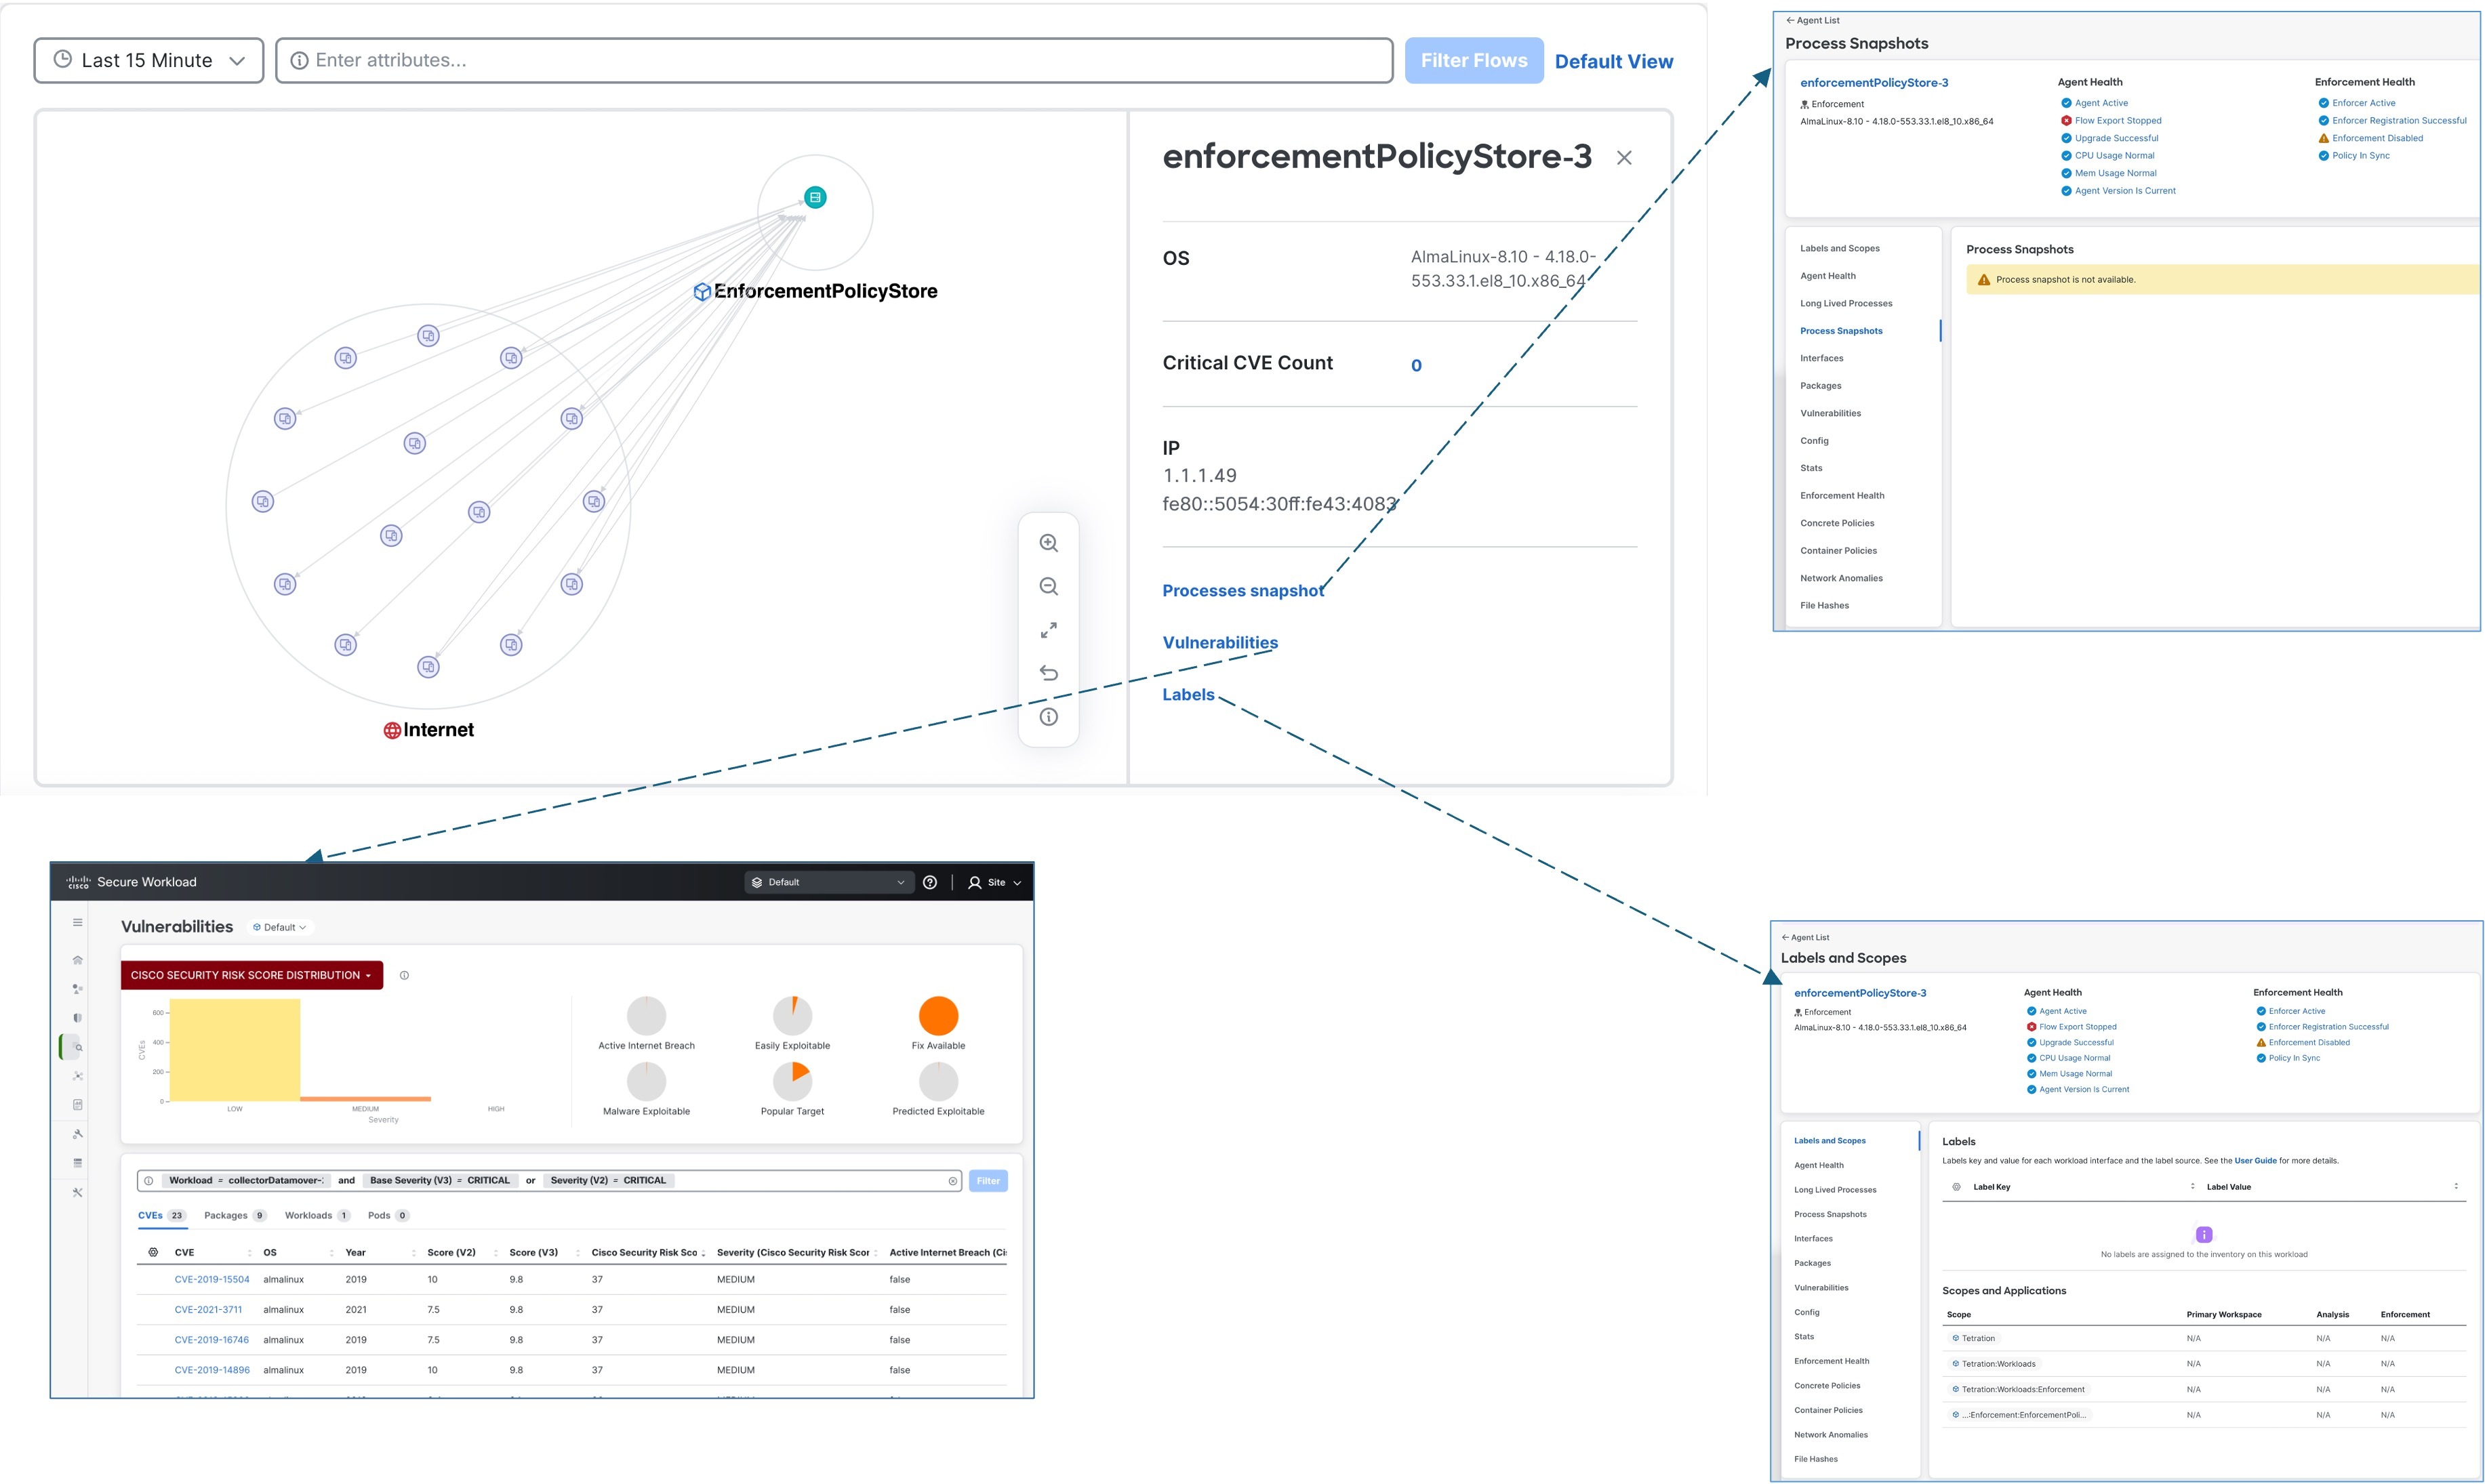
  • Inventory view: Traffic flows within the inventory:

    • Hostname (if agent is installed)

    • FQDN (for agent and agentless workloads)

    • IP addresses

    • Labels

    • Vulnerability counts

    • All workload profile processes

    • All vulnerable packages
      Figure 5. Inventory view

Advantages of Global Visualization

Some of the key advantages of the global visualization feature are:

  • Represents a vast amount of data in a compact space and avoids node-edge overlap.

  • Node sizes expand or contract for scopes that has more inventory, more concentrated connections, or critical nodes that have large amount of inventory.

  • Highlights traffic flows and makes it simple to identify patterns or anomalies at a glance.