-
- Administration User Interface Reference
- Guest Access User Interface Reference
- Web Portals Customization Reference
- Policy User Interface Reference
- Operations User Interface Reference
- Network Access Flows
- Switch and Wireless LAN Controller Configuration Required to Support Cisco ISE Functions
- Supported Management Information Bases in Cisco ISE
- Monitoring and Troubleshooting Service in Cisco ISE
- Device Configuration for Monitoring
- Network Process Status
- Network Authentications
- Profiler Activity and Profiled Endpoints
- Troubleshooting the Profiler Feed
- Posture Compliance
- Cisco ISE Alarms
- Log Collection
- Live Authentications
- RADIUS Authentication Troubleshooting Tool
- Troubleshoot Unexpected RADIUS Authentication Results
- Execute Network Device Tool
- Execute IOS Show Commands to Check Configuration
- Evaluate Configuration Validator Tool
- Troubleshoot Network Device Configuration Issues
- Posture Troubleshooting Tool
- Troubleshoot Endpoint Posture Failure
- Use TCP Dump to Monitor Network Traffic
- Save a TCP Dump File
- Compare Unexpected SGACL for an Endpoint or User
- Egress Policy Diagnostic Flow
- Troubleshoot Connectivity Issues in a Trustsec-Enabled Network with SXP-IP Mappings
- Troubleshoot Connectivity Issues in a Trustsec-Enabled Network with IP-SGT Mappings
- Device SGT Tool
- Troubleshoot Connectivity Issues in a Trustsec-Enabled Network by Comparing Device SGT Mappings
Monitoring and Troubleshooting
Monitoring and Troubleshooting Service in Cisco ISE
The Monitoring and troubleshooting service is a comprehensive identity solution for all Cisco ISE run-time services and uses the following components:
-
Monitoring—Provides a real-time presentation of meaningful data representing the state of access activities on a network. This insight allows you to easily interpret and affect operational conditions.
-
Troubleshooting—Provides contextual guidance for resolving access issues on networks. You can then address user concerns and provide a resolution in a timely manner.
-
Reporting—Provides a catalog of standard reports that you can use to analyze trends and monitor system performance and network activities. You can customize reports in various ways and save them for future use.
- Cisco ISE Dashboard
- Network Privilege Framework
- NPF Event Flow Process
- User Roles and Permissions for Monitoring and Troubleshooting Capabilities
- Data Stored in Monitoring Database
Cisco ISE Dashboard
The Cisco ISE dashboard, or home page ( Home > Summary), is the landing page that appears after you log in to the Cisco ISE administration console. The dashboard is a centralized management console consisting of metric meters along the top of the window, with dashlets below. The default dashboards are Summary, Endpoints, Guests, Vulnerability, and Threat.
The dashboard’s real-time data provides an at-a-glance status of the devices and users that are accessing your network as well as the system health overview.
 Note | You must have Adobe Flash Player installed in your browser to be able to view the dashlets and all the corresponding drill down pages properly. |
Network Privilege Framework
The dashboard shows the activity on the Network Privilege Framework (NPF), and provides detailed information on the various components.
The NPF is composed of the three tiers outlined in the following table:
NPF authentication and authorization generates a flow of events. The events from the different sources are then collected by Cisco ISE monitoring and troubleshooting tools and summarized. You can view the authentication and authorization results on the dashboard or choose to run any number of reports.
NPF Event Flow Process
The NPF authentication and authorization event flow uses the process described in the following table:
An unknown agentless identity is profiled with web authorization. |
|
User Roles and Permissions for Monitoring and Troubleshooting Capabilities
Monitoring and troubleshooting capabilities are associated with default user roles. The tasks you are allowed to perform are directly related to your assigned user role.
Data Stored in Monitoring Database
The Cisco ISE monitoring service collects and stores data in a specialized monitoring database. The rate and amount of data utilized to monitor network functions may require a node dedicated solely to monitoring. If your Cisco ISE network collects logging data at a high rate from Policy Service nodes or network devices, a Cisco ISE node dedicated to monitoring is recommended.
To manage the information stored in the Monitoring database, you are required to perform full and incremental backups of the database. This includes purging unwanted data, and then restoring the database.
Device Configuration for Monitoring
The Monitoring node receives and uses data from devices on the network to populate the dashboard display. To enable communication between the Monitoring node and the network devices, switches and Network Access Devices (NADs) must be configured properly.
Network Process Status
You can view process status for the network from the Cisco ISE dashboard using the System Summary dashlet. For example, when processes like the application server or database fail, an alarm is generated and you can view the results using the System Summary dashlet.
The color of the system status icon indicates the health of your system:
Monitor Network Process Status
Network Authentications
You can view the passed and failed network authentications from the Authentications dashlet. It provides data on the user or type of device, location, and the identity group to which the user or device belongs. The sparklines along the top of the dashlet represent distribution over the last 24 hours and the last 60 minutes.
Monitor Network Authentications
Profiler Activity and Profiled Endpoints
The Profiled Endpoint dashlet focuses on the endpoints on the network that have matched profiles, providing profile data for each endpoint. For example, the statistics allow you to determine the type of device, its location, and its IP address. The sparklines along the top of the dashlet represent endpoint activity over the last 24 hours and last 60 minutes.
The Profiled Endpoint dashlet represents the total number of endpoints that have been profiled on the network for the last 24 hours, including those that are unknown. It is not a representation of how many endpoints are currently active on the network. Sparkline metrics at the top of the dashlet show time specific values for the last 24 hours and 60 minutes.
Determine Profiler Activity and Profiled Endpoints
Troubleshooting the Profiler Feed
If the Test was able to connect to the Cisco Feed server, then you will see a popup that says that the test connection was successful.
If the connection failed, the test button area will contain a response from the server, similar to the following example, where the bold part of the message shows the important part of the message:
Test result: Failure: FeedService test connection failed : Feed Service unavailable : SocketTimeoutException invoking https://ise.cisco.com:8443/feedserver/feed/serverinfo: sun.security.validator.ValidatorException:PKIX path building failed: Sun.security.provider.certpath.SunCertPathBuilderException Unable to find valid certification path to requested target
Here are some possible error messages and actions to take:
-
Unable to find valid certification path to requested target - The certificate that the Feed server used is not valid. Verify that you have enabled the Verisign certificates.
-
No route to host - Verify that you have a working connection to an outside network from the ISE server.
-
UnknownHostException (at the beginning of the error message) - Verify that you have a working connection to an outside network from the ISE server.
Posture Compliance
The Posture Compliance dashlet provides information on the users who are accessing the network and whether they meet posture compliance. Data is shown on the devices that are currently connected to the network. The stack bars show noncompliance statistics that are arranged according to operating system and other criteria. Sparklines represent the percentage of compliant versus noncompliant posture attempts.
Check Posture Compliance
Cisco ISE Alarms
Alarms notify you of critical conditions on a network and are displayed in the Alarms dashlet. They also provide information on system activities, such as data purge events. You can configure how you want to be notified about system activities, or disable them entirely. You can also configure the threshold for certain alarms.
Most alarms do not have an associated schedule and are sent immediately after an event occurs. At any given point in time, only the latest 15,000 alarms are retained.
If the event re-occurs, then the same alarms are suppressed for a minimum duration of two hours. During the time that the event re-occurs, depending up on the trigger, it may take up to three hours for the alarms to re-appear.
The following table lists all the Cisco ISE alarms, descriptions and their resolution.
Alarms are not triggered when you add users or endpoints to Cisco ISE.
- Add Custom Alarms
- Cisco ISE Alarm Notifications and Thresholds
- Enable and Configure Alarms
- Cisco ISE Alarms for Monitoring
- View Monitoring Alarms
Add Custom Alarms
You can edit or delete the custom alarms. System-defined alarms cannot be deleted. But you can edit these alarms.
To add an alarm:
Cisco ISE Alarm Notifications and Thresholds
You can enable or disable Cisco ISE alarms and configure alarm notification behavior to notify you of critical conditions. For certain alarms you can configure thresholds like maximum failed attempts for Excessive Failed Attempts alarm or maximum disk utilization for High Disk Utilization alarm.
Enable and Configure Alarms
Cisco ISE Alarms for Monitoring
Cisco ISE provides system alarms which notify you whenever any critical system condition occurs. Alarms that are generated by Cisco ISE are displayed in the Alarm dashlet. These notifications automatically appear in the alarm dashlet.
The Alarm dashlet displays a list of recent alarms, which you can select from to view the alarm details. You can also receive notification of alarms through e-mail and syslog messages.
View Monitoring Alarms
Log Collection
Monitoring services collect log and configuration data, store the data, and then process it to generate reports and alarms. You can view the details of the logs that are collected from any of the servers in your deployment.
Alarm Syslog Collection Location
If you configure monitoring functions to send alarm notifications as syslog messages, you need a syslog target to receive the notification. Alarm syslog targets are the destinations where alarm syslog messages are sent.
You must also have a system that is configured as a syslog server to be able to receive syslog messages. You can create, edit, and delete alarm syslog targets.
Note | Cisco ISE monitoring requires that the logging-source interface configuration use the network access server (NAS) IP address. You must configure a switch for Cisco ISE monitoring. |
Live Authentications
You can monitor recent RADIUS authentications as they happen from the Live Authentications page. The page displays the top 10 RADIUS authentications in the last 24 hours. This section explains the functions of the Live Authentications page.
The Live Authentications page shows the live authentication entries corresponding to the authentication events as they happen. In addition to authentication entries, this page also shows the live session entries corresponding to the events. You can also drill-down the desired session to view a detailed report corresponding to that session.
The Live Authentications page provides a tabular account of recent RADIUS authentications, in the order in which they happen. The last update shown at the bottom of the Live Authentications page shows the date of the server, time, and timezone.
When a single endpoint authenticates successfully, two entries appear in the Live Authentications page: one corresponding to the authentication record and another corresponding to the session record (pulled from session live view). Subsequently, when the device performs another successful authentication, the repeat counter corresponding to the session record is incremented. The Repeat Counter that appears in the Live Authentications page shows the number of duplicate radius authentication success messages that are suppressed.
See the Live Authentication data categories that are shown by default that are described in the Recent RADIUS Authentications section.
You can choose to view all of the columns, or to display only selected data columns. After selecting the columns that you want to appear, you can save your selections.
Monitor Live Authentications
| Step 1 | Choose . |
| Step 2 | Select a time interval from the Refresh drop-down list to change the data refresh rate. |
| Step 3 | Click the Refresh icon to manually update the data. |
| Step 4 | Choose an option from the Show drop-down list to change the number of records that appear. |
| Step 5 | Choose an option from the Within drop-down list to specify a time interval. |
| Step 6 | Click Add or Remove Columns and choose the options from the drop-down list to change the columns that are shown. |
| Step 7 | Click Save at the bottom of the drop-down list to save your modifications. |
| Step 8 | Click
Show Live Sessions
to view live RADIUS sessions.
You can use the dynamic Change of Authorization (CoA) feature for the Live Sessions that allows you to dynamically control active RADIUS sessions. You can send reauthenticate or disconnect requests to a Network Access Device (NAD). |
Filter Data in Live Authentications Page
With the filters in the Live Authentications page, you can filter out information that you need and troubleshoot network authentication issues quickly. You can filter records in the Authentication (live logs) page and view only those records that you are interested in. The authentication logs contain many details and filtering the authentications from a particular user or location helps you scan the data quickly. You can use several operators that are available on various fields in the Live Authentications page to filter out records based on your search criteria.
-
'abc' - Contains 'abc'
-
'!abc' - Does not contain 'abc'
-
'{}' - Is empty
-
'!{}' - Is not empty
-
'abc*' - Starts with 'abc'
-
'*abc' - Ends with 'abc'
-
'\!', '\*', '\{', '\\' - Escape
The Escape option allows you to filter text with special characters (including the special characters used as filters). You must prefix the special character with a backward slash (\). For example, if you want to view the authentication records of users with identity "Employee!," enter "Employee\!" in the identity filter text box. In this example, Cisco ISE considers the exclamation mark (!) as a literal character and not as a special character.
In addition, the Status field allows you to filter out only passed authentication records, failed authentications, live sessions, and so on. The green check mark filters all passed authentications that occurred in the past. The red cross mark filters all failed authentications. The blue i icon filters all live sessions. You can also choose to view a combination of these options.
Global Search for Endpoints
You can use the global search box available at the top of the Cisco ISE home page to search for endpoints. You can use any of the following criteria to search for an endpoint:
You should enter at least three characters for any of the search criteria in the Search field to display data.
The search result provides a detailed and at-a-glance information about the current status of the endpoint, which you can use for troubleshooting. Search results display only the top 25 entries. It is recommended to use filters to narrow down the results.
The following figure shows an example of the search result.
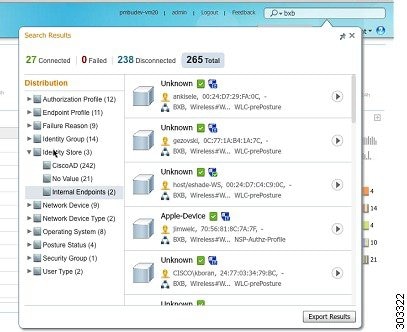
You can use any of the properties in the left panel to filter the results. You can also click on any endpoint to see more detailed information about the endpoint, such as:
Session Trace for an Endpoint
You can use the global search box available at the top of the Cisco ISE home page to get session information for a particular endpoint. When you search with a criteria, you get a list of endpoints. Click on any of these endpoints to see the session trace information for that endpoint. The following figure shows an example of the session trace information displayed for an endpoint.
Note | The dataset used for search is based on Endpoint ID as indexes. Therefore, when authentication occurs, it is mandatory to have Endpoint IDs for the endpoints for those authentications to include them in the search result set. 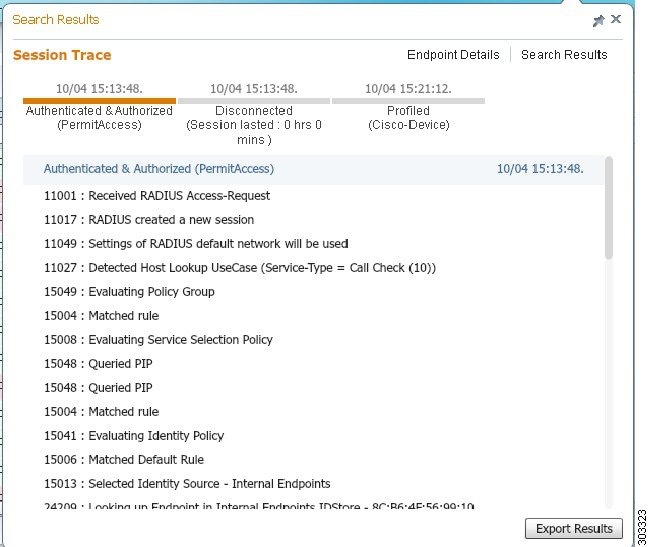 |
You can use the clickable timeline at the top to see major authorization transitions. You can also export the results in .csv format by clicking the Export Results button. The report gets downloaded to your browser.
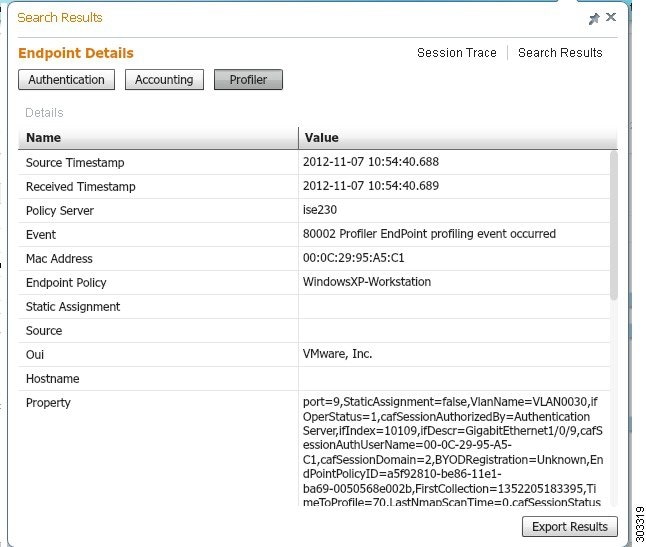
You can click on the Endpoint Details link to see more authentication, accounting, and profiler information for a particular endpoint. The following figure shows an example of endpoint details information displayed for an endpoint.
Session Removal from the Directory
Sessions are cleaned from the session directory on the Monitoring and Troubleshooting node as follows:
Authentication Summary Report
You can troubleshoot network access for a specific user, device, or search criteria based on attributes that are related to the authentication requests. You do this by running an Authentication Summary report.
Troubleshoot Network Access Issues
| Step 1 | Choose . | ||
| Step 2 | Filter the report for Failure Reasons. | ||
| Step 3 | Review the data in the
Authentication by Failure Reasons section of the report to troubleshoot your
network access problem.
|
Diagnostic Troubleshooting Tools
Diagnostic tools help you diagnose and troubleshoot problems on a Cisco ISE network and provide a detailed instructions on how to resolve problems. You can use these tools to troubleshoot authentications and evaluate the configuration of any network device on your network, including Trustsec devices.
- RADIUS Authentication Troubleshooting Tool
- Troubleshoot Unexpected RADIUS Authentication Results
- Execute Network Device Tool
- Execute IOS Show Commands to Check Configuration
- Evaluate Configuration Validator Tool
- Troubleshoot Network Device Configuration Issues
- Posture Troubleshooting Tool
- Troubleshoot Endpoint Posture Failure
RADIUS Authentication Troubleshooting Tool
This tool allows you to search and select a RADIUS authentication or an Active Directory related RADIUS authentication for troubleshooting when there is an unexpected authentication result. You might use this tool if you expected an authentication to pass, but it failed or if you expected a user or machine to have a certain level of privileges, and the user or machine did not have those privileges.
-
Searching RADIUS authentications based on Username, Endpoint ID, Network Access Service (NAS) IP address, and reasons for authentication failure for troubleshooting, Cisco ISE displays authentications only for the system (current) date.
-
Searching RADIUS authentications based on NAS Port for troubleshooting, Cisco ISE displays all NAS Port values since the beginning of the previous month to the current date.
Note
When searching RADIUS authentications based on NAS IP address and Endpoint ID fields, a search is first performed in the operational database, and then in the configuration database.
Troubleshoot Unexpected RADIUS Authentication Results
| Step 1 | Choose . |
| Step 2 | Specify the search criteria in the fields as needed. |
| Step 3 | Click Search to display the RADIUS authentications that match your search criteria. If you are searching for AD related authentication, and an Active Directory server is not configured in your deployment, a message saying 'AD not configured' is displayed. |
| Step 4 | Select a RADIUS authentication record from the table, and click Troubleshoot. If you need to troubleshoot AD related authentication, go to the Diagnostics Tool under Administration > Identity Management > External Identity Sources > Active Directory > AD node. |
| Step 5 | Click User Input Required, modify the fields as needed, and then click Submit. |
| Step 6 | Click Done. |
| Step 7 | Click Show Results Summary after the troubleshooting is complete. |
| Step 8 | To view a diagnosis, the steps to resolve the problem, and a troubleshooting summary, click Done. |
Execute Network Device Tool
The Execute Network Device Command diagnostic tool allows you to run the show command on any network device. The results are exactly what you would see on a console, and can be used to identify problems in the configuration of the device. You can use it when you suspect that the configuration is wrong, you want to validate it, or if you are just curious about how it is configured.
Execute IOS Show Commands to Check Configuration
Evaluate Configuration Validator Tool
You can use this diagnostic tool to evaluate the configuration of a network device and identify any configuration problems. The Expert Troubleshooter compares the configuration of the device with the standard configuration.
Troubleshoot Network Device Configuration Issues
| Step 1 | Choose . |
| Step 2 | Enter the Network Device IP address of the device whose configuration you want to evaluate, and specify other fields as necessary. |
| Step 3 | Select the configuration options to compare against the recommended template. |
| Step 4 | Click Run. |
| Step 5 | Click User Input Required, and modify the fields as necessary. |
| Step 6 | Check the check boxes next to the interfaces that you want to analyze, and click Submit. |
| Step 7 | Click Show Results Summary. |
Posture Troubleshooting Tool
The Posture Troubleshooting tool helps you find the cause of a posture-check failure to identify the following:
Which endpoints were successful in posture and which were not.
If an endpoint failed in posture, what steps failed in the posture process.
You determine this information by filtering requests based on parameters, such as username, MAC address, and posture status.
Troubleshoot Endpoint Posture Failure
TCP Dump Utility to Validate the Incoming Traffic
This is a tool to sniff the packet, when you want to examine that the expected packet really reached a node. For example, when there is no incoming authentication or log indicated in the report, you may suspect that there is no incoming traffic or that the incoming traffic cannot reach Cisco ISE. In such cases, you can run this tool to validate.
You can configure the TCP Dump options and then collect data from the network traffic to help you troubleshooting a network issue.
 Caution | Starting a TCP Dump automatically deletes a previous dump file. To save a previous dump file, perform the task, as described in the Saving a TCP Dump File section before you begin a new TCP Dump session. |
- Use TCP Dump to Monitor Network Traffic
- Save a TCP Dump File
- Compare Unexpected SGACL for an Endpoint or User
- Egress Policy Diagnostic Flow
- Troubleshoot Connectivity Issues in a Trustsec-Enabled Network with SXP-IP Mappings
- Troubleshoot Connectivity Issues in a Trustsec-Enabled Network with IP-SGT Mappings
- Device SGT Tool
- Troubleshoot Connectivity Issues in a Trustsec-Enabled Network by Comparing Device SGT Mappings
Use TCP Dump to Monitor Network Traffic
-
The Network Interface drop-down list in the TCP Dump page displays only the network interface cards (NICs) that have an IPv4 or IPv6 address configured. By default, all NICs are connected on a VMware, and therefore, NICs are configured with an IPv6 address and displayed in the Network Interface drop-down list.
-
You must have Adobe Flash Player installed on the Cisco ISE administration node to be able to view the tcpdump file.
| Step 1 | Choose . |
| Step 2 | Choose a Host Name as the source for the TCP Dump utility. Inline Posture nodes are not supported. |
| Step 3 | Choose a Network Interface to monitor from the drop-down list. |
| Step 4 | Set Promiscuous Mode by
clicking the radio button to On or Off. The default is On.
Promiscuous mode is the default packet sniffing mode in which the network interface passes all traffic to the system’s CPU. We recommend that you leave it set to On. |
| Step 5 | In the Filter text box, enter
a boolean expression on which to filter.
Standard tcpdump filter expressions are supported, such as the following: |
| Step 6 | Click Start to begin monitoring the network. |
| Step 7 | Click Stop when you have collected a sufficient amount of data, or wait for the process to conclude automatically after accumulating the maximum number of packets which is 500,000. |
Note | Cisco ISE does not support frames greater than 1500 MTU (jumbo frames). |
Save a TCP Dump File
You should have successfully completed the task, as described in the Using TCP Dump to Monitor network Traffic section.
Note | You can also access TCPdump through the Cisco ISE CLI. For more information, refer to the Cisco Identity Services Engine CLI Reference Guide. |
Compare Unexpected SGACL for an Endpoint or User
| Step 1 | Choose . |
| Step 2 | Enter the Network Device IP address of the Trustsec device whose SGACL policy you want to compare. |
| Step 3 | Click Run. |
| Step 4 | Click User Input Required and modify the fields as necessary. |
| Step 5 | Click Submit. |
| Step 6 | Click Show Results Summary to view the diagnosis and suggested resolution steps. |
Egress Policy Diagnostic Flow
The egress policy diagnostic tool uses the process described in the following table for its comparison:
Connects to the device with the IP address that you provided, and obtains the access control lists (ACLs) for each source and destination SGT pair. |
|
Checks the egress policy that is configured in Cisco ISE and obtains the ACLs for each source and destination SGT pair. |
|
Compares the SGACL policy that is obtained from the network device with the SGACL policy that is obtained from Cisco ISE. |
|
Displays the source and destination SGT pair if there is a mismatch. Also, displays the matching entries as additional information. |
Troubleshoot Connectivity Issues in a Trustsec-Enabled Network with SXP-IP Mappings
| Step 1 | Choose . |
| Step 2 | Enter the network device IP address of the network device, and click Select. |
| Step 3 | Click
Run, and then
click
User Input
Required and modify the necessary fields.
The Expert Troubleshooter retrieves Trustsec SXP connections from the network device and again prompts you to select the peer SXP devices. |
| Step 4 | Click User Input Required, and enter the necessary information. |
| Step 5 | Check the check box of the peer SXP devices for which you want to compare SXP mappings, and enter the common connection parameters. |
| Step 6 | Click Submit. |
| Step 7 | Click Show Results Summary to view the diagnosis and resolution steps. |
Troubleshoot Connectivity Issues in a Trustsec-Enabled Network with IP-SGT Mappings
Device SGT Tool
For devices that are enabled with the Trustsec solution, each network device is assigned an SGT value through RADIUS authentication. The Device SGT diagnostic tool connects to the network device (with the IP address that you provide) and obtains the network device SGT value. It then checks the RADIUS authentication records to determine the SGT value that was assigned most recently. Finally, it displays the Device-SGT pairs in a tabular format, and identifies whether the SGT values are the same or different.
Troubleshoot Connectivity Issues in a Trustsec-Enabled Network by Comparing Device SGT Mappings
Download Endpoint Statistical Data From Monitoring Nodes
You can download statistical data about endpoints that connect to your network from the Monitoring nodes. Key Performance Metrics (KPM), which include the load, CPU usage, authentication traffic data are available that you can use to monitor and troubleshoot issues in your network. From the Cisco ISE Command-Line Interface (CLI), use the application configure ise command and choose options 12 or 13 to download the daily KPM statistics or KPM statistics for the last eight weeks, respectively.
The output of this command provides the following data about endpoints:
-
Total endpoints on your network
-
Number of endpoints that established a successful connection
-
Number of endpoints that failed authentication
-
Total number of new endpoints that have connected each day
-
Total number of endpoints onboarded each day
The output also includes time stamp details, the total number of endpoints that connected through each of the Policy Service Nodes (PSNs) in the deployment, total number of endpoints, active endpoints, load, and authentication traffic details.
Refer to the Cisco Identity Services Engine CLI Reference Guide for more information on this command.
Obtaining Additional Troubleshooting Information
Cisco ISE allows you to download support and troubleshooting information from the Admin portal. You can use the support bundle to prepare diagnostic information for the Cisco Technical Assistance Center (TAC) to troubleshoot problems with Cisco ISE.
Note | The support bundles and debug logs provide advanced troubleshooting information for TAC and are difficult to interpret. You can use the various reports and troubleshooting tools that Cisco ISE provides to diagnose and troubleshoot issues that you are facing in your network. |
- Cisco ISE Support Bundle
- Support Bundle
- Download Cisco ISE Log Files
- Cisco ISE Debug Logs
- Download Debug Logs
Cisco ISE Support Bundle
You can configure the logs that you want to be part of your support bundle. For example, you can configure logs from a particular service to be part of your debug logs. You can also filter the logs based on dates.
The logs that you can download are categorized as follows:
-
Full configuration database—The Cisco ISE configuration database is downloaded in a human-readable XML format. When you are trying to troubleshoot issues, you can import this database configuration in another Cisco ISE node to recreate the scenario.
-
Debug logs—Captures bootstrap, application configuration, run-time, deployment, public key infrastructure (PKI) information and monitoring and reporting.
Debug logs provide troubleshooting information for specific Cisco ISE components. To enable debug logs, see Chapter 11, “Logging”. If you do not enable the debug logs, all the informational messages (INFO) will be included in the support bundle. For more information, see Cisco ISE Debug Logs.
-
Local logs—Contains syslog messages from the various processes that run on Cisco ISE.
-
Core files—Contains critical information that would help identify the cause of a crash. These logs are created when the application crashes and includes heap dumps.
-
Monitoring and reporting logs—Contains information about alerts and reports.
-
System logs—Contains Cisco Application Deployment Engine (ADE)-related information.
-
Policy configuration—Contains policies configured in Cisco ISE in human readable format.
You can download these logs from the Cisco ISE CLI by using the backup-logs command. For more information, refer to the Cisco Identity Services Engine CLI Reference Guide.
Note | For Inline Posture nodes, you cannot download the support bundle from the Admin portal. You must use the backup-logs command from the Cisco ISE CLI to download logs for Inline Posture nodes. |
If you choose to download these logs from the Admin portal, you can do the following:
-
Download only a subset of logs based on the log type such as debug logs or system logs.
-
Download only the latest “n” number of files for the selected log type. This option allows you to control the size of the support bundle and the time taken for download.
Monitoring logs provide information about the monitoring, reporting, and troubleshooting features. For more information about downloading logs, see Download Cisco ISE Log Files.
Support Bundle
You can download the support bundle to your local computer as a simple tar.gpg file. The support bundle will be named with the date and time stamps in the format ise-support-bundle_ise-support-bundle-mm-dd-yyyy--hh-mm.tar..gpg. The browser prompts you to save the support bundle to an appropriate location. You can extract the content of the support bundle and the view the README.TXT file, which describes the contents of the support bundle, as well as how to import the contents of the ISE database if it is included in the support bundle.
Download Cisco ISE Log Files
You can download the Cisco ISE log files to look for more information while troubleshooting issues in your network.
| Step 1 | Choose . |
| Step 2 | Click the node from which you want to download the support bundles. |
| Step 3 | In the Support Bundle tab,
choose the parameters that you want to be populated in your support bundle.
If you include all the logs, your support bundle will be excessively large and the download will take a long time. To optimize the download process, choose to download only the most recent n number of files. |
| Step 4 | Enter the From and To dates for which you want to generate the support bundle. |
| Step 5 | Enter and re-enter the encryption key for the support bundle. |
| Step 6 | Click Create Support Bundle. |
| Step 7 | Click
Download to download the newly-created support
bundle.
The support bundle is a tar.gpg file that is downloaded to the client system that is running your application browser. |
What to Do Next
Download debug Logs for specific components.
Cisco ISE Debug Logs
Debug logs provide troubleshooting information for various Cisco ISE components. Debug logs contain critical and warning alarms generated in the last 30 days and info alarms generated in the last 7 days. While reporting problems, you might be asked to enable these debug logs and send them for diagnosis and resolution of your problems.
Obtain Debug Logs
Cisco ISE Components and the Corresponding Debug Logs
| Component | Debug Log |
|---|---|
| Active Directory | ad_agent.log |
| Cache Tracker | tracking.log |
| Entity Definition Framework (EDF) | edf.log |
| JMS | ise-psc.log |
| License | ise-psc.log |
| Notification Tracker | tracking.log |
| Replication-Deployment | replication.log |
| Replication-JGroup | replication.log |
| Replication Tracker | tracking.log |
| RuleEngine-Attributes | ise-psc.log |
| RuleEngine-Policy-IDGroups | ise-psc.log |
| accessfilter | ise-psc.log |
| admin-infra | ise-psc.log |
| boot-strap wizard | ise-psc.log |
| cisco-mnt | ise-psc.log |
| client | ise-psc.log |
| cpm-clustering | ise-psc.log |
| cpm-mnt | ise-psc.log |
| epm-pdp | ise-psc.log |
| epm-pip | ise-psc.log |
| epsanc | ise-psc.log |
|
anc |
ise-psc.log |
| ers | ise-psc.log |
| guest | ise-psc.log |
| guestauth | ise-psc.log |
| guestportal | ise-psc.log |
| identitystore-AD | ise-psc.log |
| infrastructure | ise-psc.log |
| mdm | ise-psc.log |
| mdm-pip | ise-psc.log |
| mnt-alarm | alarms.log |
| mnt-report | reports.log |
| mydevices | ise-psc.log |
| nsf | ise-psc.log |
| nsf-session | ise-psc.log |
| org-apache | ise-psc.log |
| org-apache-cxf | ise-psc.log |
| org-apache-digester | ise-psc.log |
| posture | ise-psc.log |
| profiler | profiler.log |
| provisioning | ise-psc.log |
| prrt-JNI | prrt-management.log |
| runtime-AAA | prrt-management.log |
| runtime-config | prrt-management.log |
| runtime-logging | prrt-management.log |
| sponsorportal | ise-psc.log |
| swiss | ise-psc.log |
Download Debug Logs
To perform the following task, you must be a Super Admin or System Admin.
| Step 1 | Choose . |
| Step 2 | Click the node from which you want to download the debug logs. |
| Step 3 | Click the
Debug Logs tab.
A list of debug log types and debug logs is displayed. This list is based on your debug log configuration. |
| Step 4 | Click the log file that you
want to download and save it to the system that is running your client browser.
You can repeat this process to download other log files as needed. The following are additional debug logs that you can download from the Debug Logs page: |
Monitoring Database
The rate and amount of data that is utilized by Monitoring functions requires a separate database on a dedicated node that is used for these purposes.
Like Policy Service, Monitoring has a dedicated database that requires you to perform maintenance tasks, such as the topics covered in this section:
- Back Up and Restore of the Monitoring Database
- Monitoring Database Purge
- Guidelines for Purging the Monitoring Database
- Purge Older Monitoring Data
Back Up and Restore of the Monitoring Database
Monitoring database handles large volumes of data. Over time, the performance and efficiency of the monitoring node depends on how well you manage that data. To increase efficiency, we recommend that you back up the data and transfer it to a remote repository on a regular basis. You can automate this task by scheduling automatic backups.
Note | You should not perform a backup when a purge operation is in progress. If you start a backup during a purge operation, the purge operation stops or fails. |
If you register a secondary Monitoring node, we recommend that you first back up the primary Monitoring node and then restore the data to the new secondary Monitoring node. This ensures that the history of the primary Monitoring node is in sync with the new secondary node as new changes are replicated.
Monitoring Database Purge
The purging process allows you to manage the size of the Monitoring database by specifying the number of months to retain data during a purge. The default is three months. This value is utilized when the disk space usage threshold for purging (percentage of disk space) is met. For this option, each month consists of 30 days. A default of three months equals 90 days.
Guidelines for Purging the Monitoring Database
The following are some guidelines to follow relating to monitoring database disk usage:
If the Monitoring database disk usage is greater than 80 percent of the threshold setting, critical alarm is generated indicating that the database size has exceeded the allocated disk size. If the disk usage is greater than 90 percent another alarm is generated.
A purge process runs, creating a status history report that you can view by choosing . An information (INFO) alarm is generated when the purge completes.
Purging is also based on the percentage of consumed disk space for the database. When the consumed disk space for the monitoring database is equal to or exceeds the threshold (the default is 80 percent), the purge process starts. This process deletes only the last seven days of monitoring data, irrespective of what is configured in the Admin portal. It will continue this process in a loop until the disk space is below 80 percent. Purging always checks the Monitoring database disk space limit before proceeding.
Purge Older Monitoring Data
To perform the following task, you must be a Super Admin or System Admin.
| Step 1 | Choose . | ||
| Step 2 | Specify the time period in
months, for which the data will be retained. All the data prior to the
specified time period will be purged. For this option, each month consists of
30 days. The default of three months equals 90 days.
| ||
| Step 3 | Click Submit. | ||
| Step 4 | Verify the success of the data purge by viewing the Data Purging Audit report. |
What to Do Next
Cisco ISE Log Collection
Perform an On-demand Backup
 Feedback