Describes the GUI navigation components within Cisco Cyber Vision, including the home screen, monitoring tools, reporting features, and system management settings. This guide assists users in effectively accessing dashboards, event lists, and configuration options.
Home
The Home page is a dashboard interface that provides a high-level summary of network activity and centralized access to system management tools.
-
Operational Overview tab for protocol distribution and critical events.
-
Security Overview tab for vulnerability and risk score analysis.
-
Navigation bar for accessing core application modules.
Home Page Components and Navigation
The home page is organized into two main tabs that allow users to monitor the industrial network over the last month.
The following tabs are available for monitoring:
-
Operational Overview: Displays the Protocol distribution pie chart, a list of Most critical events , and Preset highlights .
Click Edit favorite presets to change what displays. Select the check boxes of the presets and click Save.
Figure 1. Operational Overview 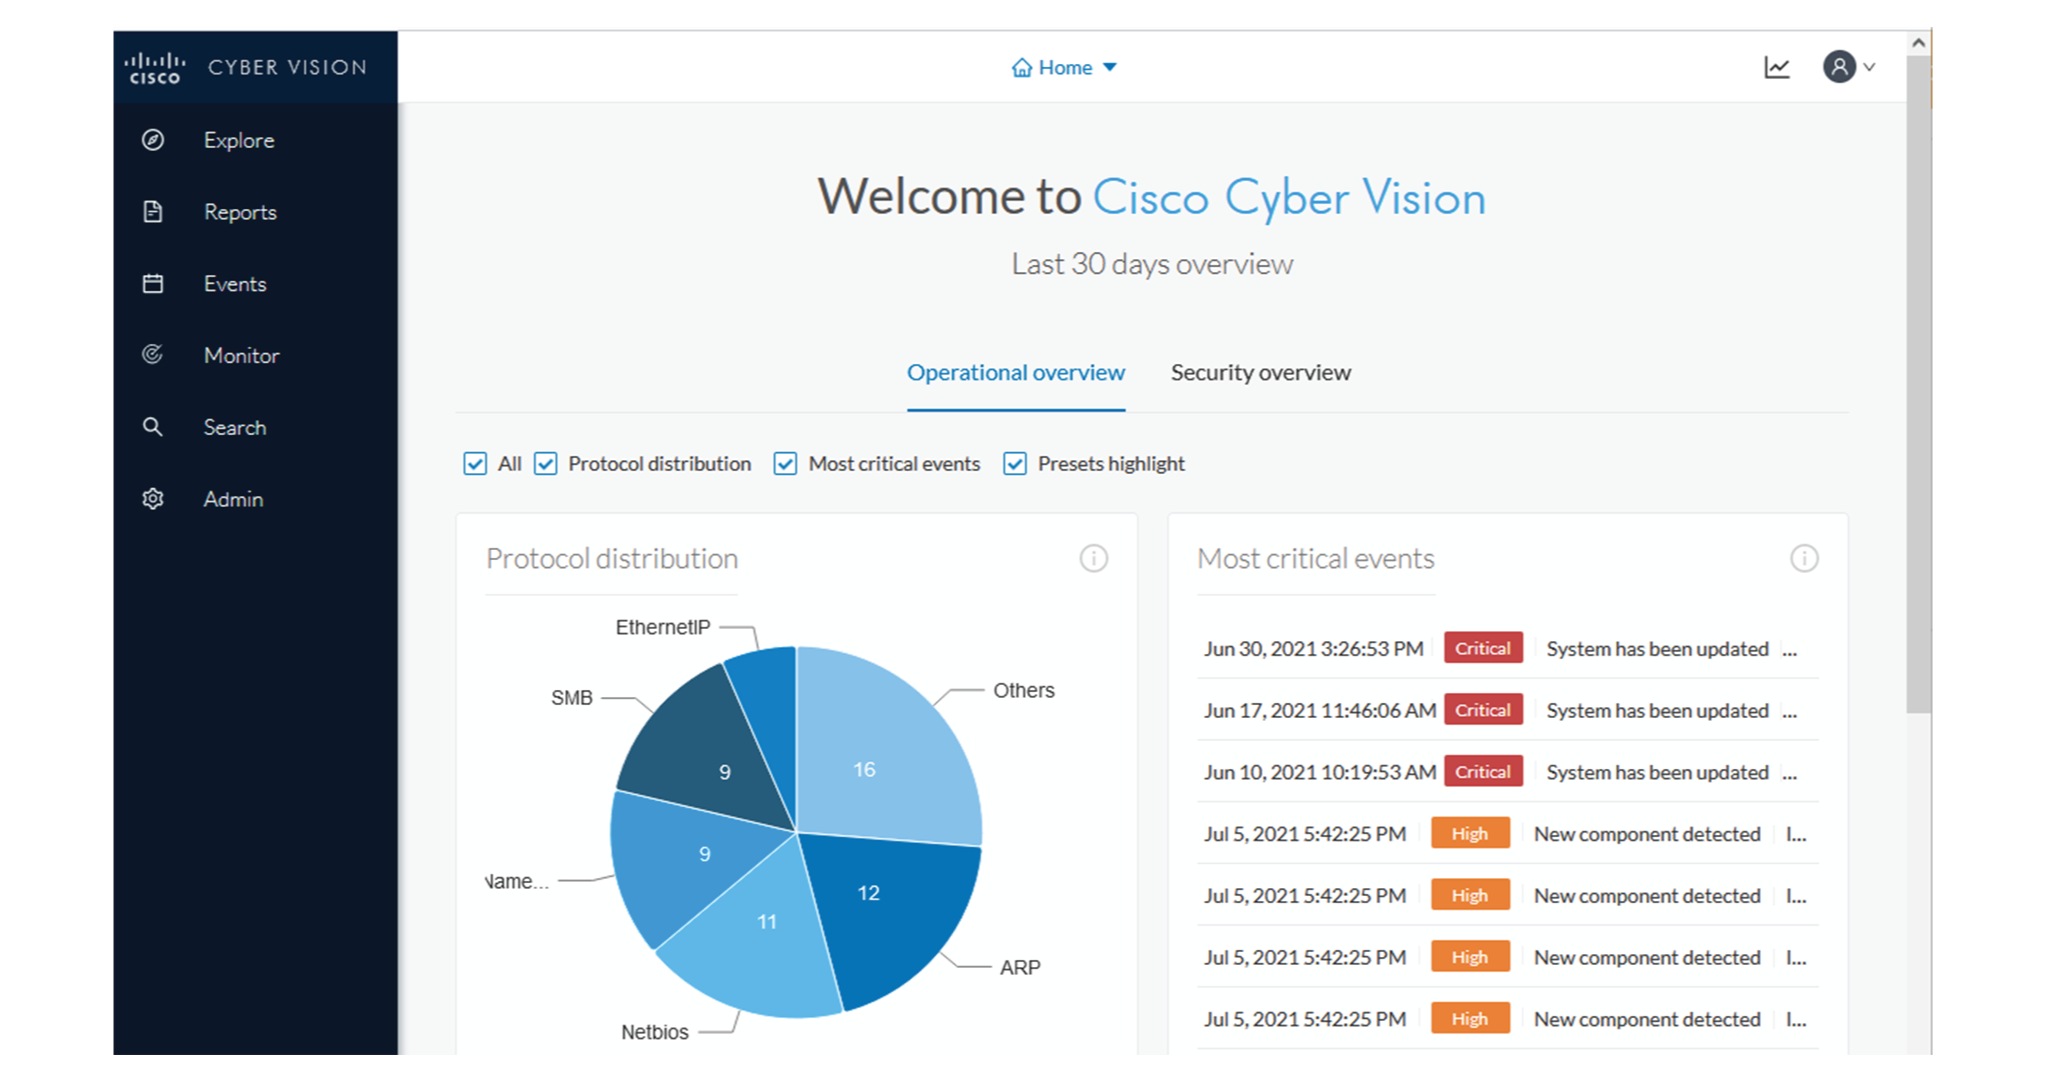
-
Security Overview: Displays the Vulnerable devices per severities ring chart, the Devices by risk score ring chart, and lists for Most critical events , Events by category , and Preset highlights.
Figure 2. Security Overview 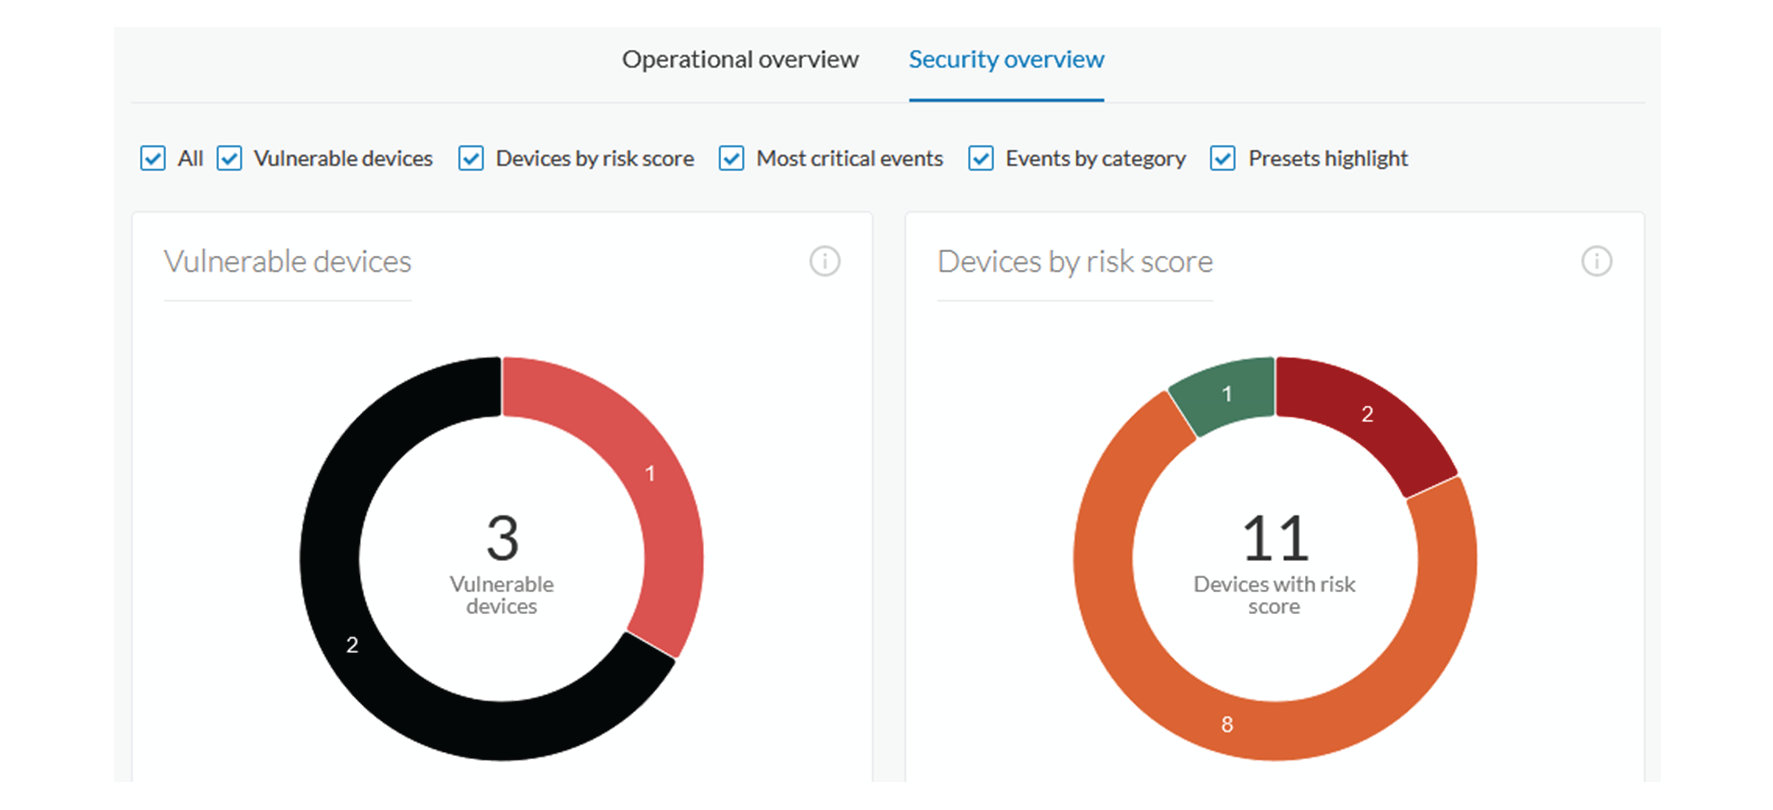
The navigation bar provides access to the following main pages:
-
Explore : Shows the overview of all presets, by defaults or configured.
-
Reports : Shows the Reports page to export valuable information about the industrial network.
-
Events : Shows the Events page which contains graphics and a calendar of all events generated by .
-
Monitor : Shows the Monitor mode page to perform and automatize data comparisons of the industrial network.
-
Search : Shows the searching area to look for precise data in the industrial network.
-
Admin : Shows how to update the system, configure exports parameters, import and export the database, update the Knowledge DB and reset data and system settings.
Detail Panel
A Detail panel is a condensed view about a device, a component, a group of components or an activity's information without changing the background device list or a map.
-
Displays general information about the selected element.
-
Provides editing capabilities for device or component names and group membership.
-
Includes navigation buttons to access technical sheets and specific data categories.
Accessing and Using the Detail Panel
To access a detail panel, click a device, a component or an activity on the map or a list.
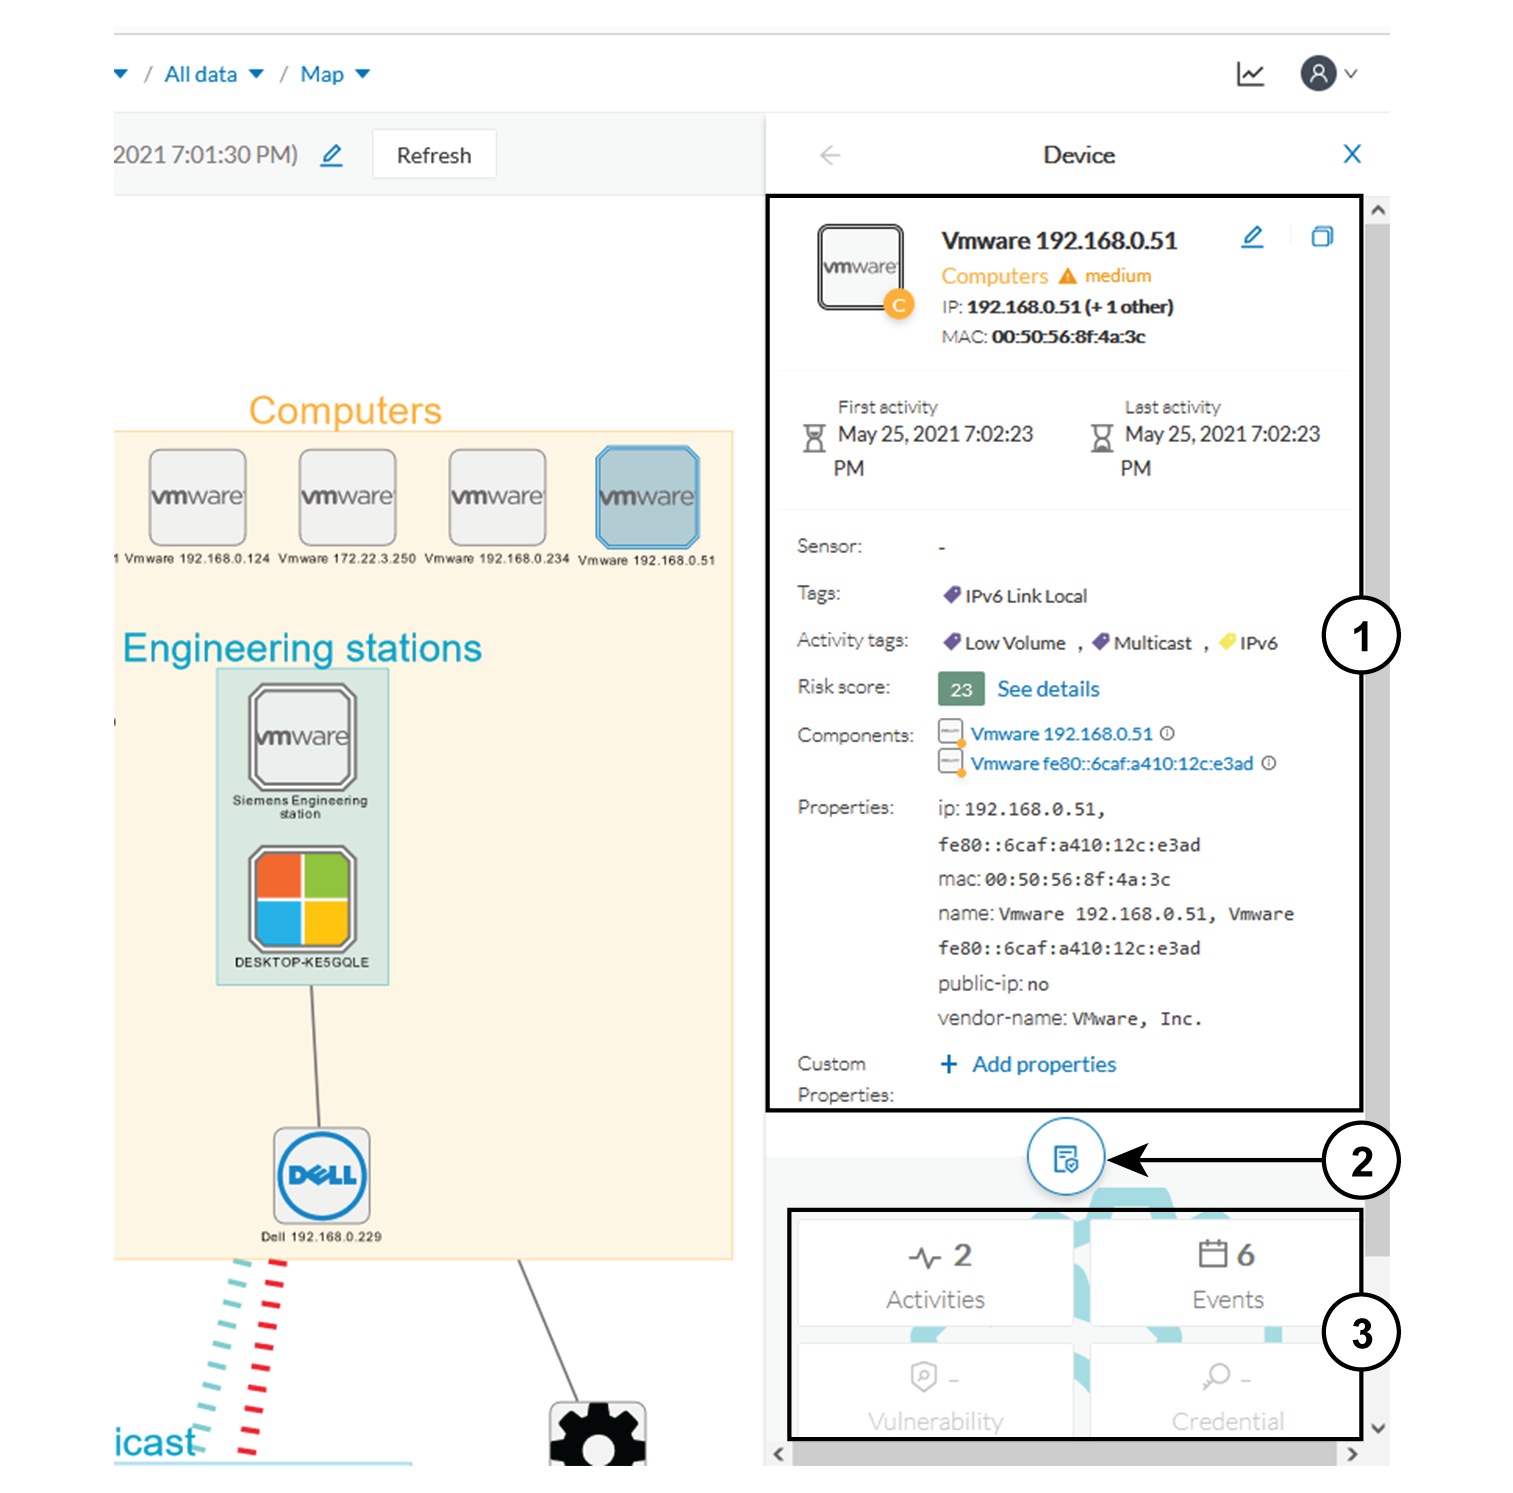
The detail panel layout includes the following components:
-
Upper portion (1) : Provides general information about the element.
-
Round button (2) : Opens the element's technical sheet with all relevant information.
-
Rectangular buttons(3) : Redirect to the corresponding information inside the technical sheet .
Technical sheets
A technical sheet is an interactive documentation view that
-
provides comprehensive information about a device, component, activity, or flow,
-
displays data differently based on the selected element, and
-
allows direct interaction or editing within the sheet.
Access a technical sheet
View the full details of a device, component, or activity by opening its technical sheet.
The technical sheet provides an interactive summary and detailed tabs for each element selected within the application.
Follow these steps to access a technical sheet.Procedure
-
From the main menu, choose Explore.
-
From the top navigation bar, click the drop-down arrow of All Presets and select All Data from the drop-down list.
-
From the top navigation bar, click the drop-down arrow of the third filter and select Map from the drop-down list.
-
Click the Technical sheet icon.
The technical sheet for the selected device, component, or activity opens, displaying the relevant information and interactive functions.
Tabs in a device technical sheet
The top box of the technical sheet recaps the information found in the Detail panel. The rectangular buttons on the right redirect to the corresponding information inside the technical sheet.
The middle portion of the technical sheet contains tabs that vary based on the selected element. For a Device , the following tabs are available:
-
Basics : Shows an element's properties, tags, and associated components.
-
Risk score : Provides overview and detailed views of the risk assessment.
-
Security : Displays component vulnerabilities and credentials.
-
Activity : Shows activity flows, Mini Map , and external communications .
-
Automation : Contains variable accesses.
Additional reference information is available for the following topics:
Access the mini map
Use this procedure to access the Mini Map.
The mini map is a visual representation restricted to a specific device or component and its activities.
Procedure
Reports
A report is an export of industrial network data from traffic captured and processed by Cisco Cyber Vision.
Reports can uncover important information, such as sensitive entry points and acknowledged vulnerabilities for status reports.
Install the Reports extension to use the Reports page. From instruction to install the extension, refer to Install an extension.
Report data and formats
You can create reports from a Preset (default data) in Cisco Cyber Vision or from a custom one.
Reports extensions include .docx and .pdf formats.
Customize reports
You can add a logo, such as your company's logo, to customize a report. Reports display the Cisco logo by default.
Use the table of contents menu to set which content appears in the report.
Create a report
Enable users to create custom reports, generate output, review results, and rerun or download reports as needed.
Before you begin
The Cyber Vision Reports Management extension and Cyber Vision Version must be the same to generate a report.
Only users with Reports write permission can create reports. Users with Reports read permission can download reports.
Procedure
What to do next
After you generate the report, you can perform the following actions:
-
To view and download a report, go to Reports, select the report name, and access download links in the Details panel. Older versions are listed under Previous Reports.
-
To generate a new report, select … under the Actions column and chooseRun Again.
Events
An event is an activity, property, or change involving software or hardware components that helps you identify and track significant activities on the network.
Events include the following:
-
A wrong password entered on the GUI.
-
A new component connected to the network.
-
An anomaly detected in Monitor Mode.
-
A component detected as vulnerable.
The Events page is available to Admin and Product users. To access the Events page, go to from the main menu.
On the Events administration page, you can customize the severity of events. By default, changes apply only to future events. To apply new customized severities to past events, use Apply severity to existing events.
This action is irreversible and can take several minutes to complete.
Select Reset severity to default to reset the severity settings.
Use the toggle buttons to enable or disable Syslog export and Database storage.
These options are active by default. Make sure that syslog is configured before export.
Events dashboard
The Events dashboard is a dashboard that shows event doughnut and line charts.
Doughnut charts display color-coded event severity categories and percentages.
Doughnut charts present event numbers and percentages by category and severity.
Events dashboard filters
The Events dashboard can be accessed by selecting Events from the main menu. You can view the list of events for a category. For more information, refer to Events.
Use the filter in the top-right corner of the Events page to filter events by Day, Week, Month, or Year.
Use the arrows for specific dates.
Doughnut chart details
The doughnut chart opens in List view, filtered by the corresponding category and severity. This view lets you quickly access more event details.
Events graph
The Events graph appears at the bottom of the dashboard page.
Use the filter in the top-right corner to view data by Day, Week, Month, or Year.
Hover over event markers on the line chart to view event counts by category for specific dates. The Cisco Cyber Vision Operations, Inventory Events, and Security Events tabs provides additional details.
Access the event list
List is a chronological view in which you can view and search events.
Use the search bar to find events by MAC and IP addresses, component name, destination and source flow, severity, and category.
You can search events by Day, Week, Month, or Year. Use the arrows for exact dates.
Follow these steps to access event list.
Procedure
-
From the main menu, choose .
-
Click an event result to view more details about the event.
-
When an event is related to sensors, click See Sensor Statistics for more details.
-
When an event is related to a component or an activity, click see Technical Sheet for more details.
Monitor mode
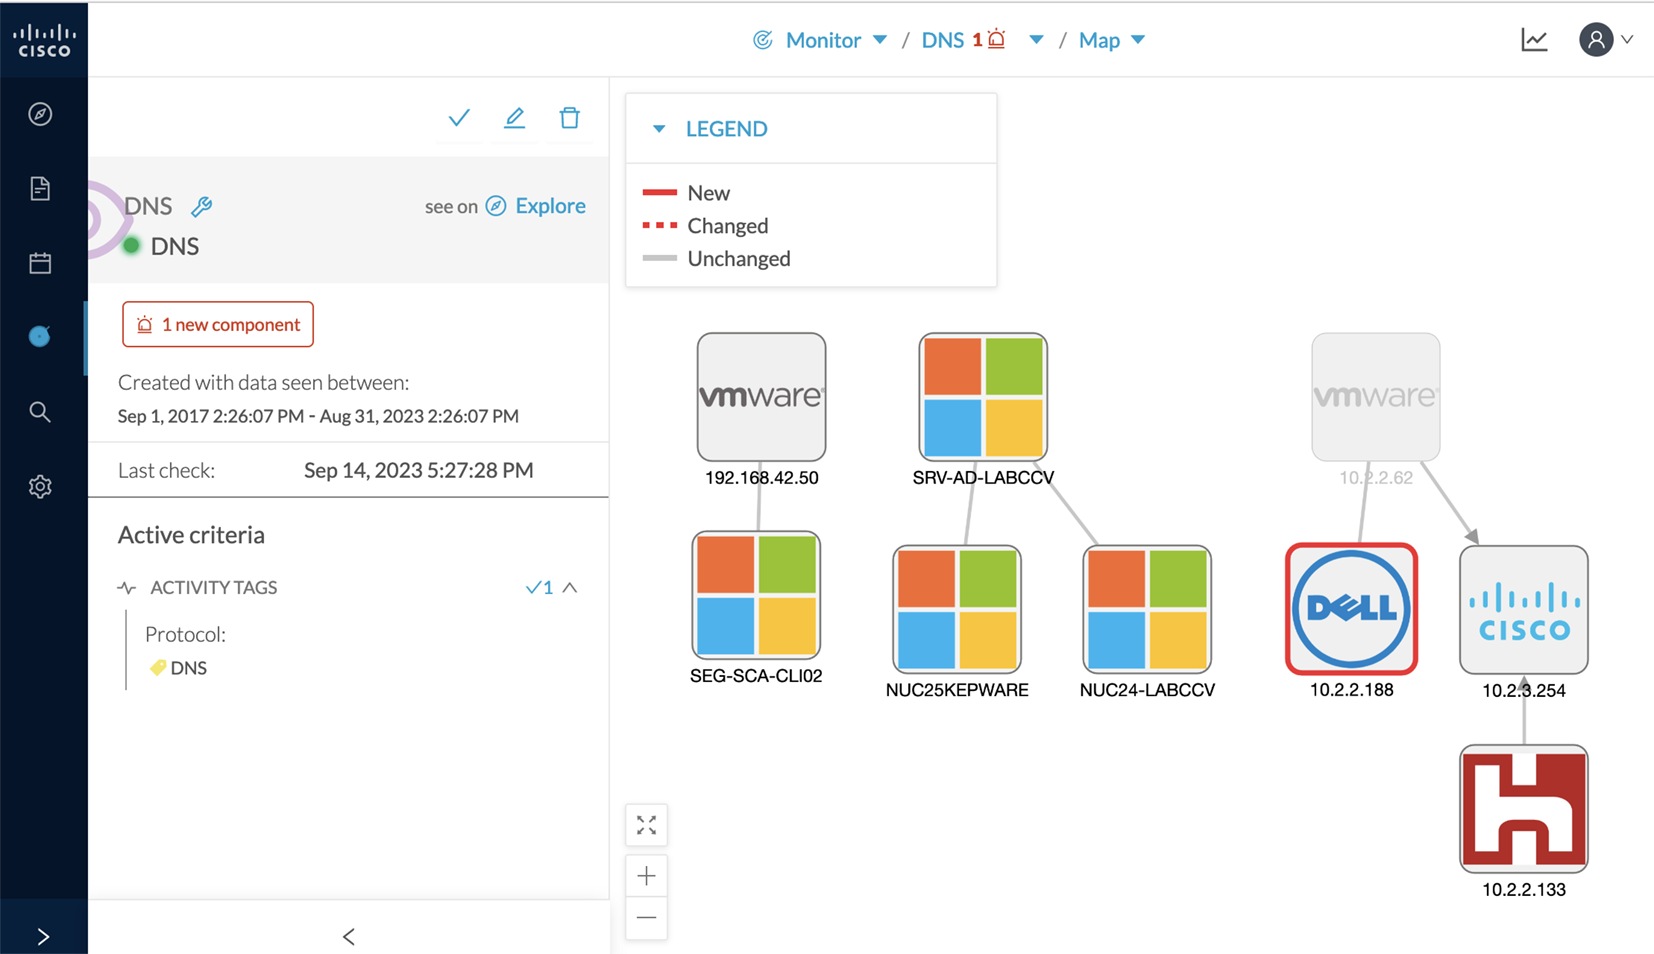
The Monitor mode is a monitoring tool in Cisco Cyber Vision that detects changes inside industrial networks. It shows the evolution of a network's behaviors, predicted or not, based on presets.
Because a network architecture, such as a PLC, switch, or SCADA, is constant and its behaviors tend to be stable over time, an established and configured network is predictable.
However, some behaviors are unpredictable and can compromise a network's operation and security.
When a behavior occurs, normal or abnormal changes are noted as differences in the Monitor mode.
Monitor mode is particularly convenient for large networks because a preset shows a network fragment, and changes are highlighted and managed separately in the Monitor mode views.
Search
Search is a page that enables you to find components among unstructured data. Components can be searched by name, custom name, IP, MAC, tag, and property value.
The Search page is available from the main menu. The search field accepts the content used for a search, and the Search control initiates the search.
Devices are not available on this page yet.
The Save this search as a Preset control creates a preset from search results. Presets automatically update as new data is detected on the network.
When you hover over a component, the technical sheet (2) icon appears. The technical sheet provides access to advanced data about the component.
System statistics
A system statistic is a monitoring metric that
-
reflects the operational status of the Center and sensors,
-
allows administrators to track resource health and usage, and
-
enables early detection of service or network issues.
|
Feature |
Release Information |
Feature Description |
|---|---|---|
|
PCAP capture on the Cyber Vision Center interface |
Release 5.4.x |
You can capture PCAP data directly from the Cyber Vision Center interface, in addition to sensor based capture. |
|
Sensor collected data quality report |
Release 5.4.x |
Easily monitor the quality of your sensor statistics with the Status Overview page. See real-time details for each sensor. Stay informed and ensure your data is always reliable. |
System health statuses
To view system health, click the System statistics icon on any Cisco Cyber Vision Center page.
The System Health page helps you:
-
Check if all background processes, such as services and extensions, are running correctly.
-
See if background queues that collect data from sensors are free of congestion.
|
Status |
Description |
|---|---|
|
Service Status |
|
|
Queue Status |
|
System statistics for Center and sensors
The System Statistics page displays
-
key operational data for both the Center and its sensors, and
-
helps you monitor system health and troubleshoot issues.
|
Chart |
Applicability |
Description |
|---|---|---|
|
System Health |
Center and sensors |
Displays CPU, RAM, and disk usage statistics for each sensor. Minimum, maximum, and average values are shown. The table also shows current usage and hardware score to help you get support. |
|
Captured Packets |
Sensors |
The chart shows the number of packets that the sensor captures on the industrial network interface in bytes per second. It also displays the number of dropped packets. When packet drops occur, this indicates that the sensor is overloaded and traffic is being lost. |
|
Network Interfaces Bandwidth |
Center and sensors |
The line charts display bandwidth for Collection and Industrial network interfaces. Bytes received and sent per second by Center are shown in the charts.
|
|
Disk I/O (B/s) |
Center |
Displays the Center hard disk usage in bytes per second. |
|
Name |
Description |
|---|---|
|
Generate diagnostic |
|
|
PCAP Capture |
Use the PCAP Capture field on the Center page to capture packet data directly. See Generate a PCAP file |
|
Compute scores |
Click Compute scores on the Center page to initiate system performance measurement. This action generates a new score. |
Sensor status overview
The Status Overview page displays statistics collected from each sensor, including Sensor Name, Product ID, Health Status, Components, Activities, Unicast Activities, and Sensor last reported time. Use these statistics to assess sensor operation and identify potential issues.
The statistics show data for all time periods. You cannot filter them by time range.
To view sensor statistics, choose System statistics > Sensors > Status overview.
The table presents common sensor issues that can occur during operation.
|
Issue |
Description |
|---|---|
|
Zeros everywhere (components and activities) |
No data appears in the table, which means the sensor is not receiving traffic. The sensor cannot analyze packets or send information to the center. Review the sensor’s monitoring setup to resolve this issue. |
|
Zero unicast activities |
If activities and components appear but no unicast activities are present, the sensor is not receiving properly mirrored traffic. The switch traffic mirroring (monitor session) may be misconfigured. The center DPI interface may also not be in promiscuous mode. In this case, the session captures only broadcast or multicast traffic. |
|
Time mismatch |
If the Sensor last reported time column does not closely match the actual date and time, a time synchronization issue may prevent Cyber Vision from displaying data accurately. |
Generate a PCAP file
Collect network traffic data (PCAP files) from the Center interface. Use these files to diagnose and resolve communication, performance, or security issues.
Procedure
You can download the PCAP capture file.
What to do next
When the capture is complete, click Download to save the capture file. Analyze the downloaded PCAP file to troubleshoot issues.
Create your personal account
You must create your personal account in Cisco Cyber Vision Center.
Follow these steps to create your personal account.