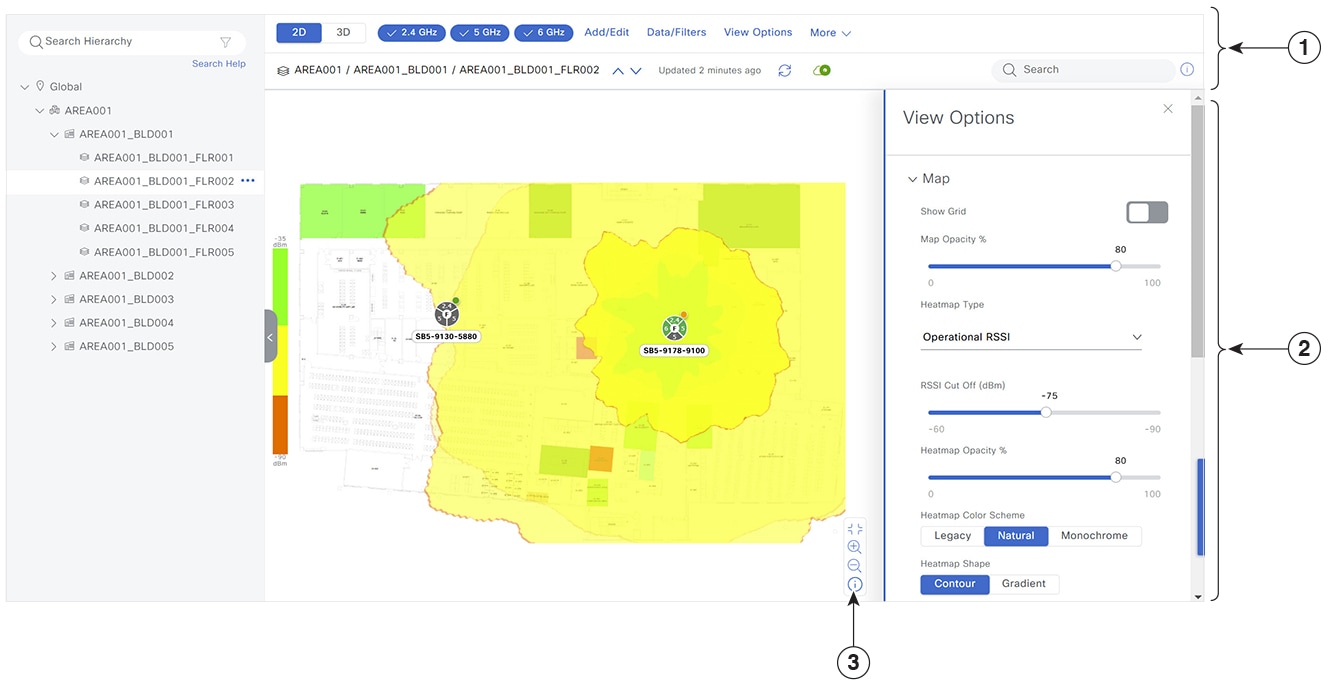
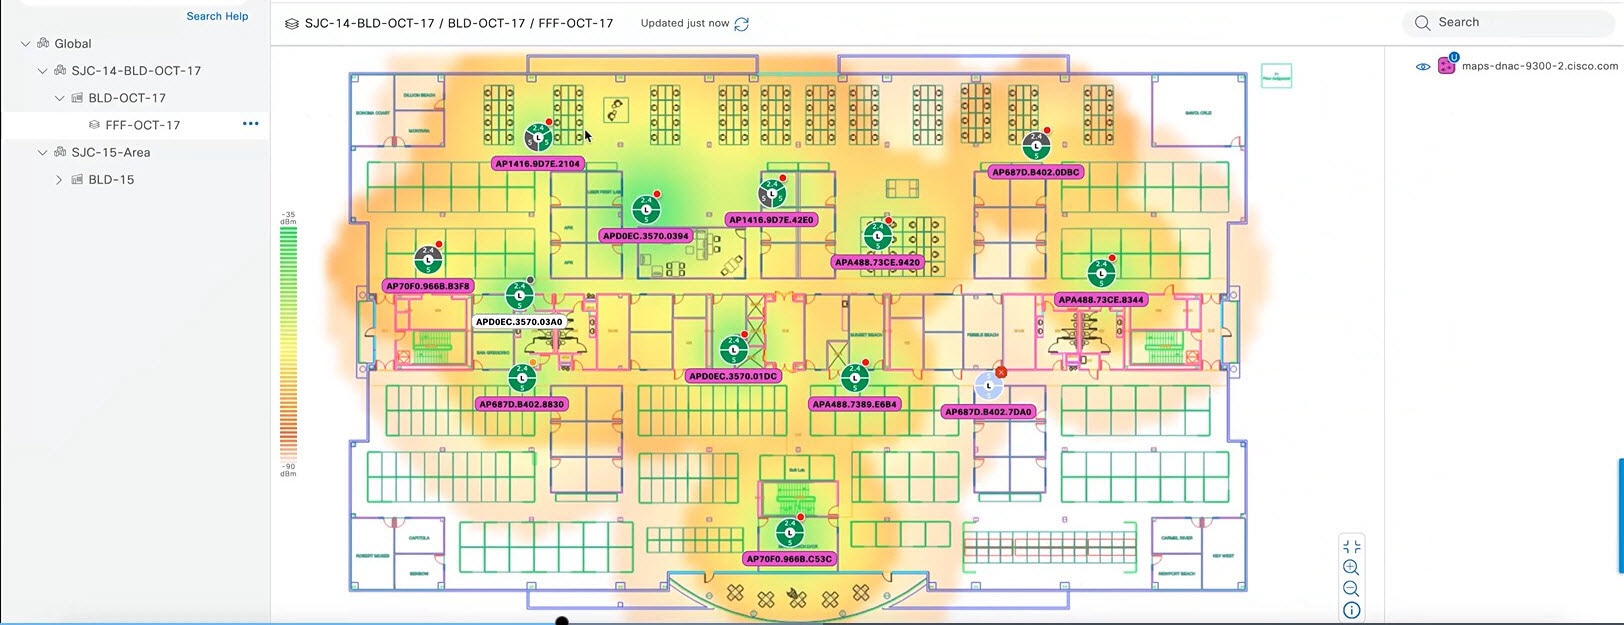
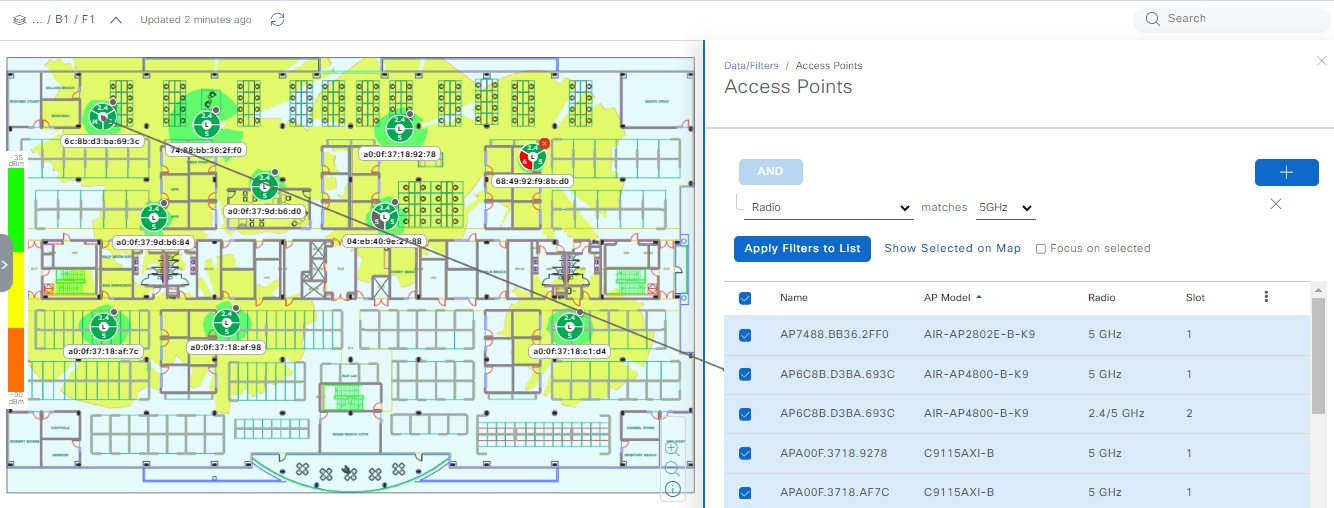
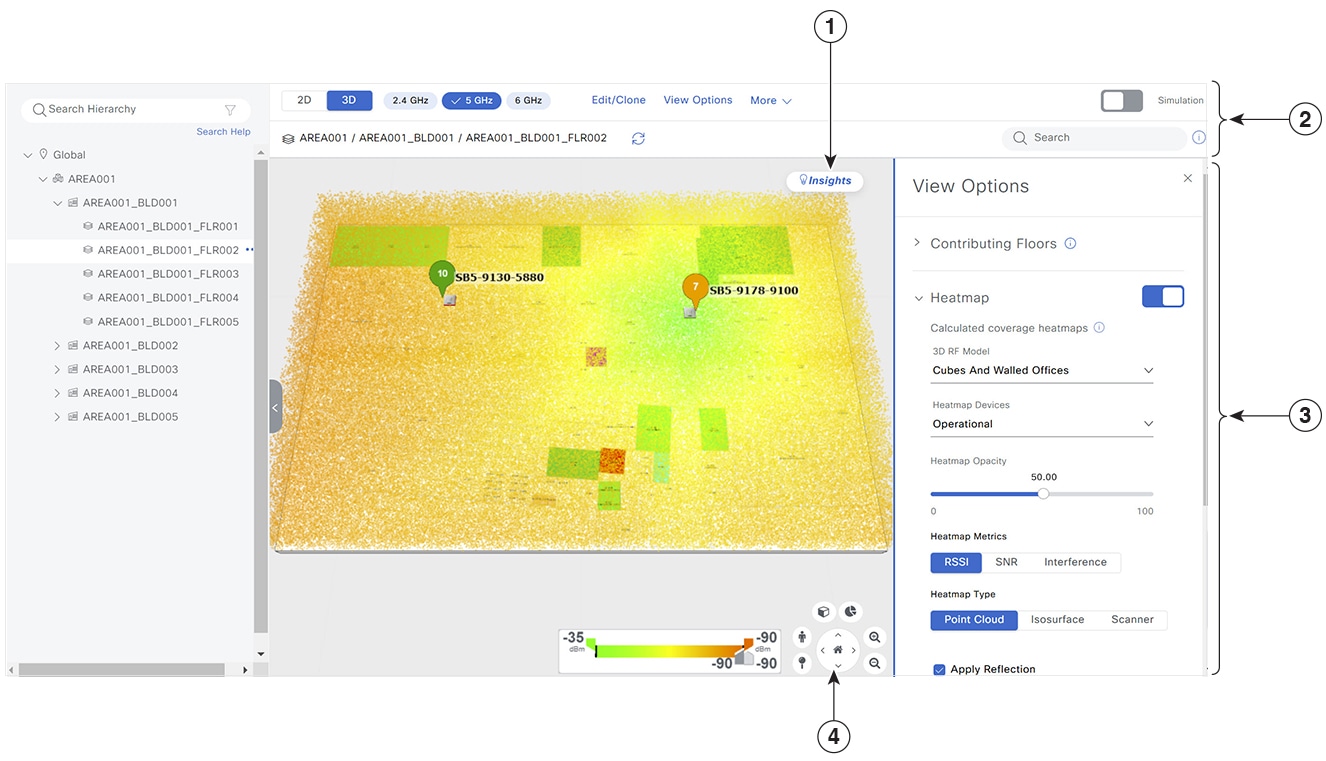
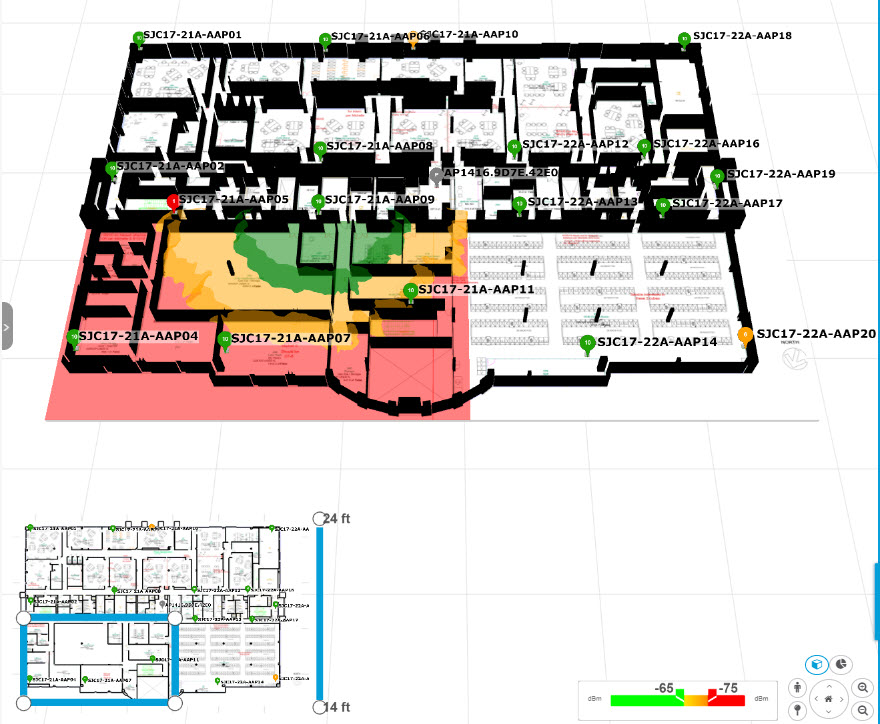
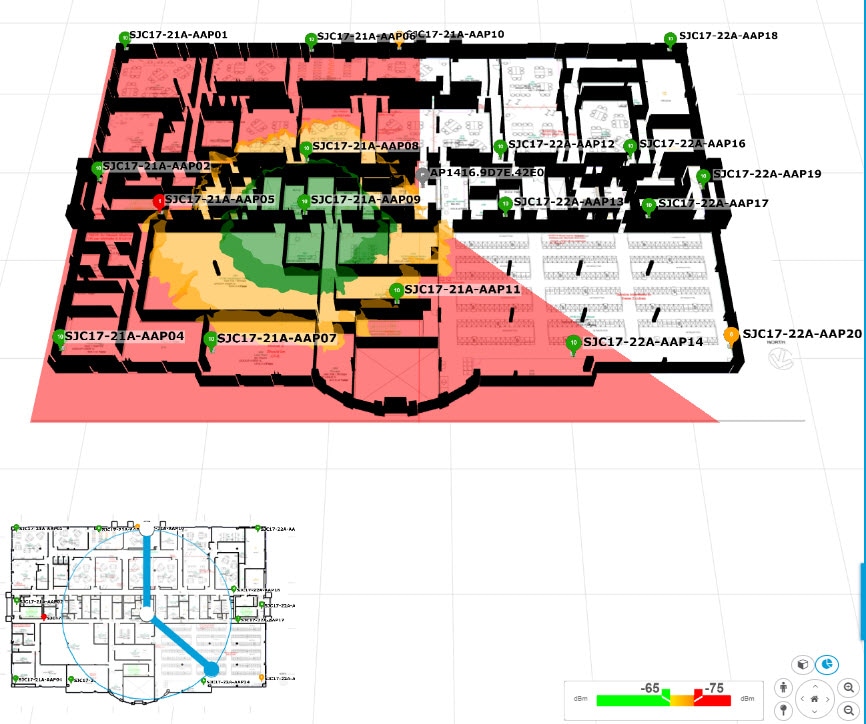
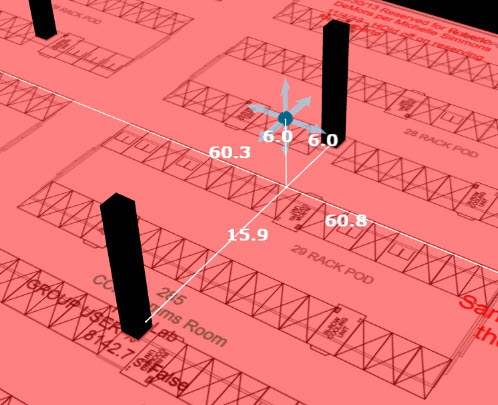
A heatmap is a visual representation of the Radio Frequency (RF) signal coverage of the wireless network devices in a particular
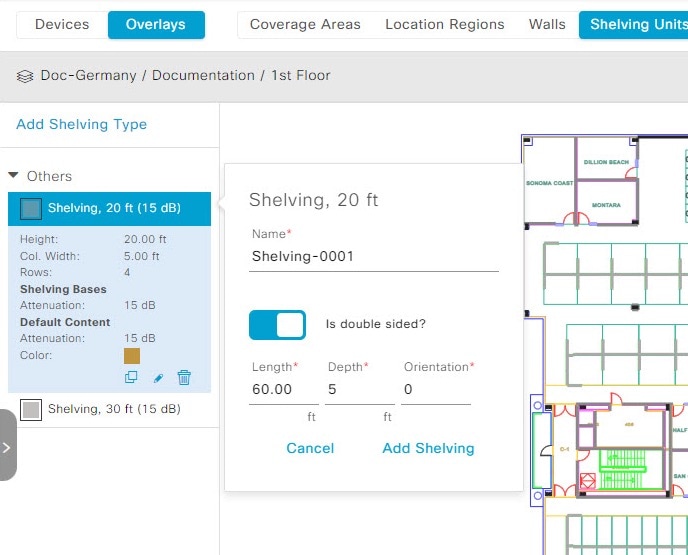
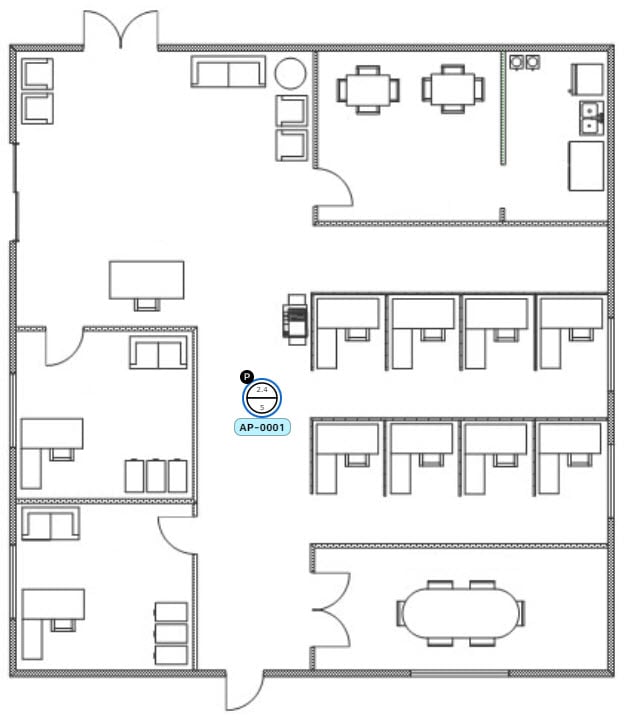
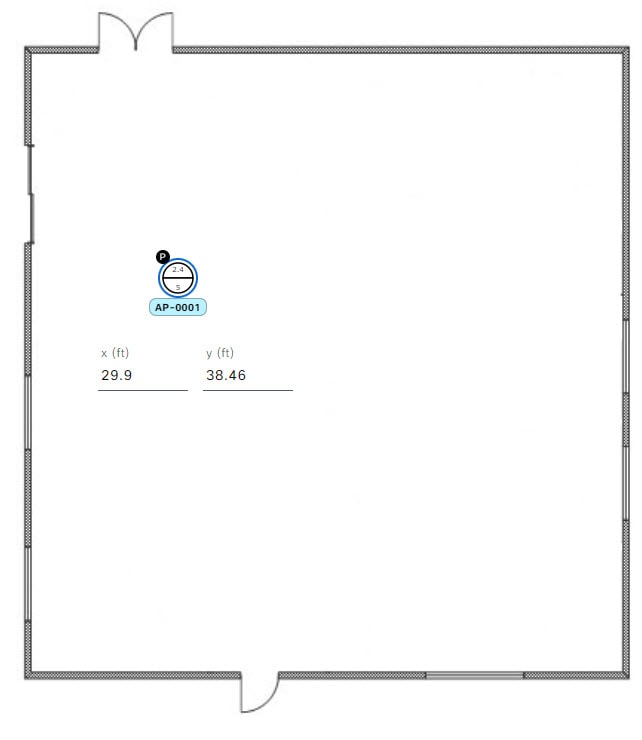
area. In Catalyst Center, you can generate a heatmap on a per floor basis by creating or importing a floor map that contains various building components,
like walls and windows, and then positioning your wireless devices on it.
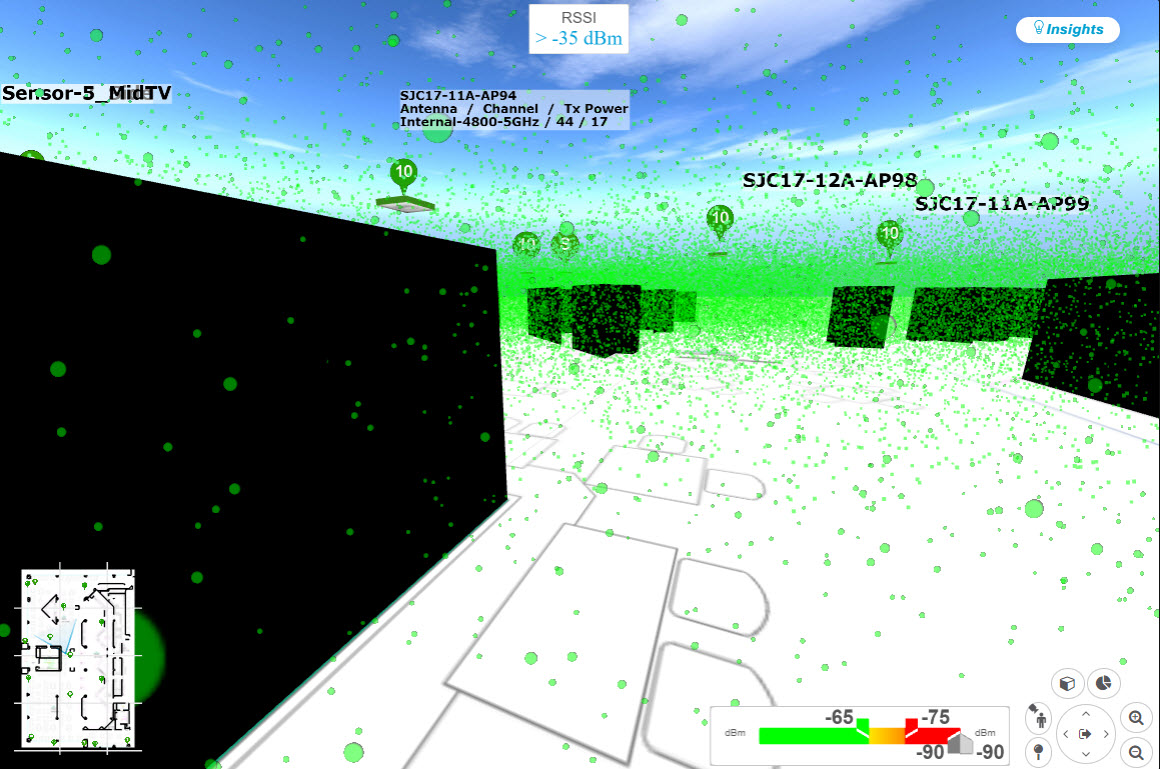
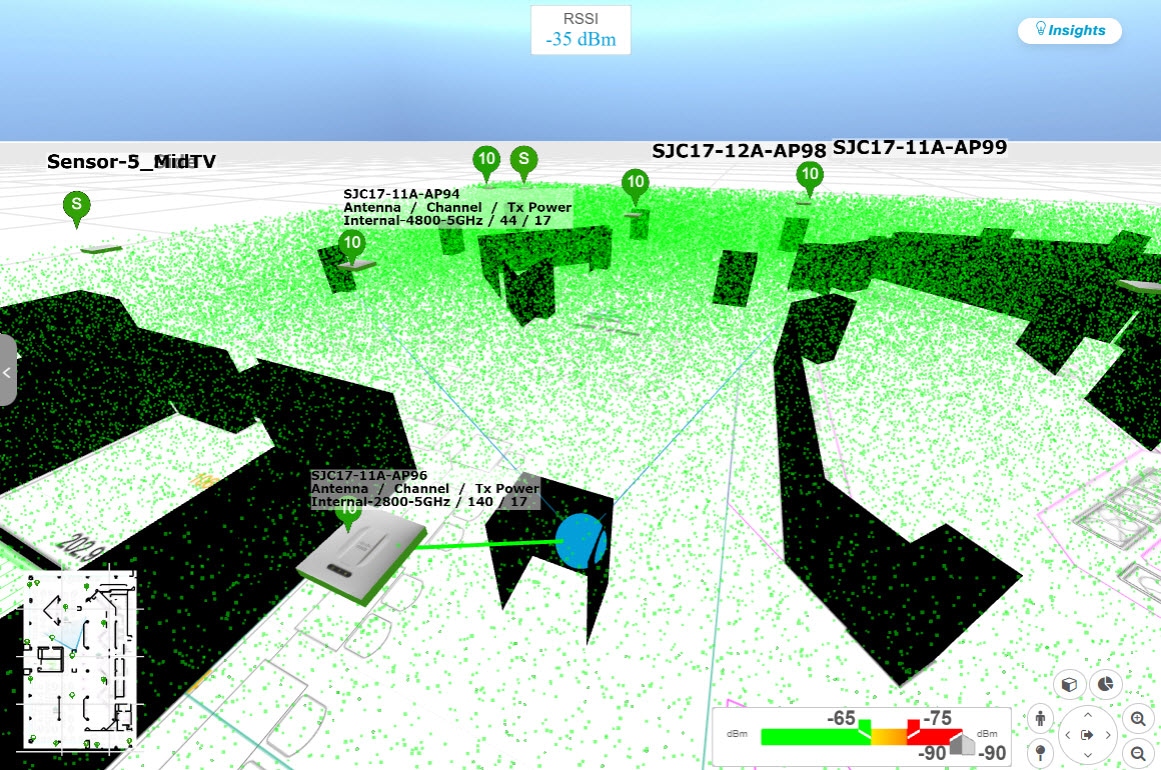
Using the floor map, Catalyst Center computes 2D and 3D heatmaps that show the relative intensity of the RF signals in the coverage area. For 2D wireless maps,
the heatmap is computed at height of 3 feet from the floor, while in 3D wireless maps, the heatmap is computed using the entire
volume of the floor (from floor-to-ceiling). For this reason, using 3D wireless maps is especially useful for computing wireless
coverage in high-ceiling environments, like warehouses.
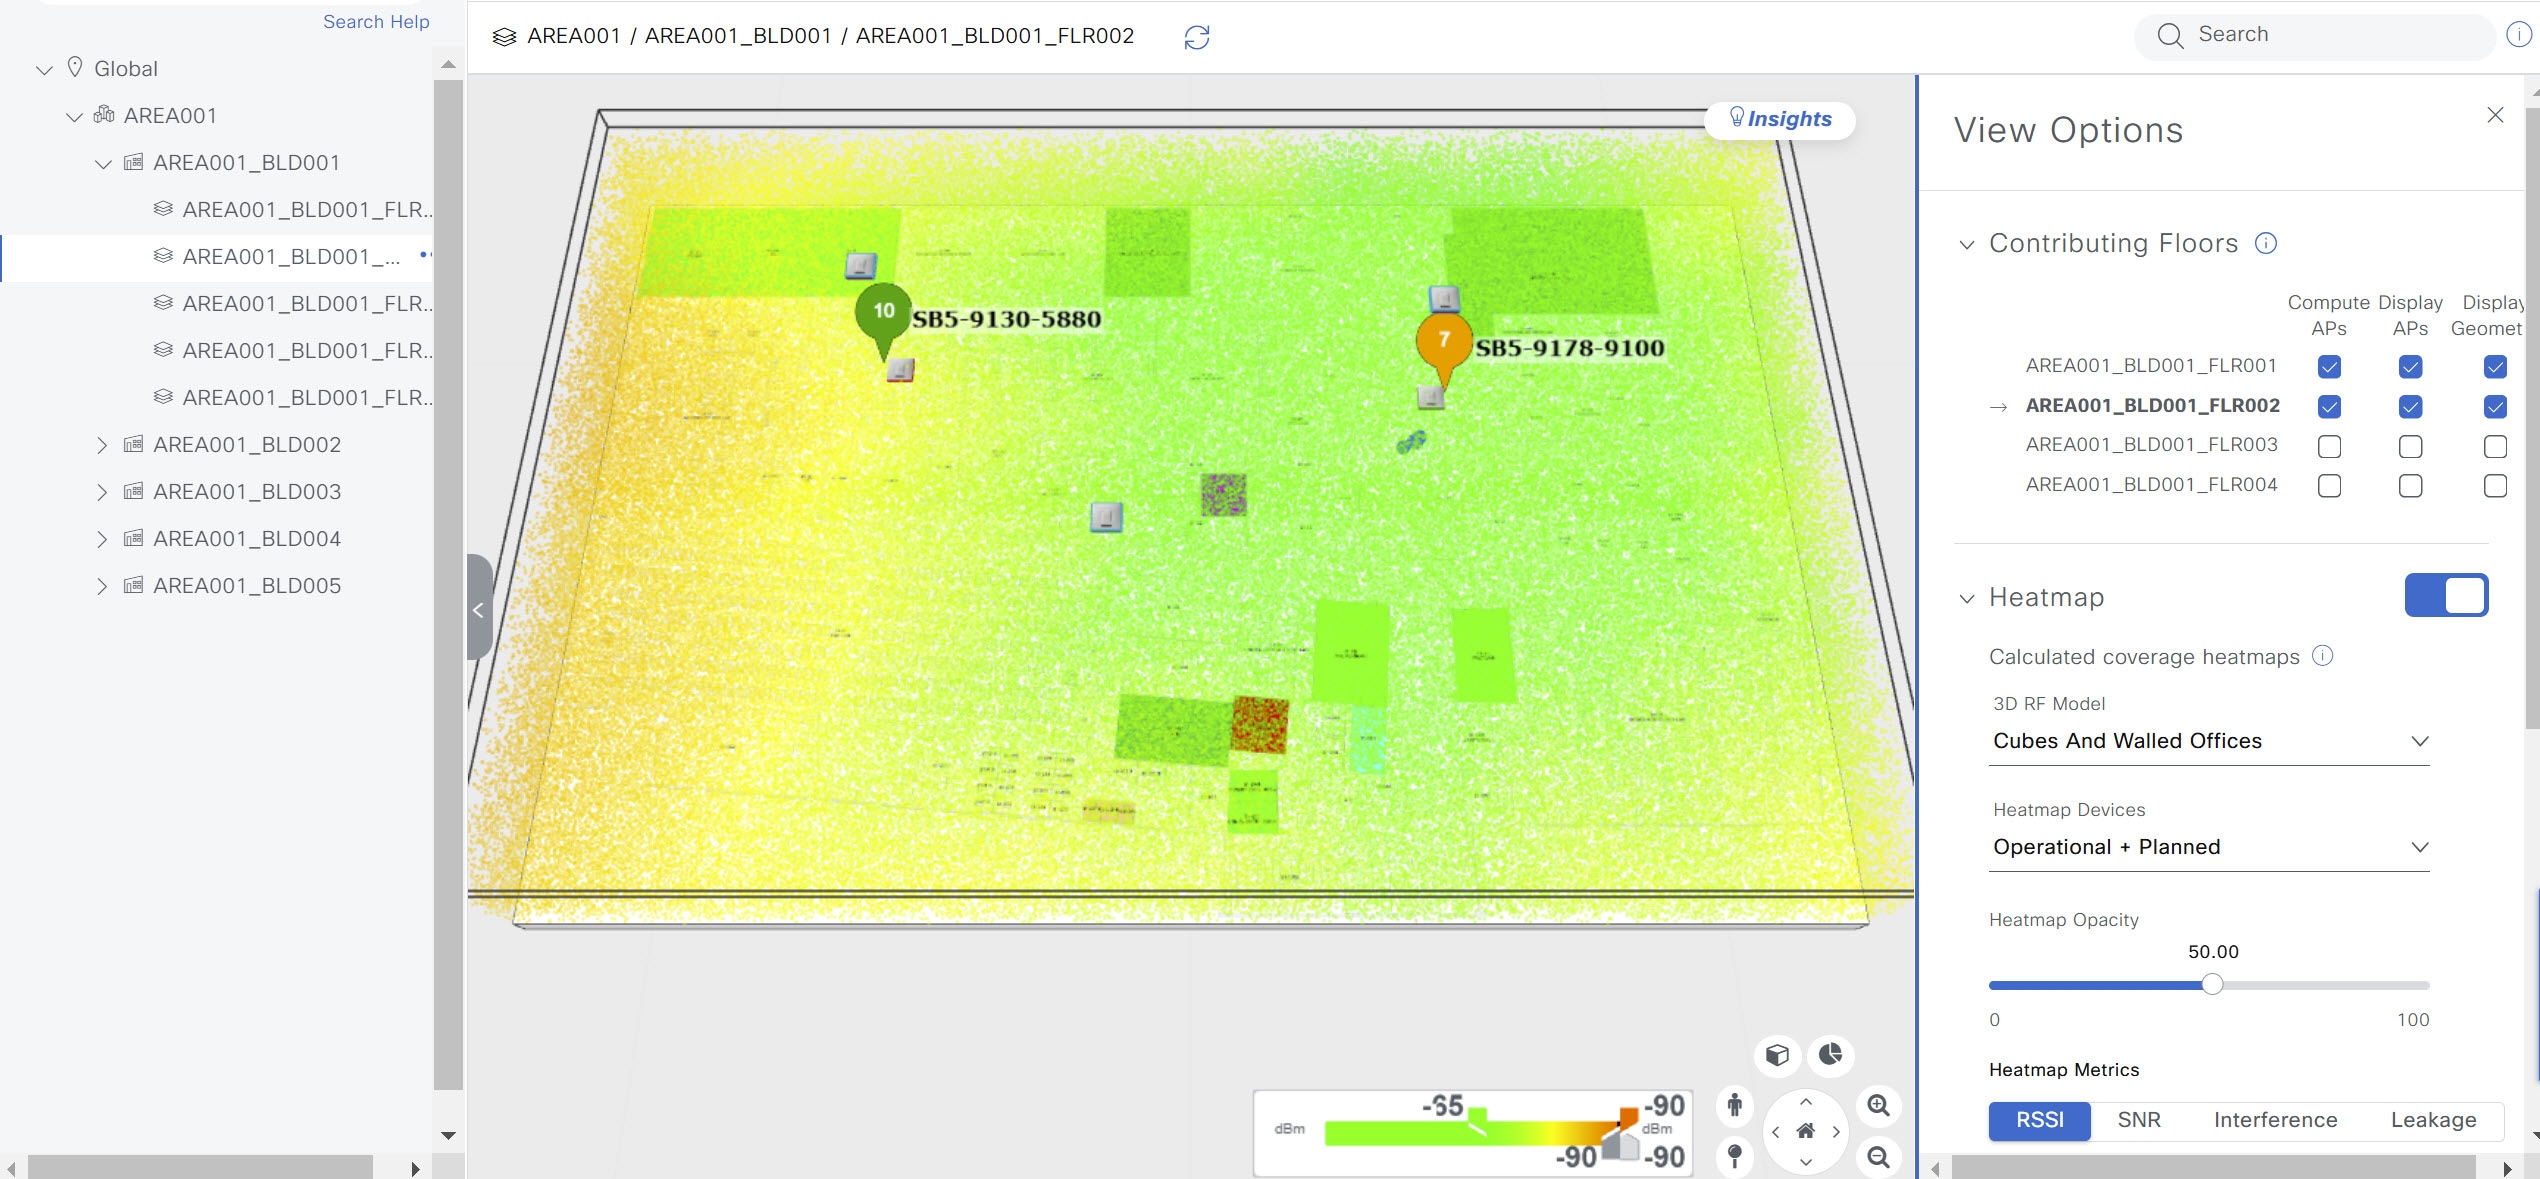
In addition, the 3D wireless heatmap can compute the effect of a floor's signal coverage on its neighboring floors. Neighboring
floors are the two floors directly above and below the selected floor. Neighboring floors are configurable, meaning you can
choose which neighboring floors you want to use in a heatmap computation. (See Contributing Floors in 3D map view options.) In this way, you can detect, visualize, and analyze the impact of a floor's signal coverage on other floors. For example,
you might have clients on the first floor who are connecting with APs on the second floor, or clients might be competing for
signal on the same channel (called cochannel interference). In some cases, this might be an intentional design. However, if
this design isn't intentional, you can take steps to change it.
The legacy heatmap generator is still available to be used. However, we recommend that you use the enhanced 3D-computed heatmap
generator for both 2D and 3D heatmaps, because it can generate heatmaps much faster.
3D-computed heatmap generator
The 3D-computed heatmap generator, which is enabled by default, offers several advantages over the legacy heatmap generator.
It uses the specialized graphics processing unit (GPU) to accelerate graphics rendering. Therefore, it can generate heatmaps
substantially faster than the legacy heatmap generator. In addition, you can set a limit to the number of walls that are included
in a heatmap computation, which also helps to enhance processing speed.
The 3D-computed heatmap generator automatically removes small obstructions (under 0.75 ft) and the second sides of the walls,
leaving only one side per wall. (Catalyst Center applies an attenuation value for each wall, not for each side of a wall.)
Legacy heatmap generator
The legacy (server-based) heatmap generator is still available to be used. However, we recommend that you use the enhanced
3D-computed heatmap for 2D heatmaps because performance and accuracy are much better.
The legacy server-based heatmap generator has a limit on the number of walls that can used to compute 2D and 3D heatmaps.
The maximum number of walls for a 2D heatmap is 300, after optimization. If your CAD file contains more, Catalyst Center alerts you and preserves the 300 most relevant walls (based on the length of the wall multiplied by its attenuation). The
maximum number of walls for a 3D heatmap is 3000, after optimization. If your CAD file contains more, Catalyst Center alerts you and preserves the 3000 most relevant walls (based on the length of the wall multiplied by its attenuation).
Although the 3D-computed heatmap generator is enabled by default, you can disable it and use the legacy heatmap generator
instead.
 next to
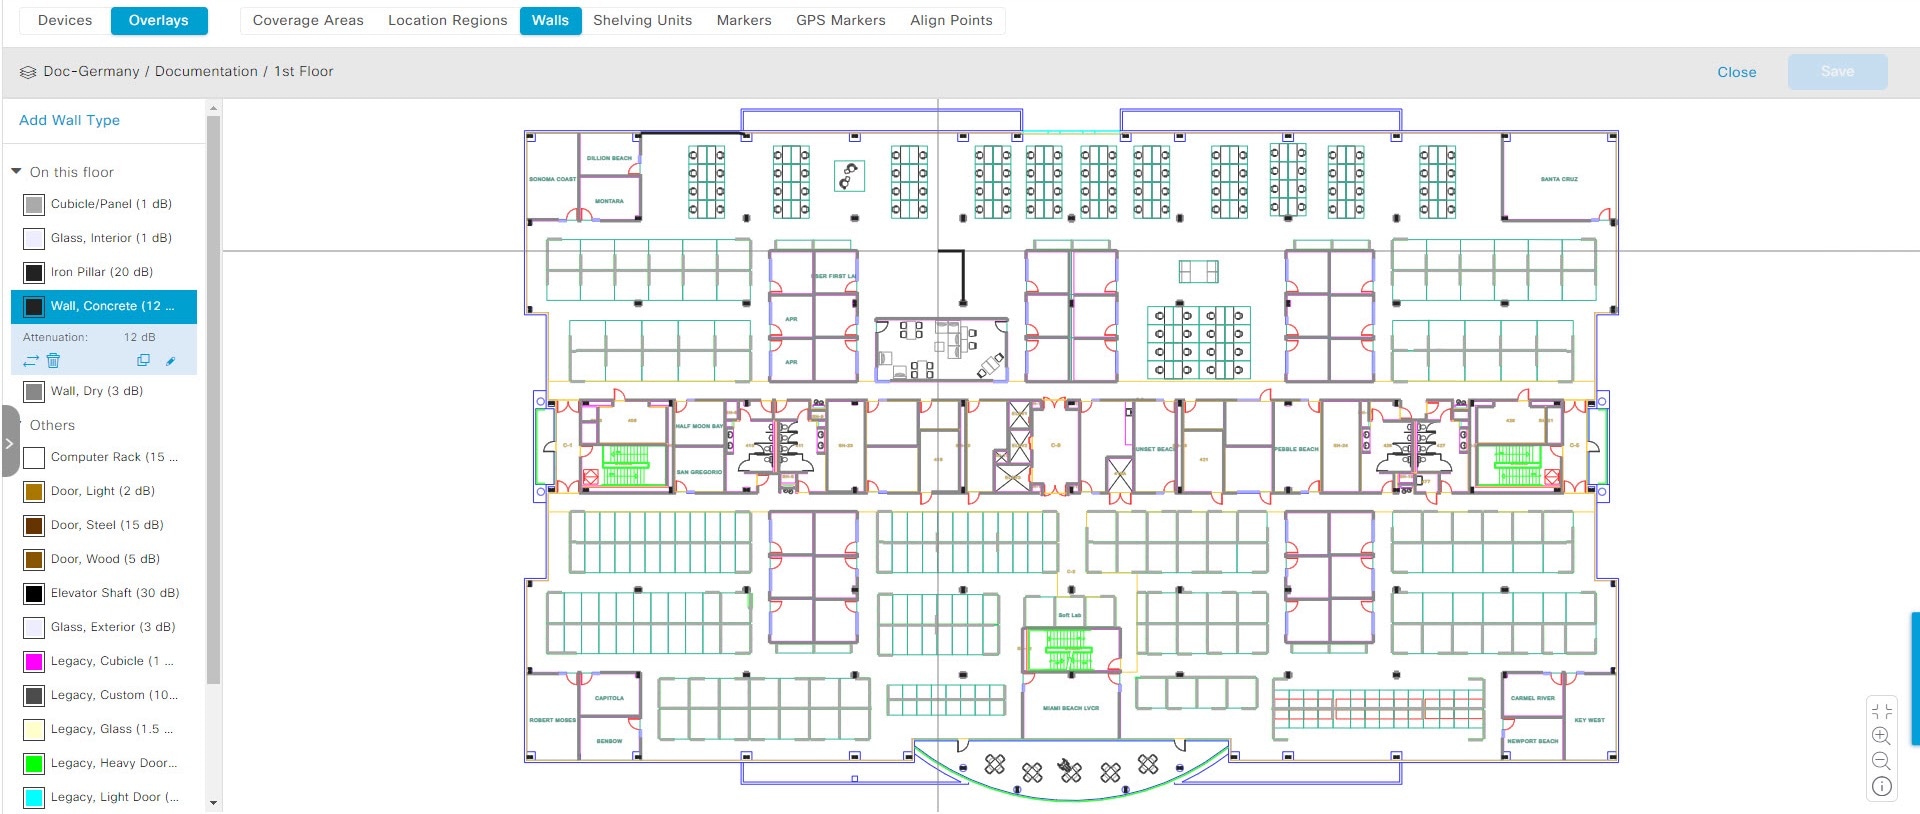


 Feedback