Cisco AI Endpoint Analytics

Cisco AI Endpoint Analytics overview

Visibility is the first step towards securing an endpoint. Cisco AI Endpoint Analytics is an endpoint visibility solution that helps you identify and profile endpoints and Internet of Things (IoT) devices. The Cisco AI Endpoint Analytics engine enables you to assign labels to endpoints, using the telemetry information received from the network from various sources.

The profiling labels that are available in Cisco AI Endpoint Analytics are endpoint type, hardware model, manufacturer, and operating system type. This is called multifactor classification.

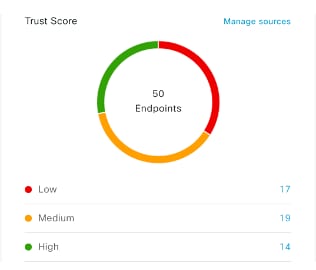
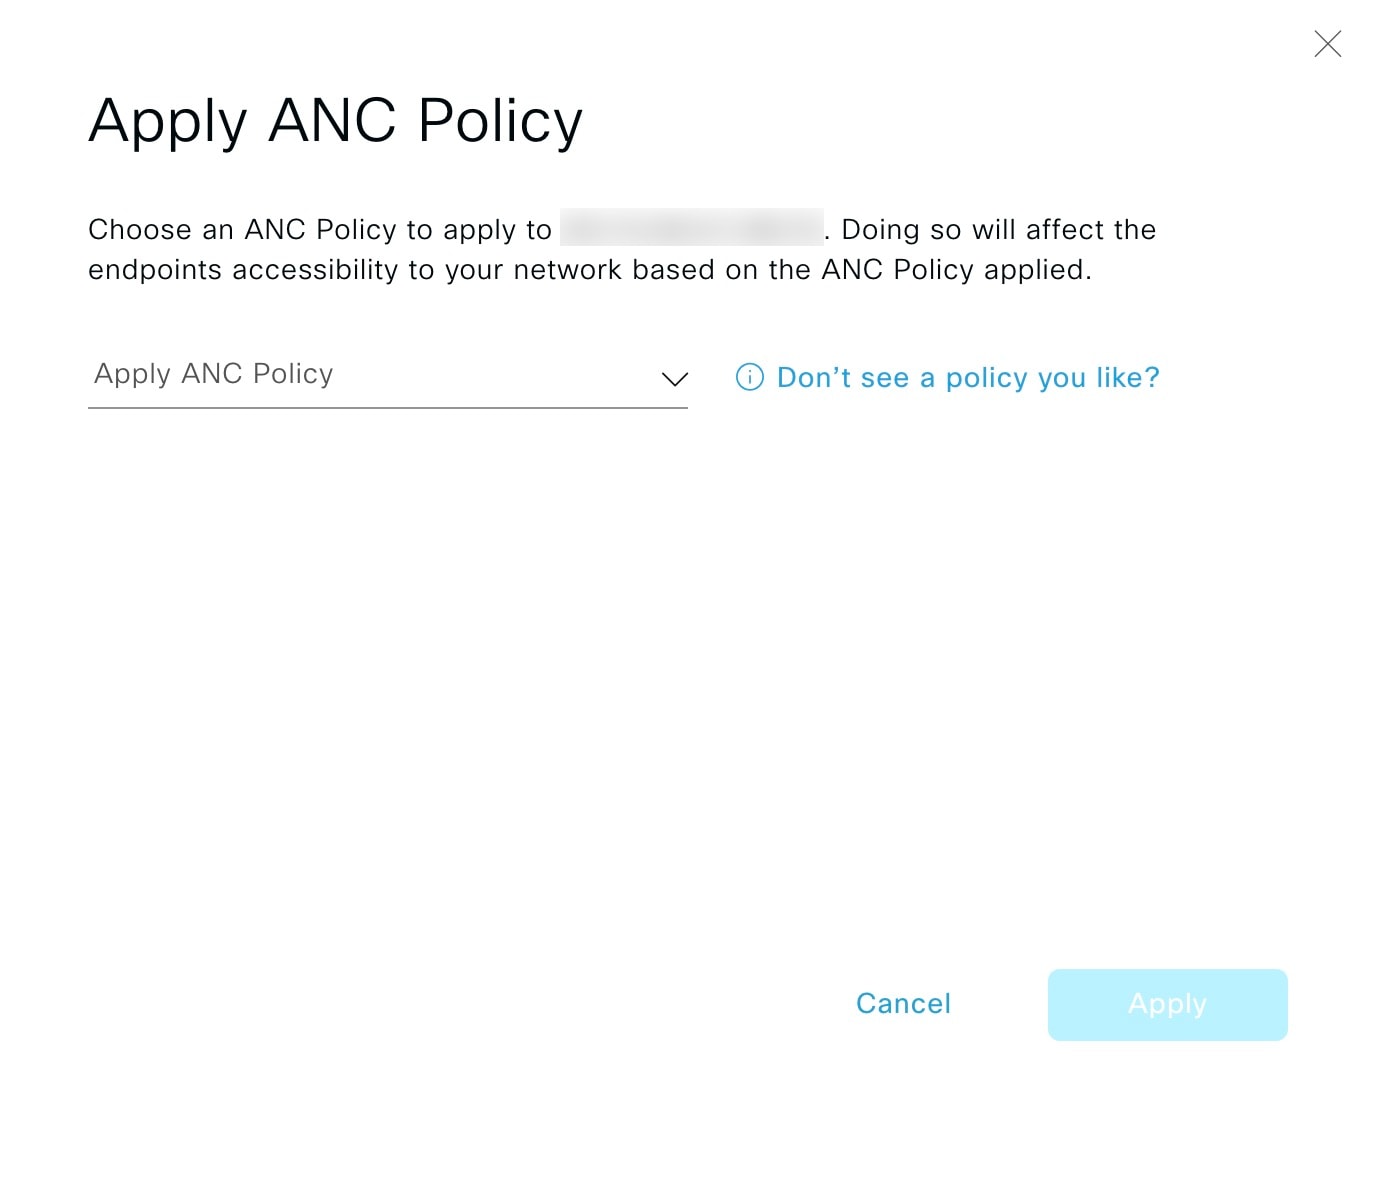
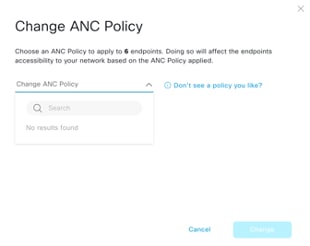
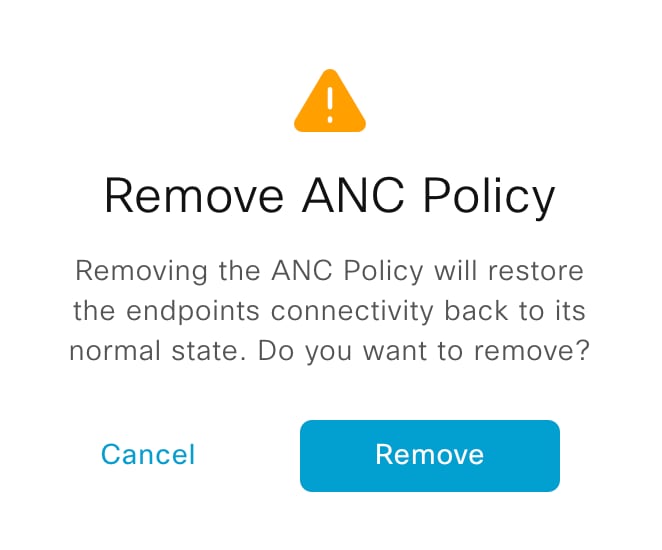
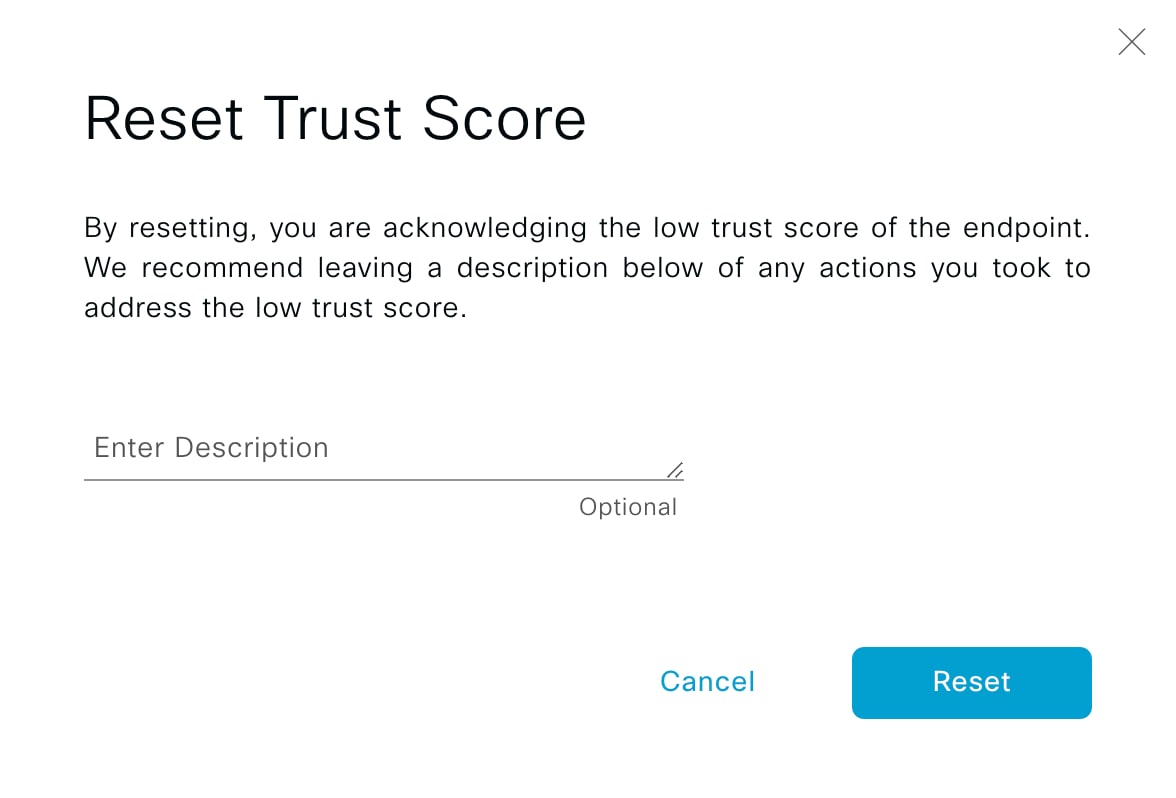
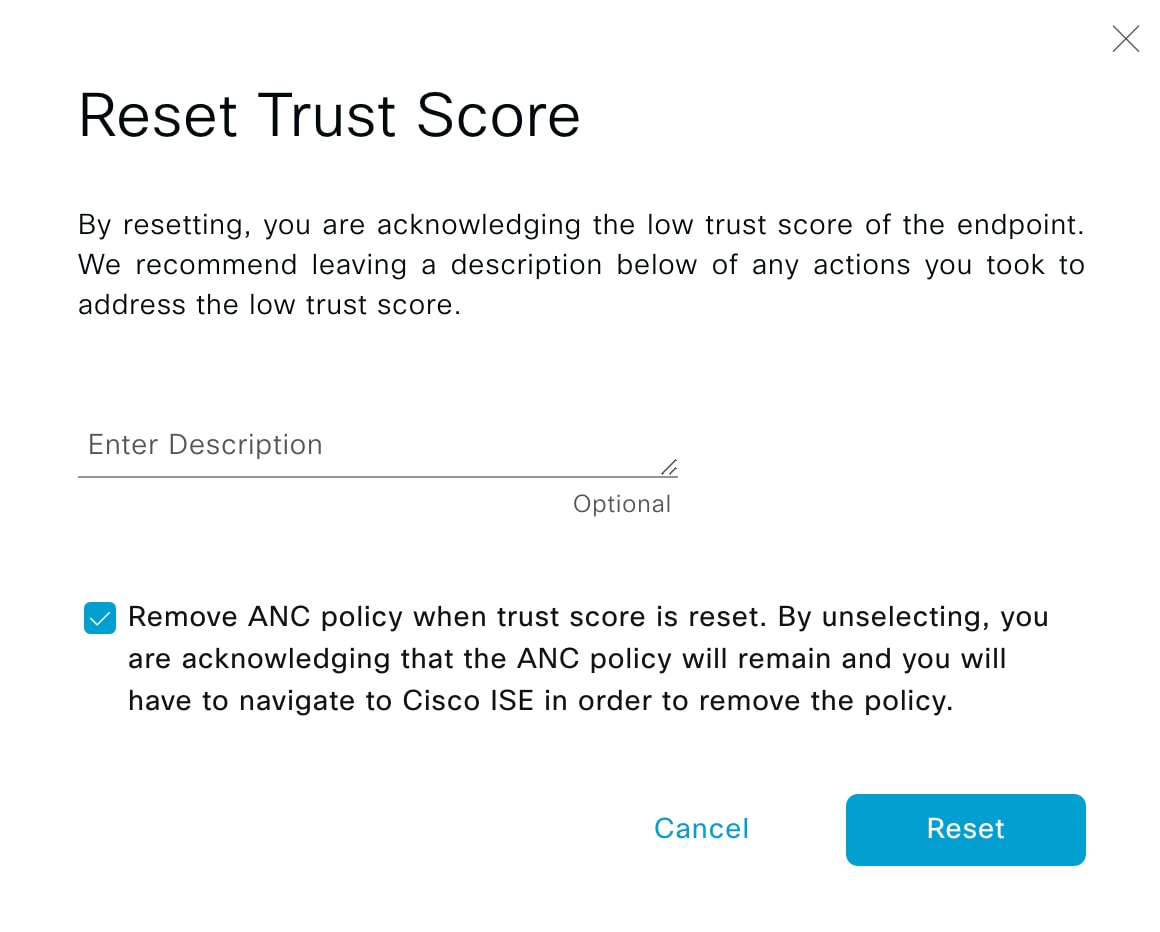
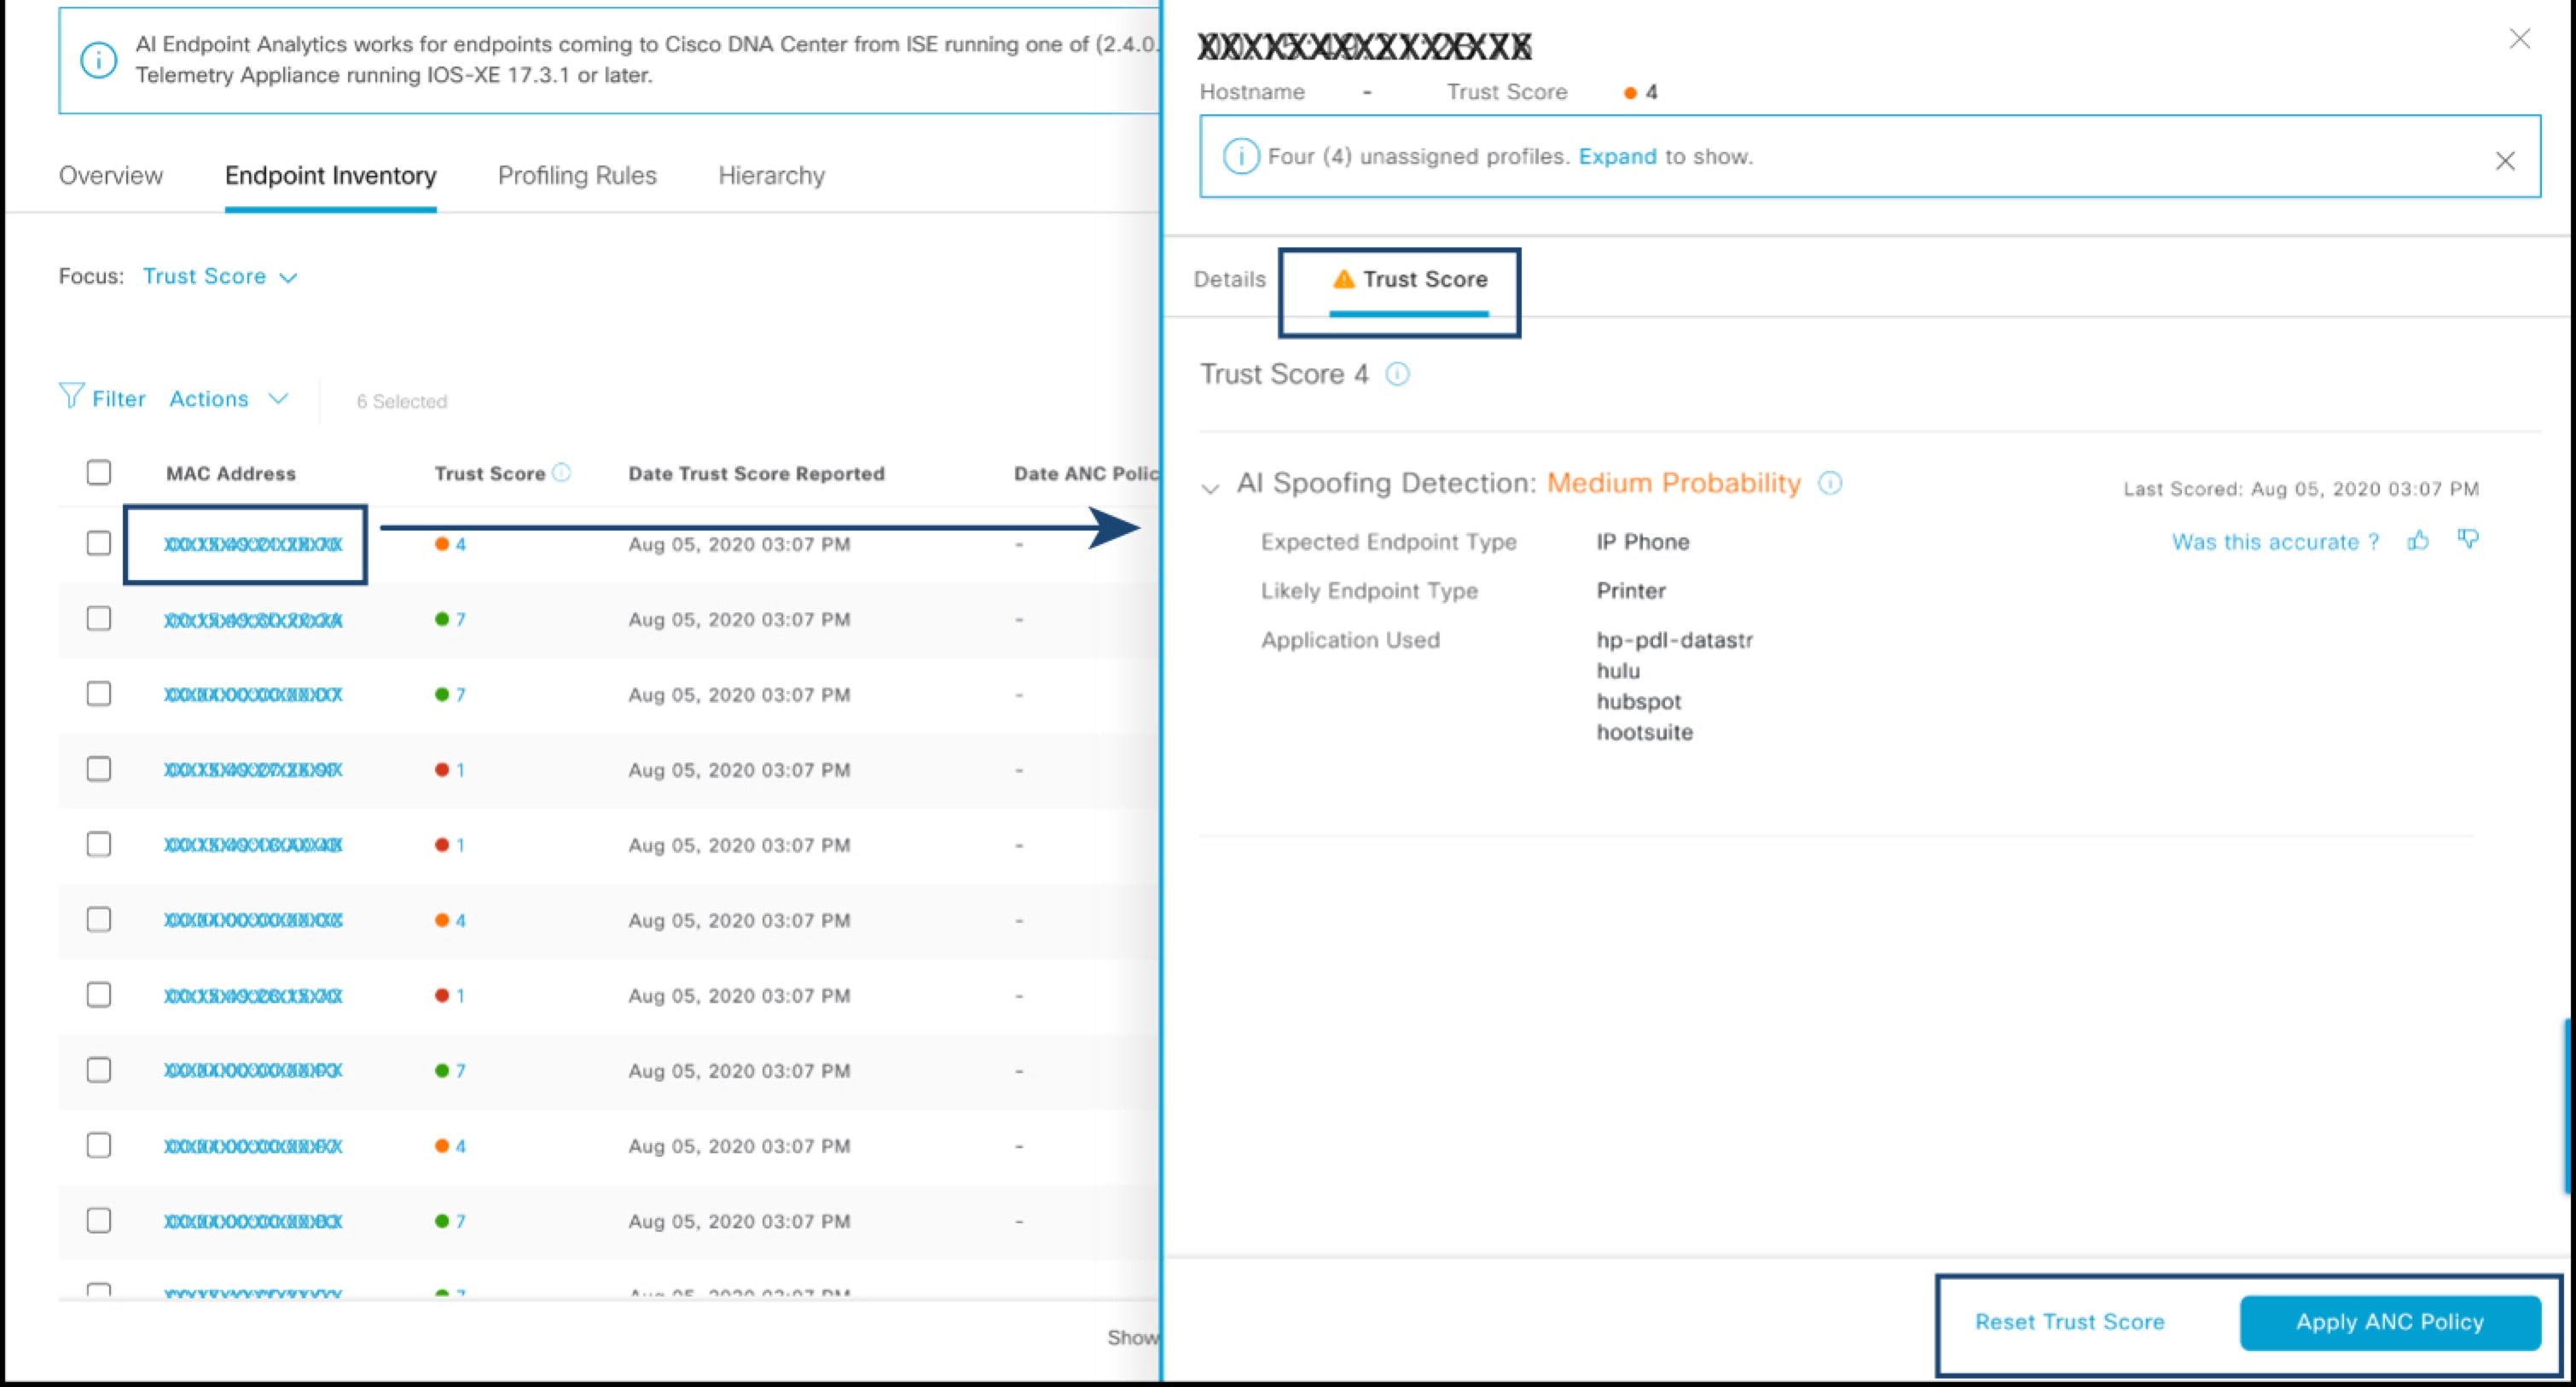
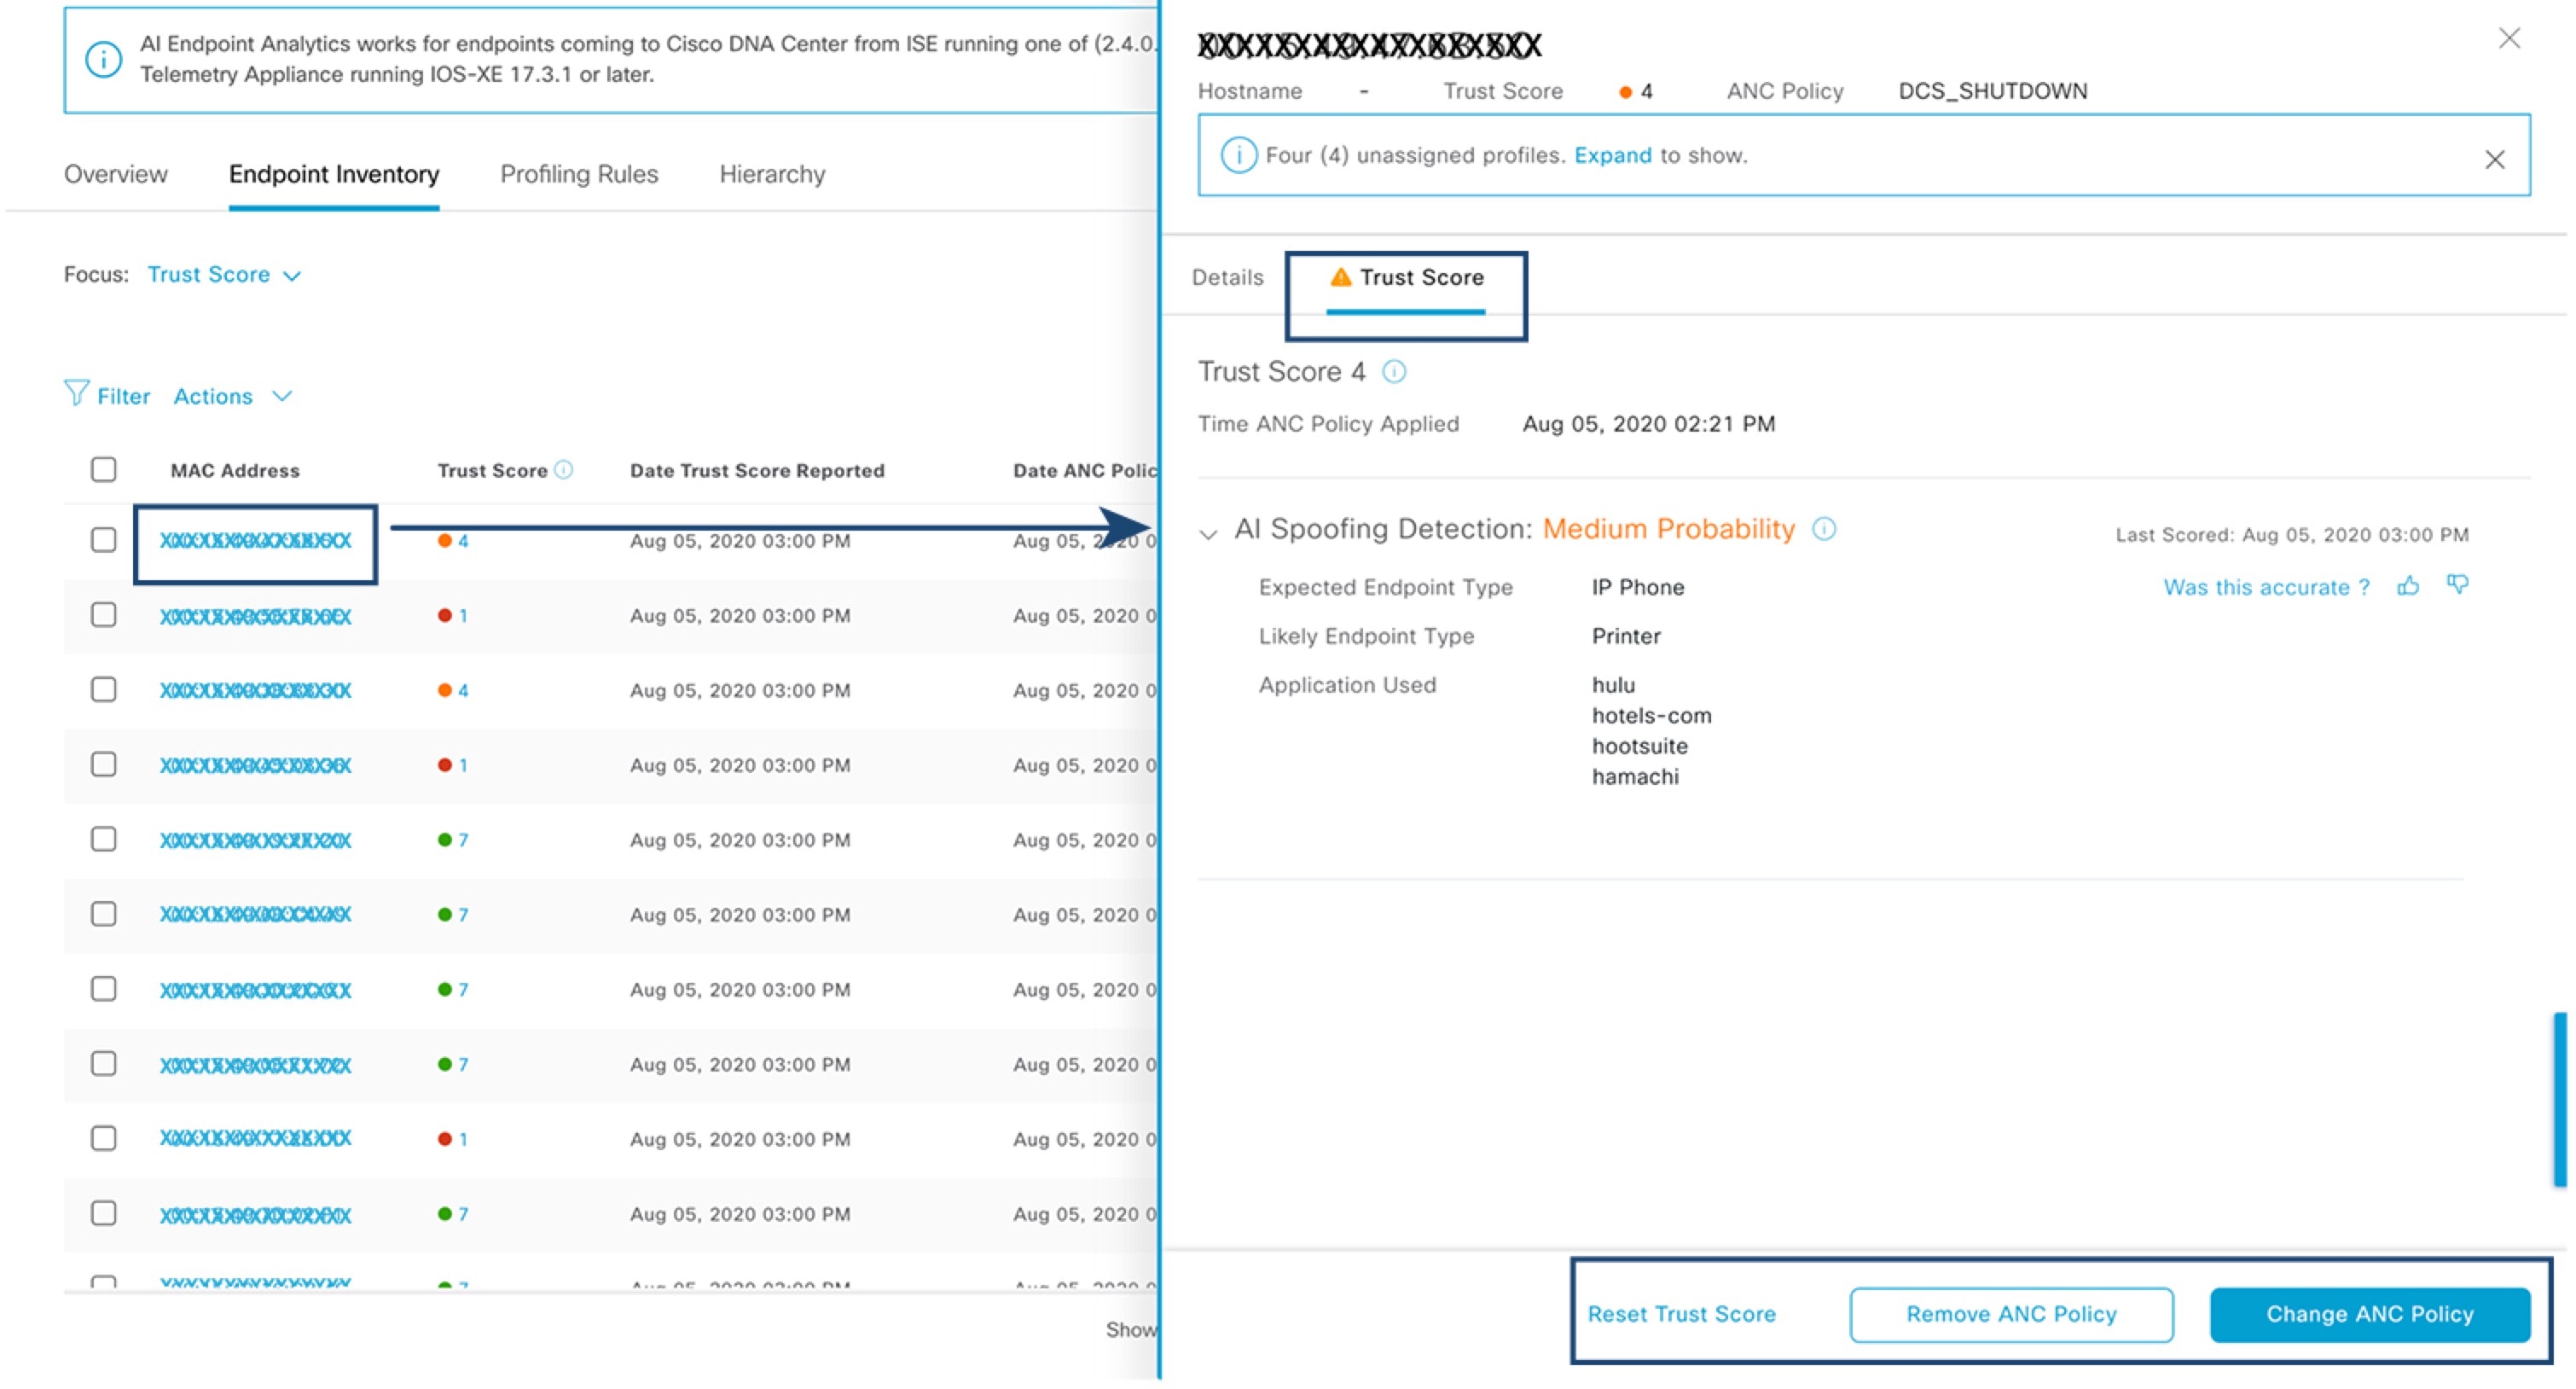
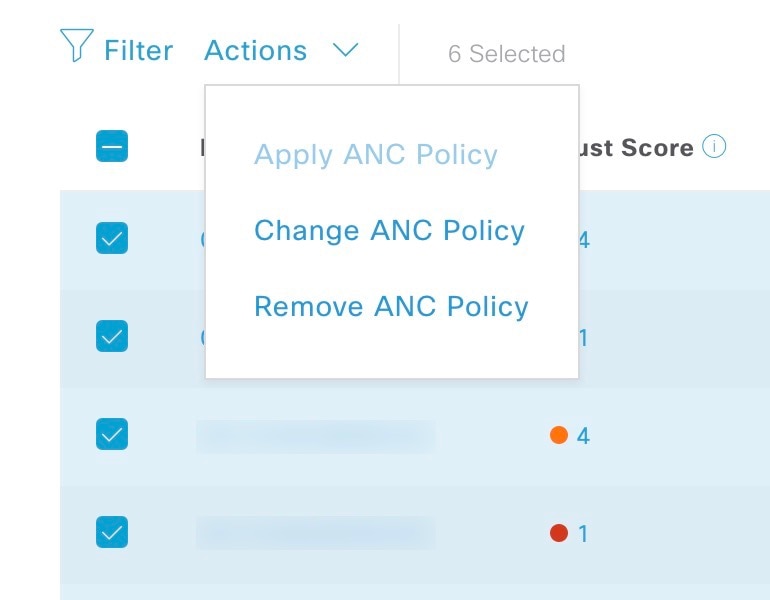
Cisco AI Endpoint Analytics provides nuanced visibility and enforcement in your network with features like Trust Scores that allow you to identify and act upon potentially risky endpoints and devices. You can also manage potential risks by applying ANC policies through Cisco ISE, from the Cisco AI Endpoint Analytics GUI. You can monitor and work around the issue of random and changing MAC addresses from endpoints in Cisco AI Endpoint Analytics and accurately identify endpoints through a unique attribute called the DUID instead of MAC addresses.

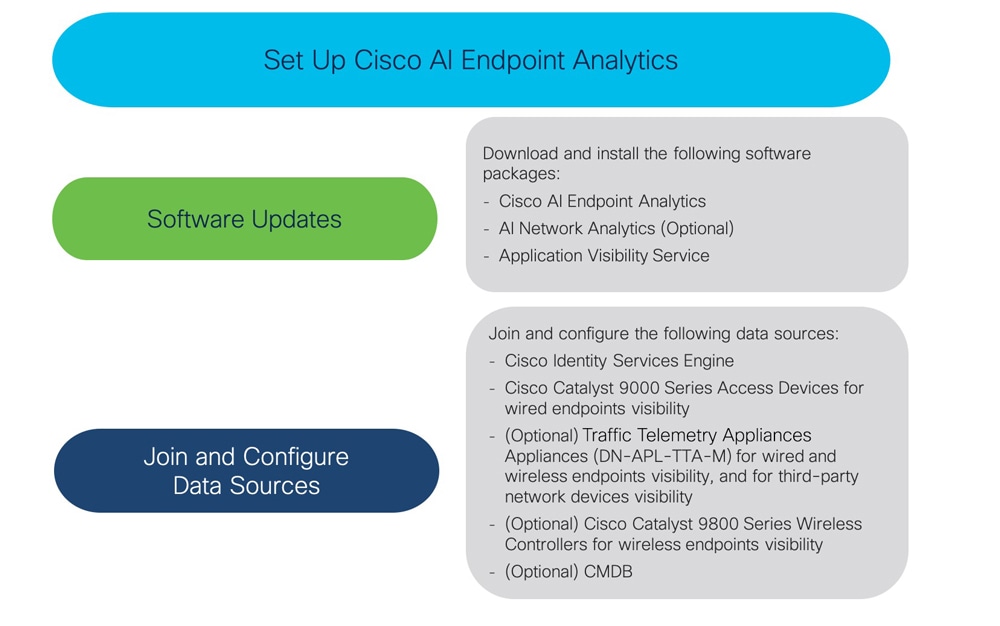
Cisco AI Endpoint Analytics helps you gather endpoint telemetry from different sources. The primary source is the Network-Based Application Recognition (NBAR) mechanism. The NBAR mechanism is embedded in Cisco Catalyst 9000 Series switches (access devices) and performs deep packet inspection (DPI). Cisco AI Endpoint Analytics can also receive telemetry from Catalyst Center Traffic Telemetry Appliance.

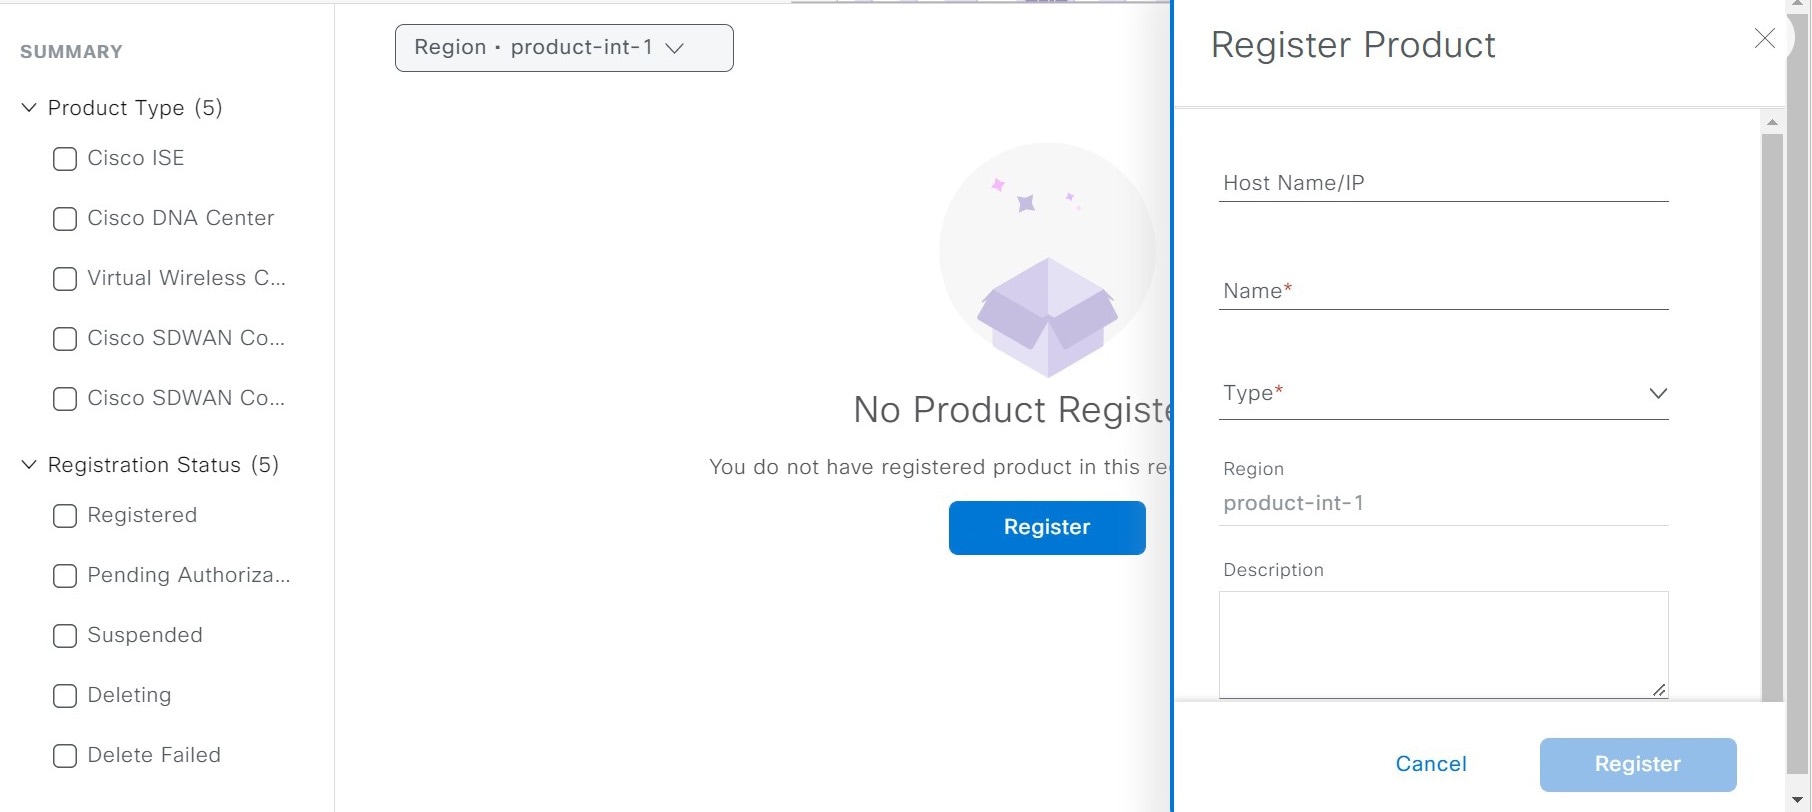
You can gather endpoint context information from various sources such as Cisco ISE, self-registration portals, and configuration management database (CMDB) software such as ServiceNow.

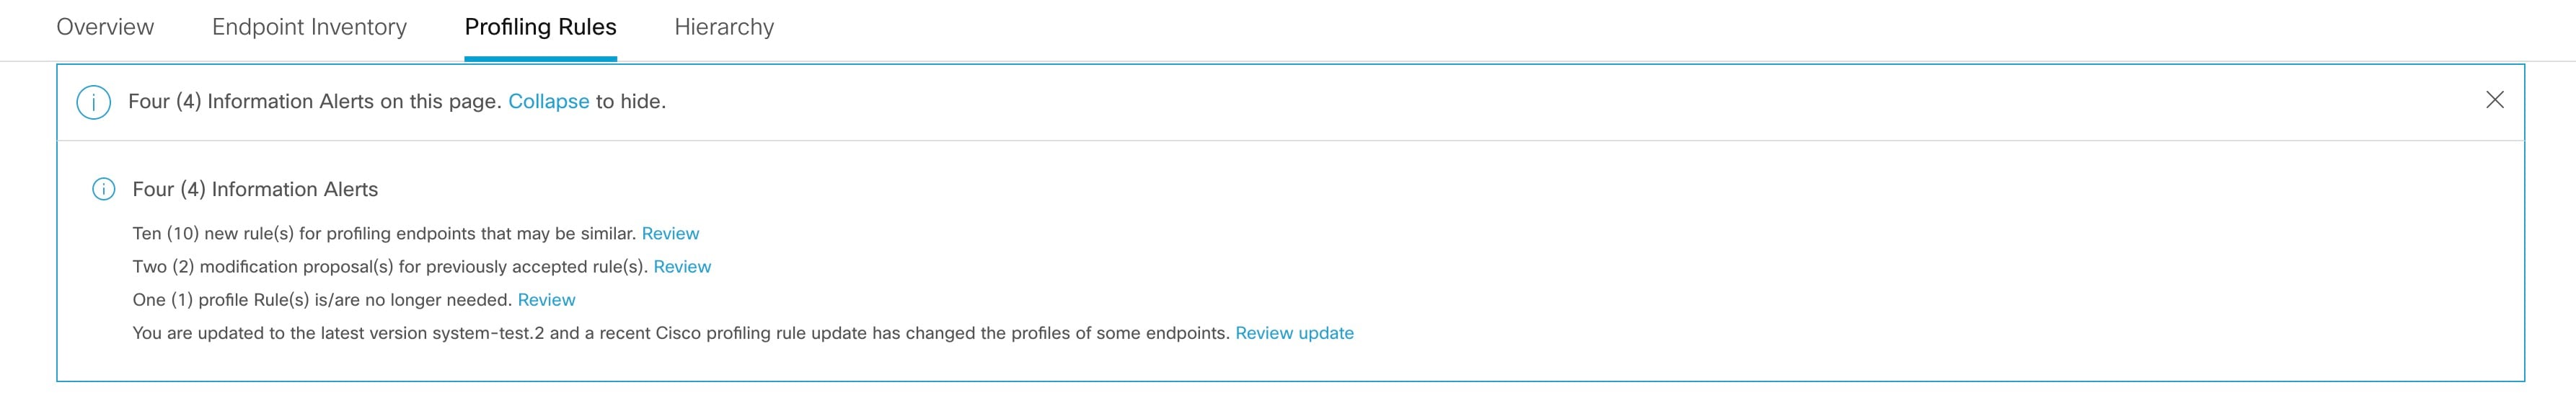
Cisco AI Endpoint Analytics allows data inflow from a wide range of network devices, expanding your ability to easily identify and profile endpoints with greater accuracy, and act upon any anomalies. You can aggregate varied endpoint information and use the data to profile endpoints in Cisco AI Endpoint Analytics. After endpoints are profiled, AI and machine learning algorithms can also be used to reduce the number of unknown endpoints by intuitively leveraging different methods.

Key features of Cisco AI Endpoint Analytics

  • Cisco AI Endpoint Analytics dashboard

    The Cisco AI Endpoint Analytics dashboard gives you a comprehensive view of the endpoints that are connected to your network. You can view the number of known, unknown, profiled, and unprofiled endpoints, endpoints with low Trust Scores, and endpoints that use random MAC addresses. The AI Proposals dashlet displays intelligent profiling suggestions to enhance endpoint profiling and management.

  • Trust Scores to flag potentially risky endpoints

    Cisco AI Endpoint Analytics assigns Trust Scores to endpoints to allow you to easily monitor and act on potentially risky endpoints in your network. Behavioral anomalies are monitored and tracked, and a Trust Score is assigned based on the number and frequency of the anomalies tracked. See Trust Scores for endpoints.

  • Detect endpoints that use random MAC addresses

    Cisco AI Endpoint Analytics enables you to handle the issue of random and changing MAC addresses by receiving from Cisco ISE a unique endpoint identifier called the DUID (also known as GUID in Cisco ISE). Cisco AI Endpoint Analytics then uses the DUID as the identifier for an endpoint, instead of its MAC address.

  • Reduce net unknowns with machine learning capabilities

    Cisco AI Endpoint Analytics provides profiling suggestions based on learnings from endpoint groupings. You can use these suggestions to reduce the number of unknown or unprofiled endpoints in your network.

  • Manage endpoints with system and custom profiling rules

    Use Cisco-provided system rules and custom rules of your design to reliably profile and manage the endpoints connected to your network.

  • Registration of endpoints through Cisco AI Endpoint Analytics

    You can onboard and profile endpoints using Cisco AI Endpoint Analytics. The endpoint attribute data that is collected through this registration process is used to profile the endpoints.

  • Registration of endpoints using external sources

    You can connect some external sources of endpoint data, such as Configuration Management Databases (CMDB), to Cisco AI Endpoint Analytics. This allows you to easily register, manage, and profile endpoints in your network.

  • Purge endpoints after a defined period of inactivity

    Define an Endpoint Purge Policy to remove from your network the endpoints that have been inactive for a defined time. You can define the period of inactivity after which an endpoint must be removed. You can also customize a purge policy to act on a particular set of endpoints based on a profiling attribute.

FIPS compliance

Catalyst Center supports the United States' Federal Information Processing Standards (FIPS). FIPS is an optional mode that can be enabled when installing the Catalyst Center image. By default, FIPS mode is disabled.

When FIPS mode is enabled in Catalyst Center, these functions in the Catalyst Center GUI are unavailable:

  • The Enable AI Network Analytics dashlet in the Optional Configurations section in AI Endpoint Analytics Setup.

  • The AI Proposals dashlet in Policy > AI Endpoint Analytics > Overview.

  • The Profile Rule Settings tab in Policy > AI Endpoint Analytics > Overview > Configuration.

  • The AI Spoofing Detection section in Policy > AI Endpoint Analytics > Overview > Configuration > Trust Analytics.

  • The AI Spoofing Detection section in Endpoint Anomaly Detection under Trust Score details for a particular endpoint in Policy > AI Endpoint Analytics > Endpoint Inventory.

  • The AI Spoofing Detection column in Policy > AI Endpoint Analytics > Endpoint inventory > Focus as Trust Score.

  • The Talos IP Reputation section in Policy > AI Endpoint Analytics > Overview > Configuration > Trust Score Sources.

Set up Cisco AI Endpoint Analytics in Catalyst Center

The Set Up Cisco AI Endpoint Analytics diagram displays which software packages to download and install and which data sources to join and configure.

Install software updates

Install software updates in Catalyst Center to use Cisco AI Endpoint Analytics, as described in this procedure.

Procedure


Step 1

Log in to Catalyst Center.

Step 2

From the main menu, choose System > Software Management.

Step 3

In the Updates tab, check if Cisco AI Endpoint Analytics, AI Network Analytics, and Application Visibility Service are listed in the Application Updates section. If these application updates are visible, click Install All.

  • Install the Cisco AI Endpoint Analytics update to access the endpoint profiling solution in your Catalyst Center.

  • Install the AI Network Analytics update to use machine learning and AI capabilities to receive intelligent profiling suggestions.

  • Install the Application Visibility Service update to use NBAR and Controller-Based Application Recognition (CBAR) techniques to inform endpoint profiling.

Step 4

If these updates aren't listed in the Updates tab, click the Installed Apps tab to check if the updates are already installed and are available for use. The Currently Installed Applications tab also confirms if the software installation succeeded.


Connect and enable data sources

The data sources that Cisco AI Endpoint Analytics uses may already be connected to your Catalyst Center. If the data sources are connected, follow these instructions to ensure that the data sources are available for use by Cisco AI Endpoint Analytics.

You must add Cisco ISE or Catalyst 9000 Series access devices to Catalyst Center for Cisco AI Endpoint Analytics to provide results.

Procedure


Step 1

Connect Cisco ISE to Catalyst Center:

See the "Integrate Cisco ISE with Catalyst Center" section in "Complete First-Time Setup" in the Cisco Catalyst Center Installation Guide.

These Cisco ISE releases support Cisco AI Endpoint Analytics:

  • 2.4 Patch 11 and later

  • 2.6 Patch 5 and later

  • 2.7 Patch 1 and later

  • 3.0 and later

For Cisco ISE 3.1 and later, in your Cisco ISE administration portal:

  1. Choose Work Centers > Profiler > Settings.

  2. In the Endpoint Analytics Settings area, check these check boxes:

    • Publish Endpoint Attributes to AI Endpoint Analytics

    • Consume Endpoint Profiles from AI Endpoint Analytics

    After Cisco ISE authenticates endpoints through 802.1X or MAB authentication methods, the endpoint attributes collected are made available to Cisco AI Endpoint Analytics. Cisco ISE also shares telemetry data with Cisco AI Endpoint Analytics.

For Cisco ISE 2.4, 2.6, and 3.0, in your Cisco ISE administration portal:

  1. Choose Work Centers > Profiler > Settings.

  2. Choose the Enable Probe Data Publisher option.

  3. Click Save.

Step 2

Connect Cisco 9000 Series access devices to Catalyst Center for wired endpoints visibility.

See "Discover Your Network" in the Cisco Catalyst Center User Guide.

To enable Cisco AI Endpoint Analytics features, upgrade your Cisco 9000 Series access devices to Cisco IOS-XE Release 17.6 or later.

To enable CBAR for the required access devices:

  1. In the Catalyst Center GUI, click the menu icon and choose Provision > Services > Application Visibility.

  2. Select the Cisco Catalyst 9000 access device that you need data from. Check the check box next to the device name in the Site Devices section.

  3. Click Enable CBAR.

  4. Click Yes in the subsequent confirmation window.

  5. In the Enable CBAR slide-in pane, check the check box next to the supported SSID type.

  6. Click Enable.

Step 3

(Optional) Connect Cisco Catalyst 9800 Series Wireless Controllers to Catalyst Center for wireless endpoints visibility.

These Cisco Catalyst 9800 Series Wireless Controller models are supported by Cisco AI Endpoint Analytics:

  • 9800-CL

  • 9800-40

  • 9800-80

  • 9800-L

Catalyst Center supports FlexConnect in Cisco Catalyst 9800 Series Wireless Controllers with Cisco IOS XE Release 17.7.1 and later.

To configure and provision a Cisco Catalyst 9800 Series Wireless Controller in Catalyst Center, see Cisco Catalyst 9800 Series Wireless Controller overview.

Step 4

(Optional) Connect Cisco Catalyst IE9300 Rugged Series switches to Catalyst Center.

The Cisco Catalyst IE9300 Rugged Series switches are supported by Cisco AI Endpoint Analytics.

See “Discover Your Network” in the Cisco Catalyst Center User Guide.

Step 5

(Optional) Connect Catalyst Center Traffic Telemetry Appliance to Catalyst Center for wired and wireless endpoints visibility, and for third-party network device visibility.

Catalyst Center Traffic Telemetry Appliance (DN-APL-TTA-M) generates telemetry from mirrored network traffic for endpoint analytics. This appliance enables Network-Based Application Recognition-based (NBAR-based) protocol inspection and endpoint attribute extraction.

To receive endpoint attributes collected through the telemetry appliance in Cisco AI Endpoint Analytics, you must integrate Cisco ISE with Catalyst Center.

See Traffic Telemetry Appliances for information on installing the appliances, connectivity configurations, and managing the appliances in Catalyst Center.

Enable CBAR on Switched Port Analyzer (SPAN)-receiving ports of access switches connected to Catalyst Center Traffic Telemetry Appliance with this command:

ip nbar protocol-discovery

Not all endpoints that are connected to the telemetry appliances are visible in Cisco AI Endpoint Analytics. Only endpoints that are also connected to Network Access Devices (NADs) that are managed in Cisco Catalyst Assurance are visible in Cisco AI Endpoint Analytics.

Step 6

(Optional) Enable ServiceNow in Catalyst Center.

  1. After connecting ServiceNow to Catalyst Center, click the menu icon and choose Platform > Manage > Bundles.

  2. If the Status of the bundle Endpoint Attribute Retrieval with ITSM (ServiceNow) is New, click Enable for the bundle.

Step 7

(Optional) Enable Cisco AI Analytics in Catalyst Center.

To receive suggestions about AI-based endpoint groupings, automated custom profiling rules, and endpoint labels, and to detect potentially spoofed devices in your network, you must enable the required settings in the Cisco AI Analytics window.

You must install the AI Network Analytics software to receive these AI-based suggestions.

  1. From the main menu, choose System > Settings > External Services > Cisco AI Analytics.

  2. Click the toggle button for each of these services that you want to enable:

    • AI Endpoint Analytics: AI Network Analytics leverages machine learning to drive intelligence in the network and enables you to effectively improve network performance and accelerate issue resolution. AI Network Analytics significantly reduces noise and false positives by analyzing network behavior and adapting to your network environment.

    • Endpoint Smart Grouping: Using AI and Machine Learning, Endpoint Smart Grouping reduces the number of unknown endpoints in your network by providing AI-based endpoint groupings, automated custom profiling rules, and crowdsourced endpoint labels.

    • AI Spoofing Detection: AI Spoofing Detection identifies spoofed endpoints based on pretrained behavioral models. Enabling the Enable AI Spoofing Detection toggle button allows Catalyst Center to detect spoofed endpoints using these behavioral models and the flow information provided by the network devices. Several behavioral models are built and centrally trained using the collected flow information gathered from participating customers.

      • Spoofing detection is done in the cloud and anonymized data export to the cloud from Catalyst Center is mandatory. Catalyst Center then polls the cloud for spoofing detections.

      • An uninterrupted internet connection is required.

      • While upgrading to the latest release, if data export was disabled in the previous release, a warning stating that data export is disabled is displayed upon upgrade. You must re-enable spoofing detection.


Endpoint telemetry sources

Cisco AI Endpoint Analytics receives telemetry data in these ways:

  • Deep packet inspection

    Deep packet inspection is an advanced method of packet analysis that is carried out by Cisco Catalyst 9000 Series access devices. These access devices run NBAR, which inspects application traffic and performs protocol analysis to discover, identify, and profile endpoints with high fidelity.

    Deep packet inspection profiling is based on various attributes that are collected from endpoint traffic to the network. These attributes are collected across multiple protocols, from packet header layers 4 to 7.

  • Configuration Management Database Connection

    Cisco AI Endpoint Analytics receives endpoint data from your Configuration Management Database Connection (CMDB) for greater accuracy in endpoint profiling. The connection with ServiceNow enables you to receive information from the CMDB to Cisco AI Endpoint Analytics.

  • Machine learning capabilities

    Data collected for profiling is anonymized and sent to a Cisco cloud location that serves as a device data lake. Here, machine learning algorithms analyze the data available to create profiling rules that you can evaluate and apply, as needed. Smart profiling rules are suggested through Cisco AI Endpoint Analytics to help make endpoint profiling and management simpler and more efficient for you. Existing rules too are evaluated and improvement suggestions provided based on this continuous learning.

Cisco AI Endpoint Analytics overview window

From the main menu, choose Policy > AI Endpoint Analytics.

The Overview window displays these dashlets:

  • Total Endpoints

    This dashlet displays the total number of endpoints in your network in two groups, Fully Profiled and Partially Profiled. Cisco AI Endpoint Analytics profiles endpoints based on four factors:

    • Endpoint type

    • OS type

    • Hardware model

    • Hardware manufacturer

    If one or more of these factors are missing for an endpoint, it is profiled in the Partially Profiled group.

    Click Partially Profiled Labels to view the number of endpoints in your network with missing profiles, categorized by profile label type. To check the endpoints with a specific missing profile label, click the number next to the profile label. The Endpoint Inventory tab displays with the corresponding list of endpoints.

  • AI Proposals

    Cisco AI Endpoint Analytics uses smart grouping algorithms to group unknown endpoints in your network that have similar profiling data. If you have enabled AI Endpoint Analytics, you will receive these types of rule proposals. These rule proposals are based on learnings from endpoint clusters:

    • New rules for profiling endpoints that may be similar.

    • Modification proposals for previously accepted rules.

    • Review of profiling rules that are no longer needed.

    For more details, see Cisco Al rules for smart grouping.

  • Trust Scores

    The Trust Scores dashlet provides an overall view of the Trust Scores assigned to the endpoints in your network. See Trust Scores for endpoints.

  • Configuration

    Click the Configuration link in the top-right corner of the Overview area to access these configurations:

  • Endpoint MAC Randomization

    The Endpoint MAC Randomization displays the number of static MAC addresses and random and changing MAC addresses in the network. See Trust Scores for endpoints with random and changing MAC addresses.

Cisco Talos Intelligence

Cisco Talos Intelligence is a comprehensive threat-detection network. Talos Intelligence comprises threat-detection analysts and real-time automated detection systems that span web requests, emails, malware samples, open-source data sets, endpoint intelligence, and network intrusions. Integrate Cisco AI Endpoint Analytics with Talos using the Talos IP Reputation feature to flag network connections that reach out to untrusted IP addresses, quarantine them, and protect your network from the most common cyber threats.

Catalyst Center - Cloud communicates with the Talos Intelligence Cloud Service to obtain updated IP reputation data every 30 minutes. These updates are pushed to all registered Catalyst Center devices.

There are two procedures that you can follow to set up Cisco Talos Intelligence in Catalyst Center.

Integrate Cisco AI Endpoint Analytics with Cisco Talos Intelligence through app activation

Before you begin

For the Talos IP Reputation feature to work smoothly, enable application telemetry and choose Catalyst Center as the NetFlow collector. See Configure Telemetry for more information on the NetFlow collector.

This is the recommended procedure.

Procedure

Step 1

In the Catalyst Center GUI, click the menu icon and choose System > Settings > External Services > Cisco Catalyst - Cloud.

Step 2

From the Region drop-down list, choose the appropriate region.

Step 3

Scroll to the Talos Threat Intelligence App.

Step 4

Click Activate on the Talos Threat Intelligence App. The Cisco Cloud Services homepage displays.

Step 5

In the Cisco Cloud Services GUI, click the Menu icon, and click Applications.

Step 6

From the Region drop-down list, choose the appropriate region.

Step 7

Click Activate on the Talos Threat Intelligence App.

If the region is not selected on the Applications window, a Select Region dialog box displays. You can select the required region and then click Activate.

Step 8

Check the check box to agree to the terms and conditions and click Subscribe.

Step 9

In the Choose Your Product window, click Catalyst Center to choose it for Talos Threat Intelligence activation.

Step 10

In the Activate Talos Threat Intelligence Application for your Product window, such as Host Name/IP, Name, and Description (if any). Choose the appropriate type of product being registered from the Type drop-down list, such as Catalyst Center.

Step 11

Click Register.

Step 12

In the Choose Your Product window, click Catalyst Center to select it again and click Select Product.

Step 13

Click Auto Redeem on the Authenticate your Product window to automatically redeem the OTP and authenticate your product. Catalyst Center opens in a new window.

You can also copy the one-time passcode (OTP) and close the window to manually register your product.

Step 14

In the Catalyst Center window that displays, log in using your Catalyst Center credentials.

Note

 
  • After the registration succeeds, close the window before proceeding to Cisco Cloud Services to continue with the workflow.

  • After registering Catalyst Center to Cisco Cloud Services, wait for 3 minutes before proceeding to Step 15.

  • In the Cisco Cloud Services GUI, (Menu > Applications), you can see the registered product with the registration status.

Step 15

Select the scopes needed for your Catalyst Center in the Scope Selection window and click Next.

A Summary window displays that summarizes the application, product, and scope chosen for your Catalyst Center.

Step 16

Click Activate to connect your Catalyst Center to Talos Threat Intelligence.

The status of the activation displays.

Step 17

Do one of these tasks:

  • (If you registered your Catalyst Center device for the first time and activated Talos on Cisco Cloud Services) Click Exit and close the window.

  • (Activated Talos for a preregistered Catalyst Center device on Cisco Cloud Services) Click Exit to return to the Applications window on Cisco Cloud Services. You can find your connected application in the Applications window.


Integrate Cisco AI Endpoint Analytics with Cisco Talos Intelligence using cloud authentication

Procedure

Step 1

In the Catalyst Center GUI, click the menu icon and choose System > Settings > External Services > Cloud Authentication.

Step 2

Click the dna.cisco.com link and create a Catalyst Center - Cloud account.

Step 3

In the Catalyst Center - Cloud GUI, click the Menu icon, click Applications, and choose Products.

Step 4

From the Region drop-down list, choose the appropriate region.

Step 5

Click Register.

Step 6

In the Register Product pane, enter the required details, such as Host Name/IP, Name, and Description (if any). Choose the appropriate type of product being registered from the Type drop-down list, such as Catalyst Center. Click Register.

Figure 1. Registering a Product to Catalyst Center - Cloud
Registering a product to Cisco DNA - Cloud

Note


Check the Enable Cloud Access Login check box to enable automatic login from your Catalyst Center - Cloud to Catalyst Center.

The OTP redemption occurs automatically, and Catalyst Center opens in a new window.

Step 7

In the Catalyst Center window, log in using your Catalyst Center credentials.

  • After the registration succeeds, close the window before proceeding to Catalyst Center - Cloud to continue with the workflow.

  • After registering Catalyst Center device to Catalyst Center - Cloud, wait for 3 minutes before proceeding to Step 8.

Step 8

In the Catalyst Center - Cloud GUI, (Menu > Applications), you can see the registered product with the registration status.

Step 9

In the Catalyst Center GUI, go to the Cisco AI Endpoint Analytics window (AI Endpoint Analytics > Configurations > Trust Analytics) and click the Talos IP Reputation toggle button to enable it. You can enable Talos IP Reputation from either the Trust Score Sources window or the System > Settings window.

After Talos IP Reputation is enabled, Catalyst Center receives the updated IP Reputation data whenever it’s available. If an endpoint in the network tries to access an untrusted IP address, it’s flagged, and a warning message stating Detected is displayed for Talos IP Reputation in the Trust Score view for an endpoint. This warning reduces the overall trust score of the endpoint. The Talos IP Reputation feature stores information about the untrusted IP addresses accessed and the number of access attempts made by an endpoint. This information is useful when deciding about increasing the security of your network.

The Talos Reputation window (System > Settings > Talos IP Reputation) displays the latest versions of the various files received from Talos. The time at which these files was received is also displayed. IPv4 and IPv6 files are Talos IP Reputation data files and are typically updated once a day. However, the Threat Level file is metadata and changes to this file are rare.


Publish authorization attributes to Cisco ISE

Publish Cisco AI Endpoint Analytics profile data to Cisco ISE to authorize endpoint access to the network and for endpoint control. The attribute information that is shared by Cisco AI Endpoint Analytics is then easily accessible to a Cisco ISE administrator through the AI Endpoint Analytics dictionary. A Cisco ISE administrator can easily create authorization policies in Cisco ISE. The attributes are shared with Cisco ISE, including:

  1. The overall trust score and the score for each anomaly that is recorded.

  2. CMDB attributes.

  3. Multifactor profiling attributes:

    • Hardware manufacturer

    • Hardware model

    • Operating system

    • Endpoint type

If your Catalyst Center has an active integration with Cisco ISE Release 3.1 and later releases, and you want to publish authorization attributes to Cisco ISE, do these tasks.

Procedure


Step 1

To enable attribute sharing in Catalyst Center:

  1. In the Cisco AI Endpoint Analytics Overview window, click Configurations.

  2. Click ISE Integration from the left panel.

  3. Click the Enable Profile Publishing to ISE toggle button to enable the feature.

  4. Check the Asset Topic Based Integration or Enhanced Authorization Integration check boxes, or both, depending on which type of topic you want to use to publish attribute information to Cisco ISE.

  5. Click Save.

Step 2

To enable pxGrid subscription in Cisco ISE:

  1. In the Cisco ISE GUI, click the menu icon and choose Work Center > Profiler > Settings.

  2. If you are connected to Cisco ISE Release 3.1, in the Endpoint Analytics Settings area, check these check boxes:

    • Publish Endpoint Attributes to AI Endpoint Analytics

    • Consume Endpoint Profiles from AI Endpoint Analytics


What to do next

To verify the subscription, from the Cisco ISE main menu, choose Administration > pxGrid Services > Diagnostics > WebSocket > Clients. The newly created subscription containing “com.cisco.ea.data.ise-<Cisco ISE node>” displays in the Subscription column of the PSN nodes.

In the Cisco ISE Policy > Policy Sets window, a new dictionary that is named Endpoint-Analytics is visible in the Conditions Studio.

In the Cisco ISE Context Visibility > Endpoints window, click MAC Address for endpoint details. The attributes area of the details displays attributes that contain "EA-" prefixes for the attributes that are received from Cisco AI Endpoint Analytics.

Trust Analytics

The Trust Analytics window displays the various trust score sources, enables you to reset alerts raised on these sources manually or automatically after a period of inactivity, and sets the impact level for each trust score source to accurately measure the overall trust score of an endpoint.

Trust Score assesses the trustworthiness of a given endpoint on the network to help achieve zero trust outcomes. Values range from 1 (low trust) to 10 (high trust) and are calculated using several sources:

  • Endpoint Context: This category of sources provides information about the reliability of an endpoint, by knowing the authentication method used by the endpoint and posture status of the endpoint.

  • Threat and vulnerability Context: This category of sources provides information about how vulnerable an endpoint is based on the various types of threats associated with an endpoint.

  • Network Context: This category of sources provides information about how an endpoint is accessing the network.

Trust Score Impact allows you to control the trust score of an endpoint when an anomaly is raised. These impact levels are available:

  • Low: When you know that an anomaly is of low importance in your network, you can set its impact level to Low so that it has a low impact on the trust score. After setting this impact level, when such an anomaly is detected again, the trust score for the endpoint on which the anomaly is detected sluggishly reduces to 1 (Increases system-generated impact level by 50% of total trust score).

  • Critical: When you know that an anomaly is of high importance in your network, you can set its impact level to Critical so that it has a very high impact on the trust score. After setting this impact level, when such an anomaly is detected again, the trust score for the endpoint on which the anomaly is detected quickly reduces to 1 (Reduces system-generated impact level by 50% of total trust score).

  • No Impact: An anomaly is detected, but does not impact the overall trust score. You can use this option to test out the anomalies and view them without changing the overall trust score.

  • System Default: Default system-generated trust score.

To know how to customize impact levels for the sources, see Customize Impact Level.

Alerts appear when there is a deviation caused by anomalies or vulnerabilities, or when a weakness is identified in endpoint connections or interfaces. The alerts can be reset manually after addressing them. You can also manually reset the alerts you don't want to address. Alternatively, you can set a reset timer to reset the alerts automatically. After a period of inactivity, this alert is not detected on endpoints.

To know how to reset alerts for the sources, see Reset Alert.

Customize impact level

You can now customize the trust score of an endpoint by setting an impact level that you perceive for an endpoint. Based on the impact level that you set for a source, the overall trust score is recalculated for the endpoints. This gives you the authority to decide the trust level of an anomaly irrespective of the system-generated trust score for that anomaly.


Note


For authentication method EAT-TLS and posture non-compliant endpoints, even if you change the impact level, the trust level remains the same. The trust level is only changed in the case of MAB authentication.


Note


The high trust score that is earned because of the authentication method used, is not lowered even when the impact level for the authentication method is changed. If the impact level for the authentication method is increased, the endpoints continue to retain their current trust score unless a new session for that endpoint is received.


Procedure

Step 1

From the main menu, choose Policy > AI Endpoint Analytics > Overview > Manage Sources.

The Trust Analytics window opens.

Step 2

Click Customize Impact Level.

Step 3

Click Let's Do It.

The Customize Trust Score Sources workflow begins. You can exit the workflow at any point in time by clicking the Exit option at the bottom of the workflow window.

Step 4

Check the checkboxes next to the sources for which you want to change the impact level.

Step 5

From the More Actions drop-down list, choose the New Impact Level.

Step 6

Click Next.

In the next window, a comparative study of the previous and new trust score is provided that shows the trust score customization impact on individual endpoints. This pie chart includes all the endpoints in the network irrespective of whether or not they were impacted by the change in the impact level of the sources. The Endpoints (After) table below displays the new trust score for each endpoint that was impacted as a result of the change in the impact level configuration.

Step 7

Click Next.

A summary stating the new impact level of each source is displayed. Click Edit to go back in the workflow to edit the impact level of the trust scores in case you are not satisfied with the result.

Step 8

Click Next.


The endpoints' trust scores are updated accordingly and is also sent to Cisco ISE. This may result in a change of authorization for such endpoints if Cisco ISE is using trust score based authorization policies.

What to do next
Check the new trust score for the endpoints in Policy > AI Endpoint Analytics > Trust Score.

Configure reset alert

You can reset an alert manually or automatically after a period of inactivity. By default, the reset action is set to Manual for all supported sources. You can configure to reset an alert using the global configuration workflow as described here.

Procedure

Step 1

From the main menu, choose Policy > AI Endpoint Analytics > Manage Sources.

The Trust Analytics window opens.

Step 2

Click Alert Configuration.

Step 3

In the Choose Reset Alert Type window, click Let's Do It.

You can exit the workflow at any point in time by clicking the Exit option at the bottom of the workflow window.

Step 4

From the Reset Alert Type drop-down list, choose Manual or Customize reset timer after alert inactivity.

Step 5

If you choose Customize reset timer after alert inactivity, enter the number of days (0 to 365 days) or hours (0 to 24 hours), after which you want to reset the alert, in case of inactivity.

You can choose to remove or retain the ANC Policy. If the endpoint has a trust value from more than one trust score source, the ANC policy will not be removed even if the Remove ANC Policy checkbox is checked.

Step 6

Click Next.

Step 7

Check the check boxes next to all the sources for which you want to apply the setting that you chose in Step 4.

Step 8

Click Apply.


You can also configure to reset an alert locally from the Trust Analytics window. Choose the source for which you want to configure the reset alert. In the slide-in window on the right, choose the appropriate setting and click Save.


Note


The reset alert configuration option is not available for all sources. When the alerts are reset, the same information is propagated back to Cisco ISE.


The alerts are checked every 30 minutes for an update. And if, during any of the checks, the time period configured in the reset alert configuration has lapsed, the trust score is reset for that anomaly. The status of the reset alert will be displayed in the Audit log.

Endpoint Purge Policies

Define an Endpoint Purge Policy to remove from your network the endpoints that have been inactive for a defined time. You can define the period of inactivity after which an endpoint must be removed. You can also customize a purge policy to act on a particular set of endpoints based on a profiling attribute. Purge policies are executed at 2 A.M. (server time) every day, and the endpoints that meet the defined purge requirements are removed from your network.

Registered endpoints and static endpoints that are imported into Cisco AI Endpoint Analytics are not affected by endpoint purge policies.

The Backup and Restore operation in your Catalyst Center and the endpoint purge activity cannot run simultaneously. If a Backup and Restore operation is in progress at 2 A.M., the purge activity is not initiated. If a Backup and Restore operation starts while an endpoint activity is in progress, the endpoint purge stops running, and the purge activity is left incomplete. The remaining endpoints are not acted on until the next purge is executed at 2 A.M. (server time) the next day.

To view, edit, or add endpoint purge policies, click the menu icon and choose Policy > AI Endpoint Analytics > Configurations > Endpoint Purge Policy. The following policies are available by default:

  • Default

  • Random MAC Default

You cannot edit these default policies. You can only enable or disable them.

You can use the Purge Now option to immediately run the purge policy instead of waiting until 2 AM. There are two ways to use the Purge Now option:

  • Choose the purge policies that you want to run now and from the More Actions drop-down list, choose Purge Now.

  • Click the icon under the Actions column for the purge policy that you want to run now and choose Purge Now.

Create a Purge Policy

Procedure

Step 1

From the main menu, choose Policy > AI Endpoint Analytics > Configurations > Endpoint Purge Policy.

Step 2

Click Add Endpoint Purge Policy.

Step 3

In the Add Endpoint Purge Policy dialog box, click Let's Do It to go directly to the workflow.

Step 4

In the Define Policy Details window, do these steps:

  1. Enter a name for your policy in the Rule Name field.

  2. From the Select Status drop-down list, choose Enabled or Disabled.

  3. Define the time of inactivity after which an endpoint must be purged. Enter a value (in days) in the Elapsed Greater than or Equal to field. The accepted value range is from 5 to 180 days.

Step 5

(Optional) In the Define Additional Policy Conditions window, choose the profiling attributes, to filter the endpoints that are impacted by this purge policy. Check the check box next to the attribute you want to select and choose the required values from the drop-down lists displayed for the attribute.

Step 6

The Summary window displays your Purge Policy configuration. Review the details that are displayed and click Done to create the policy.


What to do next
Audit Logs of Endpoint Purge Activities

After you enable an Endpoint Purge Policy and a purge activity is executed, you can view the audit logs. For more information, see View Audit Logs in the Cisco Catalyst Center Administrator Guide.

Configure endpoint subnet inspection

In a deployment, devices at the access layer and devices above the access layer have different IP subnets. In the case of Cisco TTA devices, endpoint profiling accuracy is optimum when only southbound traffic is analyzed by Cisco AI Endpoint Analytics. To allow better endpoint profiling, configure specific IP subnets or subnet ranges that must be analyzed by Cisco AI Endpoint Analytics.

This configuration of filtered subnets is then shared with Cisco SD-AVC servers. The configuration is applied on Cisco TTA devices though Cisco SD-AVC servers.

Procedure


Step 1

From the main menu, choose Policy > AI Endpoint Analytics > Configurations > Endpoint Subnet Inspection.

Step 2

Enter the required value in the IP Subnet field.

Step 3

Click + to add another IP subnet. You can add multiple subnets or subnet ranges in this window.


Endpoint Inventory

The Endpoint Inventory tab displays details of the endpoints that are connected to Cisco AI Endpoint Analytics through the configured data sources. This view displays the profiling information of all the connected endpoints.

To select the profiling information you want to view for the endpoints, click the vertical ellipsis icon at the top-right corner of the table. Select one of these sets of profiling information and click Apply:

  • All: All the profiling information that is available is displayed. You cannot edit this set.

  • General: This is a selection of profiling information that gives you a generic view of the endpoints. This is the set of columns that are displayed by default. You cannot edit this set.

  • Detailed: This is a selection of profiling information that provides a deeper view of the endpoints. You cannot edit this set.

  • Custom: This is the only set that you can edit. Check or uncheck the profiling information that you want to view in the Endpoint Inventory window.

You can also filter the list endpoints that is displayed in the All Endpoints view by clicking the required View Known Profiles buttons. You can filter the list of endpoints by Endpoint Type, Hardware Manufacturer, Hardware Model, and OS Type.

To edit or customize the endpoint inventory table that is displayed, click the gear icon in the right corner at the top of the table. The pane that is displayed contains the Table Appearance, Edit Table Columns, and Edit Custom Views menus where you can select a table view, the information that you want displayed in the table, and create custom views.

Click Apply to save the changes, or click Reset All Settings to apply the default settings for the endpoint inventory table.

You can easily filter a set of endpoints based on your requirement. The search bar at the top of table allows you to easily find a filter parameter. You can type and use the assisted search feature, or you can scroll the drop-down that is displayed to find and select the required parameters.

Most of the columns contain quick filters. While some filters display drop-down menus for you to select values from, some filters are text fields you can type into.

You can register endpoints, and edit, delete, and profile the registered endpoints. You can select single or multiple endpoints by checking the check box near the MAC addresses to filter and perform a particular action on the chosen endpoints from the Actions drop-down list.

You can delete registered endpoints, unregistered endpoints, and endpoints learned from other sources. When you select an endpoint, a banner row is displayed that allows you to select all the rows in the table. When you click the banner, the banner row now allows you to clear all the rows in the table. To delete all the endpoints, you can click the banner or select the Delete option from the More Actions drop-down list.

To see the complete profiling details of an endpoint, click the MAC Address of the endpoint. A slide-in dialog box is displayed which contains user details, endpoint details, and attribute details of the endpoint.

In the Details tab, these fields display the details received from Cisco ISE:

  • Authentication Status: This field displays Started when an endpoint is authenticated through Cisco ISE, and Disconnected when it is not.

  • Authorization Profile: The authorization policies configured for an endpoint in Cisco ISE are displayed here.

  • Security Group Tag: The Security Group Tags configured for an endpoint in Cisco ISE are displayed here.

For information on these attributes, see the Cisco ISE Administrator Guide for the Cisco ISE release that you use.

The Trust Score tab is available in the slide-in dialog box for endpoint details. This tab displays details of the various factors that inform trust score of an endpoint. See Trust Scores for endpoints.

The Details tab contains the Previous MAC Addresses area, which displays the MAC addresses that have been used by an endpoint that has the MAC Randomization feature enabled on it. See Trust Scores for endpoints with random and changing MAC addresses.

Export Cisco AI Endpoint Analytics data

To export a list of endpoints and their details from this window, click Export. If you apply any filters in the Endpoint Inventory window, only the filtered endpoints will be processed for export. To export the details of all the endpoints, ensure that no filters are applied when you click Export.

When you click Export, a new tab opens with the Reports window. The Generated Reports window contains a list of exports initiated, with the latest export request at the top of the list. A report generated from the Endpoint Inventory window contains AI Endpoint Analytics in its Template Category column. Report generation takes a few minutes. When a report is ready for download, the value in the Last Run column changes from Not Initiated to a timestamp with a download icon next to it. The timestamp refers to the time at which the export list was generated. Click the download icon to download a CSV file of the list of endpoints to your system.

You can also export Cisco AI Endpoint Analytics data from the Reports window, through these steps:


Note


You must run your first export of AI Endpoint Analytics data for endpoints from the Endpoint Inventory window. Then you can generate AI Endpoint Analytics reports directly from the Reports window.


Procedure


Step 1

From the main menu, choose Reports > Report Templates > AI Endpoint Analytics.

Step 2

If a task overview window appears, click Let's Do It to go directly to the workflow.

Note


To skip this screen in the future, check the Don't show this to me again check box.

Step 3

In the Select Report Template window, the template Endpoint Profiling applies by default.

Step 4

In the Setup Report Scope window, do these steps:

  1. Enter a name in the Report Name field.

  2. Define the filters that you want to apply to the list of endpoints that you want to export from the Endpoint Inventory window.

  3. To export the details of all endpoints, do not choose any values in the Scope area.

Step 5

In the Select File Type window, the Client Details area allows you to review the chosen parameters. Edit the information to be exported by checking or unchecking the check boxes next to the relevant fields.

Step 6

In the Schedule Report window, click Run Now, Run Later (One-Time), or Run Recurring radio button.

Note


The Run Later (One-Time) and Run Recurring options display scheduling fields to define the time of export.

Step 7

In the Delivery and Notification window, do not check the Email Report check box.

Step 8

In the Summary window, review all the configurations. To make any changes, click Edit.

Step 9

Click the View Reports link in this window for a list of generated reports. It takes a few minutes for the report to generate and display in this window.


Filter endpoints

Use this procedure to filter endpoints based on their profiling data, primary profiling labels, known profiles, and health status.

Procedure


Step 1

In the Endpoint Inventory window, click Filter.

Step 2

Define these filters by choosing a value from the corresponding drop-down list, clicking the radio button for the required value, or checking the check box next to the required value for a particular field, as applicable:

  • Profile Status Condition

  • Mac Address

  • Is Random Mac

  • Trust Score

  • IP Address

  • Last Seen

  • Host Name

  • Endpoint Type

  • OS Type

  • Hardware Model

  • Hardware Manufacturer

  • Registered

Step 3

Click Apply.

You can also filter the profiled endpoints displayed by the four primary profiling labels. Click one or more of the labels in the View Known Profiles section.

The health status of endpoints is updated every 5 minutes.


Attribute Glossary

Attribute glossary is a list of all the profiling attributes available from Cisco ISE probe data.

Use this procedure to view all the profiling attributes.

Procedure


Step 1

In the Endpoint Inventory window, click the MAC address of an endpoint.

Step 2

In the new area that is displayed on the right side, click View Attribute Glossary.

The Attribute Glossary window displays information for each attribute, including:

  • Key profiling attributes

  • Description

  • Associated Profile Labels

  • Source

  • Dictionary

  • Discovery Method

The glossary gives you a detailed view of all the profiling attributes. If a profiling attribute is frequently used to create a profile label, the label is listed in the Associated Profile Labels column.

You can also view the attribute glossary in the Choose Attribute Condition window while creating a logical condition for the rules. For more information, see Create a Custom Rule.


Register endpoints

You can onboard and profile new endpoints by registering them in Cisco AI Endpoint Analytics. The profiling information of an endpoint is the source of truth for classification. You can also update new profile information for a registered endpoint using the Register Endpoint option.

Procedure


Step 1

Choose Actions > Register Endpoints.

Step 2

Select whether you want to register a single endpoint or multiple endpoints, by clicking the Single or Bulk radio button.

  1. Click Single radio button, enter the MAC Address, Endpoint Type, Hardware Model and Hardware Manufacturer for the endpoint.

  2. Click Bulk radio button and do these steps:

    1. Download a .csv template by clicking the Download .csv Template option.

    2. In the downloaded .csv file, enter these details for each endpoint you must register: MAC address, endpoint type, hardware model, and hardware manufacturer. Save this file.

    3. Upload the .csv file using the Choose a File option.

    You can register a maximum of 500 endpoints at a time using the Bulk option.

Step 3

In the Review Endpoint window, review the endpoint details. To make any changes, click Edit.

Note


While registering an existing endpoint, the profile label changes of the endpoint are reflected in purple color and can be edited.

Step 4

Click Next to continue with the registration process.

Step 5

Click Register.


Edit registered endpoints

You can update the profiling information of registered endpoints from the Endpoint Inventory window.

Procedure


Step 1

Check the check box adjacent to the MAC address of the endpoint that you want to edit.

Step 2

Click Actions.

Step 3

Click Edit Endpoint.

Step 4

Enter the Endpoint Type, Hardware Model, and Hardware Manufacturer details.

Step 5

Click Save.


Delete registered endpoints

If there are registered endpoints that are no a longer part of your network, you can delete them from Cisco AI Endpoint Analytics.

Procedure


Step 1

Check the check box adjacent to the MAC address of the endpoints that you want to delete.

Step 2

Click Actions.

Step 3

Click Delete Endpoint.

This message displays:

Do you really want to delete the selected endpoint(s)?

Step 4

Click Yes to permanently delete the endpoint from Cisco AI Endpoint Analytics.


Trust Score

The Trust Score window consists of two tabular sections:

Alerts:

Alerts appear when there is a deviation caused by anomalies or vulnerabilities, or when a weakness is identified in endpoint connections or interfaces. These alerts reflect a detection that has a negative impact on the trust score (such as concurrent MAC address detection, NAT mode, or other untrustworthy changes). You can monitor the alerts to quickly address the most urgent risks within your network.

The Alerts tab displays the various alerts received by the endpoints in the network. Earlier you had to individually check the details for each endpoint to see the type of alerts the endpoint has received and there was no way to know what other endpoints have received the same alert. Now, you have the capability to know all the endpoints that have received a particular type of alert. You can click on any alert to view the list of endpoints that have received this alert. You can further click on each endpoint to see the details. The alerts can be in any of these three states:

  • Open: An alert is in the open state when the alert is initially detected for an endpoint and an action is required from your side to resolve the alert or address it later.

  • Disabled: If you do not want to take any action on an open alert, you can move it to the disabled state. You can disable the alert for any time period and even indefinitely. During this time period, the alert remains in the disabled state even if any new endpoints are detected with this alert.

  • Reset: If you do not want to take any action on an alert right away, you can move it to the reset state. When this alert is detected on another endpoint after resetting, the alert is brought back to the open state.

Endpoint:

This view displays columns for the various factors that inform the overall Trust Score of an endpoint. The Trust Score helps you identify the endpoints in which behavioral anomalies have been detected, so you can examine the details of the endpoint and take the necessary remediation actions. If you apply an ANC policy to an endpoint to manage its low Trust Score, the Trust Score view also displays the name of the ANC policy applied and when the policy was applied. See Trust Scores for endpoints.

Using the option Reset Trust Score, you can now reset multiple endpoints at the same time with an upper limit of 10 endpoints to avoid any performance issues. While resetting the endpoints, a justification is required for the action for audit purposes. After an endpoint is reset, the endpoint is cleared of its Trust Score and any ANC policy that was applied to it.

Trust Scores for endpoints

Cisco AI Endpoint Analytics assigns Trust Scores to endpoints to allow you to easily monitor and act on potentially risky endpoints in your network. Behavioral anomalies are monitored and tracked, and a Trust Score is assigned based on the number and frequency of the anomalies tracked.

To select the sources that must be included in the calculation of Trust Scores, from the Cisco AI Endpoint Analytics Overview window, choose Configuration > Trust Analytics. Click a source to open its slide-in configuration window on the right. Click the toggle button to enable the source.

Cisco AI Endpoint Analytics generates historical Trust Scores based on these factors:

  • The history of anomalies associated with an endpoint—how many anomalies have been detected for this endpoint?

  • The severity of each anomaly detected for the endpoint.

The overall Trust Score calculation for an endpoint factors in these anomalies and scores display for each anomaly that is detected (if the corresponding source is enabled):

  • AI Spoofing Detection

    Cisco AI Endpoint Analytics analyzes NetFlow telemetry data, and network probe data from Cisco ISE and SD-AVC devices, to detect spoofed endpoints. For more information on how to configure NetFlow Collector servers, see Configure syslog, SNMP traps, NetFlow Collector servers, and wired client data collection using telemetry. Probe and NetFlow data from Catalyst Center Traffic Telemetry Appliances (DN-APL-TTA-M) is also analyzed. Configure inbound span of traffic toward your Catalyst Center Traffic Telemetry Appliances so the endpoint traffic data is then available to Cisco AI Endpoint Analytics for spoofing detection.

    Each endpoint type has a behavior model that is developed using machine learning algorithms. Based on the data received for an endpoint, if an endpoint’s behavior is unexpected of its endpoint type profile, the endpoint is assigned a low Trust Score in the AI Spoofing Detection area. The applications and server ports that are used by an endpoint are analyzed in this spoofing detection process. For example, if an endpoint profiled as a printer uses a video calling application, it is identified as a spoofed endpoint and assigned a Trust Score.

    Endpoints are identified by their MAC addresses on a Catalyst Center-managed switch. Several endpoints using a single MAC address such as by using NAT, running a virtual machine or a container, is not a supported configuration on Cisco AI Endpoint Analytics.

    AI Spoofing Detection covers these device types:

    • IP Phones

    • Printers

    • Cameras

    • Building automation devices with these hardware model attributes:

      • Automated-Logic-Device

      • Honeywell-Device

      • Johnson-Controls-Device

      • Rockwell-Automation-Device

      • Schneider-Electric-Device

      • Siemens-Automation-Device

      • Siemens-Building-Device

      • Trane-Device

    • Telepresence:

      • Endpoints with one of these hardware models:

        • Cisco-Tandberg-Device

        • Cisco-TelePresence

        • Cisco Telepresence SX80

        • Cisco Telepresence SX20

        • Cisco-Collaboration-Room-Endpoint

        • Poly-Device

      • Endpoints with the device type Video Conferencing

  • Endpoint Attribute Conflict

    When a device joins a network, and then through periodic probing while the device is active, the profiling data for an endpoint is continuously monitored and updated. Certain changes in the profiling data that is received from an endpoint are flagged as anomalies in Cisco AI Endpoint Analytics. For example, if an endpoint was first profiled as a Linux device and is then profiled as a macOS device, this is flagged as a high-severity anomaly. A score is assigned in the Endpoint Attribute Conflict column for the endpoint and the endpoint’s overall Trust Score is also updated to reflect this change.

    However, if there is a change in the version of macOS and the endpoint appears to have downgraded from a later release to an earlier release, such a change is flagged as a lower priority anomaly and the corresponding scores are updated accordingly.

  • NAT Mode Detection

    If you have a NAT-enabled router in your network, an endpoint that is connected to a NAT router is recognized by the IP or MAC addresses of the router instead of the IP or MAC addresses of the specific endpoint. Information on NAT-enabled routers is collected from the Cisco Catalyst 9000 Series devices they are connected to.

  • Concurrent MAC Addresses

    Identify the endpoints that share the same MAC addresses and are connected to Cisco Catalyst 9000 Series devices. The endpoints with shared MAC addresses are assigned a Concurrent MAC Address score, and you can easily identify these endpoints and examine their details.

  • Security Sensor

    With the Security Sensor scan feature, you can install active probes on specific Cisco Catalyst 9000 Series switches, and configure Cisco AI Endpoint Analytics to scan endpoints for open ports that are not expected to be open, for credential vulnerabilities or both.

The Trust Score of an endpoint is also informed by the events that are collected from Cisco ISE. Every endpoint that authenticates through Cisco ISE receives an initial Trust Score based on these events:

  • Authentication Method

  • Posture


Note


For the Trust Score sources that receive data from Cisco Catalyst 9000 Series devices, you must enable CBAR on the devices and upgrade the devices to Cisco IOS-XE Release 17.6 or later.


The Trust Score that displays in the Endpoint Inventory window is the overall trust score that takes the history and severity of anomalies for an endpoint. Click the MAC Address to view the details of the causes for the Trust Score that is assigned to an endpoint. This means that if a low-level anomaly was detected for an endpoint, and this is the only instance of an anomaly, the overall Trust Score for the endpoint would be a 9.

If multiple low-level anomalies are detected, the overall Trust Score would further decrease to account for the number of anomalies.

The trust scores assigned range from 1 through 10, and are categorized in this table:

Trust Score category Range Threat level of endpoint

Low

1–3

High

Medium

4–6

Moderate

High

7–10

Low

You can then apply Adaptive Network Control (ANC) policies from Cisco ISE to enforce appropriate remediation actions on the endpoints. See section “Adaptive Network Control” in Chapter “Cisco ISE Admin Guide: Maintain and Monitor” of the Cisco ISE Administrator Guide.

The ANC policies are defined in Cisco ISE and allow you to apply remediation actions on chosen endpoints. You can apply ANC policies to quarantine, shut down, or port bounce an endpoint, or force endpoint reauthentication. When you apply an ANC policy to an endpoint with an undesirable Trust Score in Cisco AI Endpoint Analytics, a Change of Authorization (CoA) is sent to the endpoint from Cisco ISE.

An endpoint is identified by its MAC address. Cisco ISE sends the CoA to the endpoints that hold an active session for the identified MAC address at the time of the ANC application. Any endpoint with the same MAC address that does not have an active session in Cisco ISE at the time matches the ANC policy when a new session starts or when it must reauthenticate at the end of the configured reauthentication timer.

To verify which endpoint is being acted upon by the ANC policy, log in to your Cisco ISE administration portal. From the main menu, choose Operations > RADIUS > Live Sessions. Enter the MAC address of the spoofed endpoint in the Endpoint ID column, to filter the endpoints that share the same MAC address and currently have live sessions in Cisco ISE. These are the endpoints that will be affected by the ANC policy.

To view a historic log of the RADIUS sessions in Cisco ISE, from the main menu, choose Operations > Reports > Reports > Endpoints and Users > RADIUS Authentications.

To view or modify ANC policy application on endpoints in Cisco ISE, from the main menu, choose Context Visibility > Endpoints. Check the check box next to the MAC address of an endpoint and click the options that are displayed at the top of the list, as required.

Prerequisites

Prerequisites for receiving Trust Scores for endpoints:

  • Cisco ISE is connected to your on-premises Catalyst Center.

  • Network access devices are managed by both Cisco Catalyst Assurance and Cisco ISE.


    Note


    The endpoint spoofing detection feature supports a maximum of 500 network access devices with NetFlow export flows, as Cisco Catalyst Assurance supports only 500 NetFlow exporters.


  • Endpoints connected to network access devices are authenticated through Cisco ISE.

  • Enable the required sources for Trust Score calculation in the Trust Score Sources window (Policy > AI Endpoint Analytics > Configurations > Trust Analytics).

Endpoint Attribute Conflict

Cisco AI Endpoint Analytics collects data from multiple probes from different sources continually to derive accurate profile labels for endpoints. Cisco AI Endpoint Analytics collects this data from these sources:

From Cisco ISE:

  • RADIUS probes.

  • User details from Directory.

  • VPN details like AnyConnect availability.

  • Optionally, other data if port forwarding is configured. For example, DHCP details.

From switches:

  • Device connection messages. For example, DHCP and NetBIOS messages.

  • Deep packet inspection

  • Switch telemetry

Cisco AI Endpoint Analytics creates system rules based on the information received from these sources. When a device joins a network, and then through periodic probing while the device is active, the profiling data for an endpoint is continuously monitored and updated.

Certain changes in the profiling data received from the endpoint are flagged as anomalies in Cisco AI Endpoint Analytics. For example, if an endpoint was first profiled as a Linux device and is then profiled as a macOS device, this is flagged as a high-severity anomaly. A score is assigned in the Endpoint Attribute Conflict column for the endpoint and the endpoint’s overall Trust Score is also updated to reflect this change.

However, if there is a change in the sub-version of macOS and the endpoint appears to have downgraded from a later release to an earlier release, such a change is flagged as a lower priority anomaly and the corresponding scores are updated accordingly.

In the Endpoint Inventory window, click the MAC Address of an endpoint with a Endpoint Attribute Conflict score to view the profiling data changes recorded. The old and new profiles for the endpoints are displayed here. If the profiling changes are not of concern for any reason, or if you think the profiling change detected is erroneous, reset the score by clicking the corresponding button in the Endpoint Attribute Conflict area of the endpoint’s details.

You can also disable Endpoint Attribute Conflict detection for a specific endpoint by clicking the toggle button in the Endpoint Attribute Conflict area of the endpoint’s details.

Data regarding this anomaly is sent to Cisco ISE if the affected endpoint is connected to Cisco ISE. The data is available as an Endpoint Analytics dictionary attribute that a Cisco ISE administrator can easily use to define policies.

Endpoint Attribute Conflict detection is not available for the endpoints that have Custom Rules applied to them.

NAT Mode Detection

Network Address Translation (NAT) allows private IP internetworks that use nonregistered IP addresses to connect to the Internet. NAT can be configured to advertise to the outside world only one address for the entire network. If you have a NAT-enabled router in your network, an endpoint connected to a NAT router is recognized by the IP or MAC addresses of the router instead of the IP or MAC addresses of the specific endpoint. Information on NAT-enabled routers is collected from the Cisco Catalyst 9000 Series devices they are connected to.

NAT detection is included in Trust Score calculation as a device acting as a NAC-enabled router could allow unauthorized endpoints to connect to your network. For the endpoints that are assigned a NAT Mode Detection score, in the Endpoint Inventory tab, click the MAC Address to view the details of the endpoint in a slide-in window. If you are certain that the identity of the endpoint corresponds to a NAT-enabled router in your network:

  1. Click NAT Mode Detection in the Trust Score tab of the details slide-in window.

  2. Click the toggle button to disable NAT Detection for this specific endpoint.

Endpoints with concurrent MAC addresses connected to Cisco Catalyst 9000 Series devices

Identify the endpoints that share the same MAC addresses and are connected to Cisco Catalyst 9000 Series devices. The issue of endpoints with concurrent MAC addresses occurs in wired environments and in hybrid environments that contain wired and wireless deployments. In a wireless environment, concurrent MAC addresses do not occur as only one endpoint with a specific MAC address is allowed to access the network at any time.

Cisco AI Endpoint Analytics allows you to identify the endpoints with concurrent MAC addresses by assigning a Concurrent MAC Address score to the endpoints. To detect endpoints with shared MAC addresses in your network, you must enable CBAR in the connected Cisco Catalyst 9000 Series devices.

When devices with the same MAC Address connect to a Cisco Catalyst 9000 Series device, the endpoints are recognized as concurrent endpoints and a low score is assigned to the MAC Address. Endpoints with concurrent MAC addresses may be connected to:

  • The same Cisco Catalyst 9000 Series device from different VLANs

  • Different Cisco Catalyst 9000 Series devices

Table 1. Environments in which the concurrent MAC address issue occurs
Deployment 1 Deployment 2 Can concurrent MAC addresses occur in the network? Concurrent MAC addresses detection support in this environment

Wired

Wired

Yes

Yes

Wired

Wireless

Yes

Yes

Wireless

Wired

Yes

Yes

Wireless

Wireless

No

No

The Trust Scores view of the Endpoint Inventory tab contains the Concurrent MAC Address column. Shared MAC addresses are detected as an anomaly and a low score is assigned in the Concurrent MAC Address column. Click the MAC Address to view a slide-in window with the details of the MAC Address. Click Concurrent MAC Address and the field expands to display information regarding the various sources of the MAC address.

In the Concurrent MAC Address area, the Network Device Name column displays the name of the Cisco Catalyst 9000 Series device to which an endpoint is connected. The Interface and VLAN columns display the corresponding values to help you identify how the endpoint is connected to the network.

Initial Trust Score assessment using Posture and authentication values from Cisco ISE

When an endpoint authenticates through Cisco ISE, a Trust Score is immediately assigned to the endpoint based on its authentication and posture details. Authentication Method score is assigned by default and you cannot disable or act upon this score. You can choose to enable or disable Posture-based scores, either at a global level from the Configurations window, or for a particular endpoint in the Endpoint Inventory tab. The Trust Score that is assigned based on the Authentication Method and Posture values becomes the initial Trust Score for the endpoint.

Any other anomalous behaviors detected for this endpoint would then impact this initial Trust Score and drive it lower based on the severity and number of the anomalies.

The Authentication Method score, displayed in the details of an endpoint in the Endpoint Inventory tab, is based on the perceived security level of the authentication method used. For example, WebAuth Over HTTPS, certificate-based authentication, and authentication using secure tunnels receive high Trust Scores.

The Posture score is based on whether or not the connect endpoint is posture compliant.

If an endpoint's Trust Score consists of only the Authentication Method score, the Reset Trust Score button is inactive. When a Trust Score source other than the Authentication Method displays a score, you can use the reset option.

Trust Scores for endpoints with random and changing MAC addresses

As a privacy measure, mobile devices increasingly use random and changing MAC addresses for each SSID that they connect to. Some desktop operating systems offer users the ability to randomize MAC addresses at regular intervals as well. This means that an endpoint presents different MAC addresses every time they connect to a different SSID.

Cisco AI Endpoint Analytics enables you to handle the issue of random and changing MAC addresses by receiving from Cisco ISE a unique endpoint identifier called the DUID (also known as GUID in Cisco ISE). Cisco AI Endpoint Analytics then uses the DUID as the identifier for an endpoint, instead of its MAC address. For more information how GUIDs are assigned in Cisco ISE, see Cisco ISE Administration Guide, Release 3.1.

The Endpoint MAC Randomization dashlet in the Cisco AI Endpoint Analytics Overview window displays a graphical representation of how many endpoints in your network are using random and changing MAC addresses.

For the endpoints that are connected to Cisco ISE and have DUID information available, this information is displayed in Cisco AI Endpoint Analytics as well. These columns display the required information in the Endpoint Inventory window in Cisco AI Endpoint Analytics:

  • DUID: The DUID value for the endpoint.

  • Previous MAC Addresses: The random and changing MAC addresses with which the endpoint previously connected to the network.

Using the DUID value, Cisco AI Endpoint Analytics is now able to reliably identify an endpoint and track the various MAC addresses that the endpoint has previously used. This means that the Trust Score for an endpoint with random and changing MAC addresses still has high fidelity. The Trust Score of the endpoint from a previous MAC addresses is carried forward to the current MAC address that the endpoint is presenting and continues to be impacted by the probe data received for the same endpoint.

If a device has the Private Address setting enabled, the Is MAC Random column for this device displays the value Yes. This device is then recognized as a random and changing MAC address. However, whether or not a DUID value is available for this device depends on whether or not the endpoint was authenticated through Cisco ISE and if a GUID was generated for this endpoint in Cisco ISE.

Sensor scans to check for open ports and credential vulnerabilities

Install an active probes container to gain more information about the endpoints in your network. When you enable security sensor scans, the Trust Score that is assigned to an endpoint takes into account any anomalies in open ports and endpoint login credentials.

The sensor scan feature is supported by these switches:

  • Cisco Catalyst 9300 Series switches

  • Cisco Catalyst 9400 Series switches


Note


Cisco Catalyst 9800 Series Wireless Controllers do not support the sensor scan feature.


Cisco AI Endpoint Analytics uses the Application Hosting capability that is available on the switches to enable scans for open ports and weak credentials.

Enable and monitor sensor scans
Before you begin
  • Connection to Cisco ISE Release 3.1 or later releases, if you want to enforce endpoint policies based on the scan results.

  • Connection to Cisco Catalyst 9300 or 9400 Series devices.

  • Ensure that the switches are upgraded to Cisco IOS XE Release 17.7.1 or later releases.

Procedure

Step 1

Log in to your Catalyst Center.

Step 2

From the main menu, choose Policy > AI Endpoint Analytics.

Step 3

In the Overview window that displays, click Configurations.

Step 4

From the left pane, choose Trust Analytics.

Step 5

In the Security Sensor area, the prerequisites for using the sensor scans feature to identify open ports and weak endpoint credentials display. Click the corresponding links in this area to carry out these tasks:

  1. Verify the supported Catalyst Center and Cisco IOS-XE releases from the release notes for Cisco Catalyst 9000 Series devices. Download the security sensor container from software.cisco.com for the relevant Cisco Catalyst 9000 Series device. A .tar file downloads to your system.

  2. Install App Hosting in your Catalyst Center. See Application hosting for instructions.

  3. Upload the .tar file in your Catalyst Center App Hosting window. The link to the App Hosting window displays in the Security Sensor area.

  4. Install and enable the .tar file in each Cisco Catalyst 9000 Series device that you want to enable sensor scans on.

    In your Catalyst Center App Hosting window, check that the App Hosting Status is active for least one of the Cisco Catalyst 9000 Series devices on which you enabled the .tar file.

Step 6

After the active probes container is installed and enabled as explained in the previous step, in the Security Sensor area, you can configure Trust Score settings in Cisco AI Endpoint Analytics to scan for open ports and weak credentials on endpoints that are connected to Cisco ISE and the Cisco Catalyst devices on which the active probes application is enabled.

  • Click the Open Port Scan toggle button to enable Cisco AI Endpoint Analytics to proactively run port scans to detect and close possible vulnerabilities on defined endpoints on the network.

  • Click the Credential Vulnerability Scan toggle button to enable Cisco AI Endpoint Analytics to proactively detect when endpoints on your network are using weak credentials in order to prevent malicious activity.

Step 7

(Optional) If you choose to enable scanning for open ports, you can define the scan by clicking Scan Configuration in the Open Port Scan area.

  1. In the Scan Configuration window, in the Defined Scans tab, click the Define Scan button.

  2. A dialog box displays that allows you to define the scope of a port scan:

    • To scan each endpoint at the time of endpoint enrollment, choose the On enrollment, scan all endpoints radio button.

    • To define the scope of the open port scan by subnet, profiling attributes, and more, choose the Create a Custom Scan radio button.

    In both types of port scan, you define a list of unauthorized ports to specify the ports that must always be closed. This list allows Cisco AI Endpoint Analytics to recognize anomalous port activity on an endpoint and assign it a low trust score. For both port scan types, the minimum frequency of scan that you can configure is 12 hours.

  3. In the Scan Configuration window, in the Open Ports List tab, specify the type and range of ports, or individual ports, that must be scanned.

  4. In the Scan Configuration window, in the Unauthorized Ports tab, define by port number and port type, the ports that are unauthorized in your network. If Cisco AI Endpoint Analytics detects these ports as active, the endpoint is given a low trust score for the anomaly of an active unauthorized port.

Step 8

(Optional) If you choose to enable the detection of weak credentials, you can define the scan by clicking Scan Configuration in the Credential Vulnerability Scan area. SSH and TELNET protocols are supported by this feature.

  1. In the Credential Vulnerability Scan window, in the Scan tab, define a list of credentials that you want to identify as weak credentials. Define lists of usernames and passwords that are considered vulnerable according to your enterprise requirements.

  2. In the Credentials tab, a default list of more than 3500 weak credentials is available by default. You can use this default list to create a credential vulnerability scan. To add a new list of vulnerable credentials, click Create New List.

The minimum frequency of credential vulnerability scan that you can configure is 12 hours.

Step 9

For the scans that you enable in the Security Sensor, the relevant endpoints are scanned and if anomalies are detected in open ports or credential checks, the Trust Score for these endpoints is adjusted accordingly. In the Endpoint Inventory tab, where applicable, the Trust Score tab for an endpoint displays the list of unauthorized ports that are open on the endpoint, or weak usernames, or both.


View and manage Trust Scores for endpoints

Figure 2. Trust Score dashlet in Cisco AI Endpoint Analytics Overview tab
Figure 30: Trust Score Dashlet in Cisco AI Endpoint Analytics Overview Tab.

After Catalyst Center is upgraded and necessary Trust Score sources are enabled, the Cisco AI Endpoint Analytics Overview tab (main menu > Policy > AI Endpoint Analytics) displays the Trust Scores dashlet. This dashlet contains this information:

  • The total number of endpoints that have been assigned a Trust Score.

  • A donut chart and a list of the number of endpoints with low, medium, and high trust scores.

To view the details of endpoints in a trust score category, click its endpoint count in the Trust Scores dashlet. The Trust Score view of the Endpoint Inventory tab displays with the appropriate filters applied.

You can view endpoints with Trust Scores in two ways:

  • In the Trust Score tab, choose the Endpoints tab to see all the endpoints with Trust Scores assigned.

  • In the Endpoint Inventory tab, click View endpoints in Trust Score View from the caution message that is displayed, to see endpoints with Low and Medium scores.

You can do these actions on endpoints with Trust Scores:

  • Apply an ANC Policy

    ANC Policy application page.

    Click the Apply ANC Policy button to choose an ANC policy to be applied to an endpoint. The endpoint’s access to the network is modified accordingly. ANC policies are imported from Cisco ISE and displayed in the drop-down list in the pop-up window displayed.

  • Replace an ANC Policy

    ANC Policy replacement page.

    Click Change ANC Policy button to replace an existing ANC policy of an endpoint with another ANC policy. From the pop-up window displayed, choose the new policy to be applied from the Change ANC Policy drop-down list.

  • Remove an ANC Policy

    ANC Policy removal page.

    Click the Remove ANC Policy button to remove an applied ANC policy from an endpoint. In the pop-up window displayed, click Remove. This removes the remediation policy that was applied to the endpoint, and allows the endpoint to connect to the network normally.

  • Reset Trust Score

    Figure 3. Reset Trust Score for an endpoint without an ANC Policy
    Figure 31: Reset Trust Score page.
    Figure 4. Reset Trust Score for an endpoint with an ANC Policy
    Figure 32: Reset Trust Score page.

    Click Reset Trust Score button to remove an endpoint from the Trust Score inventory. In the pop-up window displayed, click Reset.

    If you choose this option for an endpoint after applying an ANC policy, you will not see this endpoint in the Trust Score inventory again. In this case, to modify the ANC policy for such an endpoint, you must remove the policy from Cisco ISE instead.

    If you reset the score for an endpoint without applying an ANC policy, you may see the endpoint in the Trust Score inventory again with the next automatic refresh of Trust Score data.

The buttons for each of the actions displays in two locations in the Endpoint Inventory tab. The actions can be done on a single endpoint, or on multiple endpoints.

  • Manage Trust Score for a single endpoint

    Figure 5. Trust Score options for an endpoint without an ANC Policy
    Figure 32: Trust Score options for endpoint without ANC policy.
    Figure 6. Trust Score options for an endpoint with an ANC Policy
    Figure 33: Trust Score Options with an ANC policy.

    From the list of endpoints with a Trust Score, click the MAC Address of the endpoint you want to manage. In the endpoints details pane that displays, click the Trust Score tab.

    Here, Expected Endpoint Type value is displays. The Applications Used field lists the applications that are used by the endpoint.

    This pane includes buttons to start the workflows of accepting and removing ANC policies, and to reset the Trust Score. Click the button for the intended task.

    Alternatively, you can check the check box for an individual endpoint on the Endpoint Inventory window, click Actions, and choose the required option from the drop-down list.

  • Manage Trust Score for multiple endpoints

    Trust score management for multiple endpoints.

    In the Endpoint Inventory tab, check the check boxes for all the endpoints you must do a specific action on. Click Actions and choose the required action from the drop-down list.

Control endpoint spoofing

Concurrent MAC address detection means that two endpoints with the same MAC address are detected accessing the network and generating traffic. It then becomes imperative to distinguish between the real endpoint and the spoofed endpoint and take the necessary remediation action for the spoofed endpoint.

The Control Endpoint Spoofing feature provides granular policy control by providing network information other than just the MAC address of an endpoint. Network information includes site information, network device IP address, network device port, first authorized timestamp, last authorized timestamp, and the duration for which the endpoint has been available in the network. You can choose to distinguish the entries by the MAC address as done traditionally, or by using both the MAC address and the network information provided. If you choose to distinguish by MAC address and connectivity (network information), a selection is made automatically to detect the spoofed endpoint. You can either go with the automatic selection or choose the one you feel is the spoofed endpoint, and apply the appropriate remediation action for that endpoint. The remediation actions available are the Adaptive Network Control (ANC) policies configured in Cisco ISE.

Because this is the granular way of applying the policy, you won’t see a listing for this policy in Operations > Adaptive Network Control > Endpoint Assignment.

For endpoints without concurrent MAC address detection and only NAT mode detection, an ANC policy is applied as described in View and manage Trust Scores for endpoints. In such a scenario, the endpoint gets listed under Endpoint Assignment in Cisco ISE.

For endpoints with both concurrent MAC addresses and NAT mode detection, the precedence is given to granular policy control. So, when you click Apply ANC Policy, you get the new Apply ANC Policy window with two options, to distinguish the entries.

You can also choose to change the ANC policy for an endpoint at any point of time. While changing the ANC policy, you have an option to choose more than one entry for which the ANC policy can be applied.


Note


If you chose Shutdown as the remediation action, and you want to change the action, the endpoint won't be brought back automatically after changing the action. You must manually turn on the interface in the switch to which the endpoint is connected.


An ANC policy can also be removed at any point of time.

Before you begin

The dynamic author must be configured in the network devices. We recommend that you provision the network devices with the AAA configuration from Catalyst Center.

Procedure


Step 1

From the Catalyst Center GUI, choose Policy > AI Endpoint Analytics > Endpoint Inventory > View endpoints in trust score view.

Step 2

Click the endpoint that you want to check and apply the ANC policy to.

Step 3

Choose Trust Score > Concurrent MAC Address.

Step 4

Click Apply ANC Policy.

Step 5

In the Apply ANC Policy window, choose Based on MAC address or Based on MAC address and connectivity.

Step 6

Choose the appropriate remediation action from the Apply ANC Policy drop-down list.

Step 7

Click Apply ANC Policy.

After completing this task, when you return to the Trust Score view for that endpoint, you can see the ANC policy name and the network device IP address to which the policy was applied, along with the time at which the ANC policy was applied.

To verify the configuration, in the Cisco ISE GUI, choose Operation > RADIUS > Live logs. You can filter the Identity column by endpoint MAC address.

An entry for the CoA action that was initiated from Cisco ISE for this endpoint is listed. If you check the details, the CoA Reason shows the ANC policy that was applied by you for the endpoint.


Profiling rules

Profiling rules in Cisco AI Endpoint Analytics enable you to group endpoints with a combination of common attributes. These attributes allow endpoint identification by Endpoint Type, OS Type, Hardware model, and Hardware Manufacturer. The profiling rules help you administer and manage many endpoints with ease.

Cisco AI Endpoints Analytics receives profiling data from network devices through DPI, media protocols, medical industry protocols, and more. Profiling data from Cisco ISE is communicated through pxGrid. These profiling attributes are then available in the device dictionary for authoring profile rules.

You can view the profiling rules in the Profiling Rules tab of Cisco AI Endpoints Analytics. In the table that displays under this tab, click a Rule Name entry to view the assigned profiles and attributes used.

The profiling rules that are used to profile the endpoints in Cisco AI Endpoint Analytics are:

  • System Rules

  • Custom Rules

  • Cisco AI Rules

Rule prioritization

The profiling rules in Cisco AI Endpoint Analytics have an order of priority. Profiling rule execution follows this rule priority to profile endpoints with high fidelity.

As user inputs are primary in Cisco AI Endpoint Analytics, the priority of the profiling rules include:

  • Administrator-created static profiles, for example, profiles added using the Register Endpoints option.

  • Administrator-created custom rules.

  • Cisco-provided system rules that are available by default.

  • Auto-generated rules through the machine learning-enabled Smart Grouping workflow.

To view the set rule priority, click Rule Prioritization in the Profiling Rules window.

A registered endpoint can be profiled by multiple Cisco AI Endpoint Analytics rules for different profiling labels. This table shows the design of profiling rules for two endpoints.

Endpoint 1

Endpoint 2

Hardware Model profiled by System Rule

OS Type profiled by Cisco AI Rule

Hardware Manufacturer profiled by Custom Rule

Hardware Model profiled by System Rule

Hardware Model profiled by Custom Rule

Hardware Model profiled by Cisco AI Rule

For Endpoint 2, rule priority results in the precedence of the custom rule over the others. The Hardware Model label for Endpoint 2 is profiled by the custom rule.

For Endpoint 1, different rules define different profile labels, and each label is profiled accordingly.

Filter profiling rules

Procedure


Step 1

In the Profiling Rules window, click Filter.

Step 2

Enter a name in the Rule Name field.

Step 3

Select values for endpoint attributes from the corresponding drop-down lists, to filter for a set of endpoints.

Step 4

Click Apply.


View updated profiling rules

Procedure


Step 1

Go to the Endpoint Inventory window.

Step 2

Click the check box adjacent to the MAC address of the endpoint to view the profiling details of the endpoint.

Step 3

Click the information icon next to profile labels, and click the rule name to view the assigned profile and attributes details.


System rules

Cisco AI Endpoint Analytics provides predefined rules called System rules for profiling endpoints. When Cisco AI Endpoint Analytics deploys, it provides day-zero visibility into endpoints without any need to configure specific rules.

Newly onboarded endpoints are profiled using system rules by default.

Network devices are managed in Catalyst Center in the Provision > Network Devices > Inventory window.

These network devices are profiled by the system rules and are not visible in the Cisco AI Endpoint Analytics Endpoint Inventory window. However, you can view the endpoints profiled by custom rules because the custom rules are created with the network device as Device Type.

Automatic system rule updates for endpoint profiling

The system rules that are used for endpoint profiling in Cisco AI Endpoint Analytics are regularly updated to enhance profiling accuracy. Schedule automatic updates to receive updates in endpoint profiling system rules from Cisco. Your Catalyst Center receives updates at the configured time, and the changes are applied in Cisco AI Endpoint Analytics. In the Profiling Rules window (Policy > AI Endpoint Analytics > Profiling Rules), review the details of the changes in endpoint profiles, and accept or decline the system rule update.

If an endpoint’s hardware model value changes due to an accepted system rule update, when you view the endpoint's details in the Endpoint Inventory tab, the Hardware Model field contains the name of the system rule update.

Before you begin

Configure and enable NBAR Cloud. See Configure CBAR cloud.

To check the status of NBAR Cloud, choose Policy > AI Endpoint Analytics > Overview, and click Configuration.

Procedure

Step 1

From the main menu, choose System > Settings > Cisco Accounts > Profile Rule Settings.

The Enabled toggle button in the Schedule Automatic Updates area is set to active by default.

Step 2

Click the buttons for the days of the week on which you want to schedule updates. You can select multiple days. Then, use the Time Slot text fields to select the time for the update. It takes 30 minutes for the updates to be received by Catalyst Center. The second time slot area is not editable and displays the time when the scheduled update is expected to complete.

Step 3

When your Catalyst Center receives a system rule update, a notification is displayed in the Profiling Rules window (Policy > AI Endpoint Analytics > Profiling Rules). These notification display when you click Expand in the dialog box:

You are updated to the latest version Name of Latest Version and a recent Cisco profiling rule has changed the profiles of some endpoints.

Click Review Update.

Step 4

The Endpoint Profile Update Review dialog box displays. The dialog box contains information on the current stable update applied, the latest update received, and more. It also contains these sections that you can click to view the related endpoint profile updates:

  1. Major Updates: Lists the endpoints whose profiles have had major changes, such as a Windows endpoint that is now recorded as a Linux endpoint.

  2. Minor Updates: Lists the endpoints whose profiles have had minor changes, such as an updated version of Windows OS.

  3. Newly Profiled: Lists the endpoints that were unprofiled previously and have now been assigned profile information.

Step 5

After you review the endpoint profile changes, to accept the profile update, click Mark As Approved Version in the Endpoint Profile Update Review dialog box. If you do not agree with the endpoint profile changes, click Rollback.

When you select rollback, you must select if you want to roll back to the last running version, or the last approved version, by clicking the corresponding option.

You can also perform the accept and rollback actions from the AI Endpoint Analytics > Overview > Configuration window.

Step 6

Click X to close the dialog box.


Custom rules

In addition to the system rules, you can also create custom rules for profiling endpoints using a combination of endpoint attributes. Custom rules precede all the other endpoint profiling rules in Cisco AI Endpoint Analytics.

Logic and conditions for profiling rules

You can create custom profiling rules in the Endpoint Inventory window. To create a custom profiling rule, you must create a logical condition based on endpoint attributes and values. These attributes are collected from network probe data and are different from the classification attributes available in the Attribute Glossary window.

A value is a user input that uniquely identifies the group of endpoints. The attributes and values create a regular expression with the help of the operators in this table.

Operators Description

Contains

Attribute has the selected value.

Equals

Attribute is strictly mapped to the selected value.

Matches

Attribute should match the regular expression pattern of the selected value.

Starts With

Attribute should start with the selected value.


Note


Contains, Equals, and Starts With are case-sensitive operators. For case-insensitive values, use the Matches operator.


These conditions can be further combined with the help of logic (AND and OR) to create a nested rule.

Create and Edit a Logical Condition

Follow the below instruction to create a logical condition.

Procedure

Step 1

In the Choose Attribute Conditions window, check the check box adjacent to the Attribute that you want to update.

Step 2

Choose a option from the Operator drop-down lists.

Step 3

Enter the value in the Value field.

Step 4

Click Next.

Step 5

In the Add Logic to Conditions window that is displayed, drag and drop the AND logic or the OR logic between the conditions in order to create a logical sequence of conditions for a custom rule.

Note


You can also add or edit an attribute condition in the Add Logical Conditions window using the vertical ellipsis next to a condition.

Step 6

Click Next.


Create a custom rule

Procedure

Step 1

In the Endpoint Inventory window, check the check box adjacent to the MAC address of the endpoints that you want to profile.

Step 2

Click Actions and choose Profile with Custom Rules.

Step 3

In the Name Rule and Type window that displays, in the Rule Name field, enter a name for the rule, and from the Profile Label drop-down list, choose a label.

Depending on what you choose from the Profile Label drop-down list, a corresponding field, whose name is dynamically updated, is displayed. For example, if you choose Endpoint Type, the Endpoint Type field appears.

Step 4

Enter a value in the new field that displays. As you start entering information, matching options display. If an option matches your requirements, select the same. Otherwise, enter the complete type name.

Step 5

Click Next.

Step 6

In the Choose Attribute Conditions window that displays, create a logical condition.

For more information, see Logical Conditions.

Step 7

In the Review Rule window, review the list of endpoints that are going to be profiled with this custom rule.

Step 8

Click Next.

Step 9

Click Profile.


Edit a custom rule

Procedure

Step 1

In the Profiling Rules window, check the check box adjacent to the admin rule you want to edit.

Step 2

Click Actions and select Edit.

Step 3

In the Edit window that displays, in the Rule Name field, enter a name for the rule, and select or enter the profile details based on the Profile Label selected during the rule creation.

Step 4

In the Logic and Conditions section, click on the vertical ellipsis and select Edit to update the logic and conditions for profiling rules. For more information, see Logical Conditions.

Step 5

Click Next.

Step 6

Click Apply.

After the existing rule updates with new profiling details, the endpoints profiled with this rule update with new profiling details.

Delete a custom rule

Procedure

Step 1

In the Profiling Rules window, check the check box next to the rule that you want to delete.

Step 2

Click Actions and choose Delete.

This message is displays:

Do you really want to delete the selected Rule(s)?

Step 3

Click Yes to permanently delete the rule from Cisco AI Endpoint Analytics.

After the custom rule is deleted, the endpoints profiled with this rule are updated with system rules.

Export and import custom profiling rules across deployments using APIs

Catalyst Center contains Cisco AI Endpoint Analytics APIs through which you can import, export, edit, and delete custom profiling rules.

To enable the Cisco AI Endpoint Analytics API bundle:

  1. From the main menu, choose Platform > Manage > Bundles.

  2. Find the bundle named AI Endpoint Analytics and click Enable.

  3. The value in the Status column changes from Disabled to Active, and the list of APIs display. You can also view the expected request and response payloads for each API.

  4. After you enable the API bundle, the Cisco AI Endpoint Analytics APIs are added to the Catalyst Center Developer Toolkit. You can then access the APIs from the Developer Toolkit window (Platform > Developer Toolkit).

From both the Bundles and Developer Toolkit windows, you can:

  • Generate code preview to view the API code that you can use in a different tool to run the API.

  • Click Try It to run the API from the Catalyst Center GUI. You will receive a JSON response that you can copy and paste into a text editor of your choice to continue working with.

Cisco Al rules for smart grouping

The Cisco AI Endpoint Analytics' AI algorithm analyzes data about endpoint profiling labels and groups across deployments and provides you with smart profiling rules suggestions.

The AI Proposal dashlet in the Cisco AI Endpoint Analytics Overview tab displays these rule suggestions based on the learnings from endpoint clusters:

You can also initiate the workflows to review and apply proposals for changes to endpoint profiling rules from the Profiling Rules tab of Cisco AI Endpoint Analytics. The Profiling Rules displays a dialog box with information alerts. In the information alert dialog box, click Expand to view the available proposals for changes to endpoint profiling rules. Click Review next to the information alert that you want to examine to initiate the corresponding workflow.

Figure 7. Information alerts in the Profiling Rules tab
On the Cisco AI Endpoint Analytics window, the Profiling Rules tab is selected and a banner with information alerts about profiling rules is displayed.

New profiling suggestions for similar endpoints in your network

Procedure


Step 1

In the AI Proposals dashlet, click the Review button next to New rule(s) for profiling endpoints that many be similar.

The Smart Group Profile workflow is launched.

Step 2

The Choose an Endpoint Group window that displays contains a list of new profiling rules suggestions in the left pane. Click an entry in the list to view the details of the profiling rule in the right pane.

Figure 8. Choose an Endpoint Group window of the Smart Group Profile workflow
On the Choose an Endpoint Group window, the suggested endpoint groups are displayed with a summary of the common attributes.

The right pane contains the Summary, Profile Rule, and Endpoints tabs that provide a quick view of the details of the profiling rule that is suggested.

Step 3

Click Next to create the suggested profiling rule.

Step 4

In the Name Profiling Rules and Labels window that is displayed, in the Rule Name field, enter a name for the rule.

Figure 9. Name Profiling Rules and Labels window of the Smart Group Profile workflow
On the Name Profiling Rules and Labels window, the required fields, such as the Rule Name field, are listed.

Step 5

In one or more of these fields, enter the required values:

  • Endpoint Type

  • Hardware Manufacturer

  • Hardware Model

  • OS Type

If the AI algorithm identifies a profiling label for the endpoints, the label displays as a suggestion in the corresponding field. You can choose to proceed with the suggested label or select a different label.

Step 6

Click Next to continue.

Step 7

In the Summary window, review the details of profiling rule. To make any changes, click Edit.

Figure 10. Summary window of the Smart Group Profile workflow
On the Summary window, a summary of the endpoint group and endpoint profile label details is listed.

Step 8

To create the profiling rule, click Done.


Import profiling rules

You can migrate your custom profiling rules and Cisco AI rules by importing the .json files.

Procedure


Step 1

In the Profiling Rule window, click Actions

Step 2

Choose Import Profiling Rules.

Step 3

Click Choose a file and browse to the .json file in your system.

Step 4

Click OK.


Export profiling rules

You can export and back up custom rules and Cisco AI profiling rules from Cisco AI Endpoint Analytics. The Export Profiling Rules option exports all the available custom rules and Cisco AI profiling rules. You cannot selectively export rules.

Procedure


Step 1

In the Profiling Rules window, click Actions.

Step 2

Choose Export Profiling Rules.

Step 3

Click Yes to export all the custom and ML profiling rules. Click No to exit.

Note


You can import the same file again into Cisco AI Endpoint Analytics.


Hierarchy

Cisco AI Endpoint Analytics hierarchy helps you create logical groupings of endpoints, based on the endpoint types. Creating categories and subcategories for the endpoints focuses on endpoint visibility and simplifies the authorization process.

You can create categories from the All Endpoints default parent category. The category details such as total number of endpoints, endpoint types, and subcategories are listed within individual boxes in the Hierarchy window.

You can create, edit, and delete the categories to reorder the hierarchy.

Create category and subcategory

Procedure


Step 1

In the Hierarchy window, click the horizontal ellipsis of the parent category.

Step 2

Click Create Category.

Step 3

Enter a category name.

Step 4

Click Enter.


What to do next

After you create a category, you can drag and drop endpoint types from the Endpoint Type window, or edit the category to add endpoints to it.

Edit a category or subcategory

Procedure


Step 1

In the Hierarchy window, click on the horizontal ellipsis of the category.

Step 2

Click Edit.

Step 3

In the Edit window that displays, enter the Category Name.

Step 4

Enter the Parent Category from the drop-down menu, if you want to reassign the category.

Step 5

Click the Endpoint Type tab.

Step 6

Click Actions and select Add Endpoint Type.

Step 7

Choose the endpoint type from the Search Dropdown list.

Step 8

Click Save.


What to do next

In the Endpoint Type window, you can filter the endpoint types as All, Available, and Assigned.

Delete endpoint types from category

Procedure


Step 1

In the Hierarchy window, click the horizontal ellipsis of the category that you want to delete.

Step 2

Click Edit.

Step 3

In the Edit window, click the Endpoint Type tab.

Step 4

Check the check box adjacent to the endpoint type that you want to delete.

Step 5

Click Actions and choose Remove From Category.

This message displays:

Are you sure you want to delete this category?

Step 6

Click Yes to delete the endpoint from the category. Click No to exit.


Reassign endpoint types from category

Procedure


Step 1

In the Hierarchy window, click the horizontal ellipsis of the category.

Step 2

Click Edit.

Step 3

In the Edit window, click the Endpoint Type tab.

Step 4

Check the check box adjacent to the endpoint type that you want to reassign.

Step 5

Click Actions and choose Re-assign to existing category or Re-assign to a new category.

Option Steps

Re-assign to existing category

  1. In the Reassign window, choose an existing category from the Category drop-down list.

  2. Click Save.

Re-assign to a new category

  1. In the Reassign window, choose New Category from the Category drop-down list.

  2. Choose a parent category from the Parent Category drop-down list.

  3. Enter the category name in the New Category field.

  4. Click Save.


Delete a category

Before you begin

Before you delete a parent category, check its subcategories. You can reassign the subcategories to another existing category or to a new category. Otherwise, all the subcategories are deleted along with the parent category. You can also reassign the subcategories while you are deleting a category.

Procedure


Step 1

In the Hierarchy window, click the horizontal ellipsis of the category.

Step 2

Click Delete.

If you are deleting a category that has subcategories assigned to it, the Reassign Relationships dialog box displays. Choose one of these options:

Option Condition Steps

Reassign to an existing category

Reassign the subcategories to an existing category.

  1. Select a category from the Category drop-down list.

  2. Click Reassign.

The parent category is deleted and its subcategories will be reassigned to the selected category.

Reassign to a new category

Reassign the subcategories to an existing category.

  1. Select a category from the Parent Category drop-down list.

  2. Enter the category name in the New Category field.

  3. Click Reassign.

The parent category is deleted and its subcategories are reassigned to the new category.

Remove from category

Delete the subcategories along with the parent category.

Click Reassign.

The parent category and its subcategories are deleted.