Manage Energy on Your Network

Overview

Catalyst Center offers a range of energy management capabilities that are designed to help organizations optimize their energy usage, reduce costs, and improve sustainability. Here are some key aspects of Catalyst Center energy management solutions:

  • Cost optimization: You can regularly review energy consumption data and adjust strategies for cost savings.
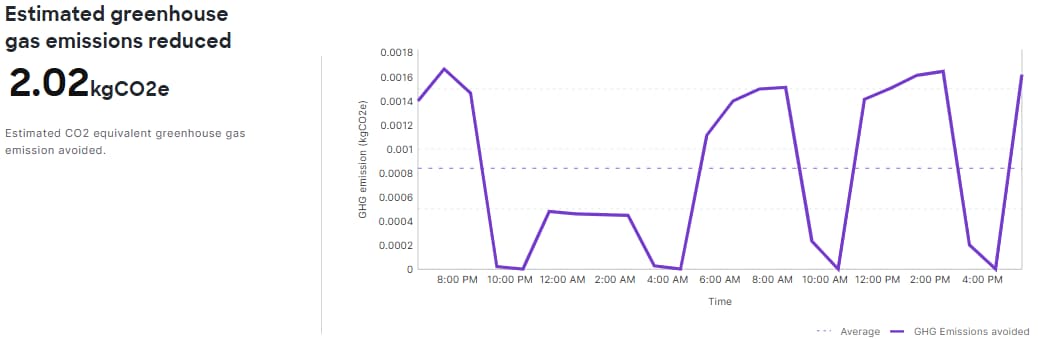
  • Sustainability: Catalyst Center's energy management capabilities support broader sustainability initiatives by helping reduce carbon footprints through efficient energy use.

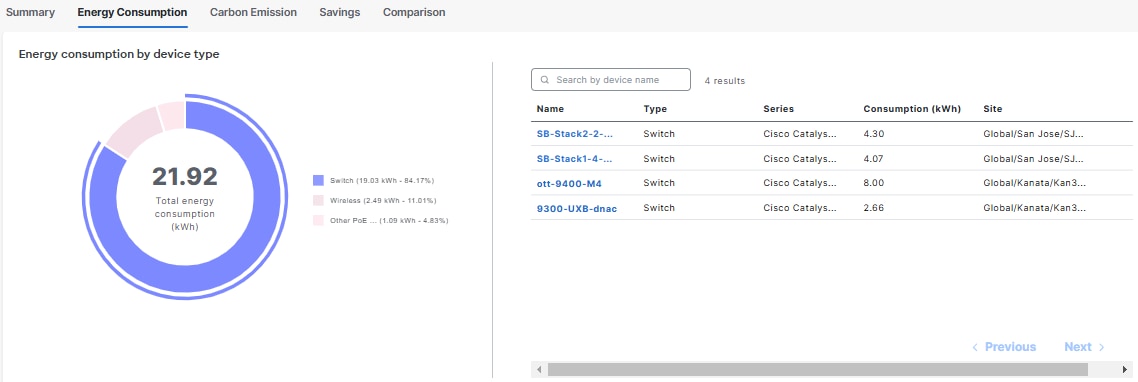
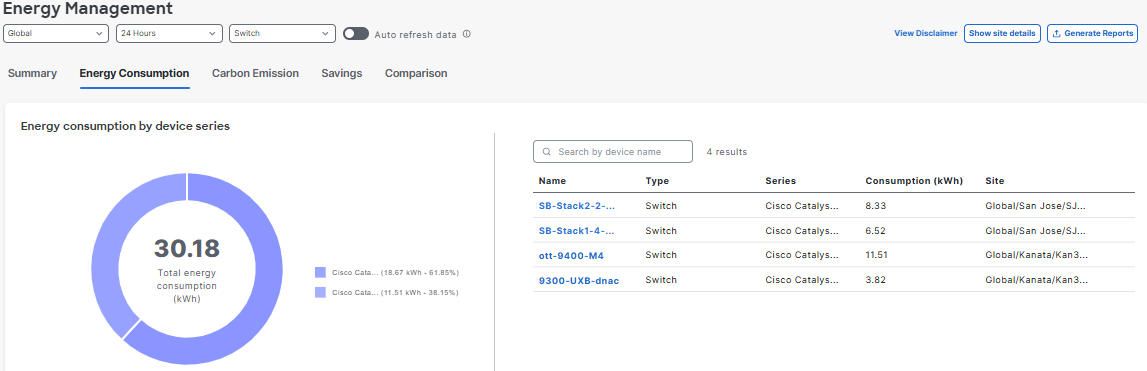
  • Assess high-consumption devices: Catalyst Center provides energy audit to identify high-consumption devices and patterns. This assessment helps you to replace an outdated network device with an energy-efficient model.

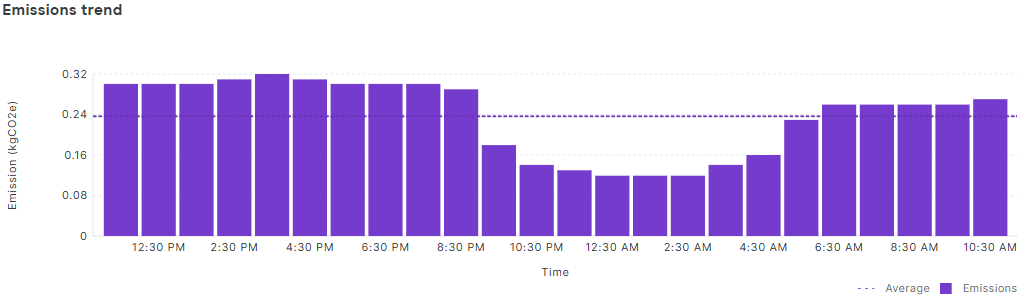
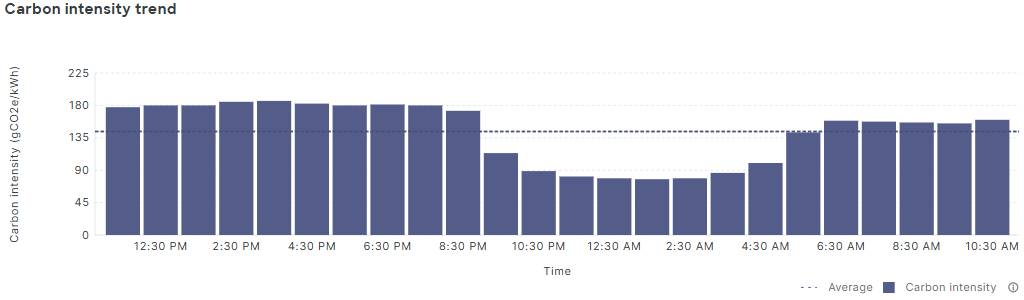
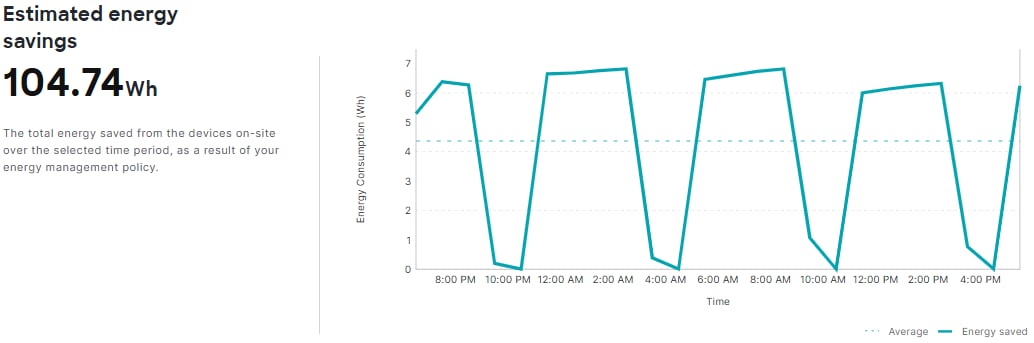
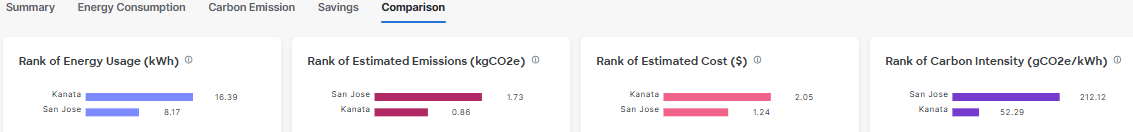
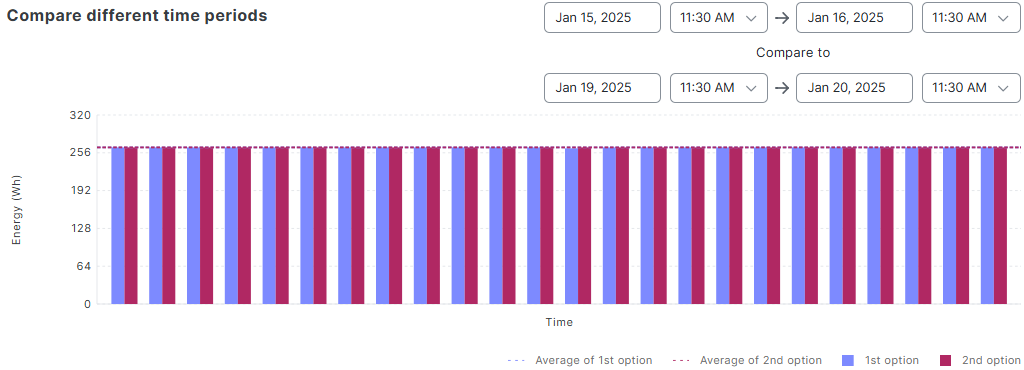
  • Reporting and analytics: Catalyst Center provides detailed reporting and analytics on energy usage, helping organizations identify trends, track savings, and support sustainability initiatives.
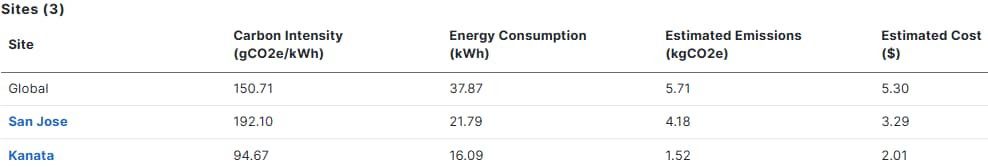
Manage energy on network devices

The Energy Management feature allows you to monitor and analyze the cost, energy consumption, and carbon emissions of your network.

Use this section to get acquainted with various options on the Energy Management window.

Procedure


Step 1

From the main menu, choose Energy Management.

By default, the energy consumption of the network devices is displayed for the last 24 hours.

Important


Data and other information generated in this dashboard are subject to the disclaimer indicated in Disclaimer slide-in pane. Click the View Disclaimer link at the top-right of the window to view this pane.

This image displays Engergy Management window view.

Step 2

To view the energy consumption of a particular site, choose a site from the Global drop-down list.

Step 3

You can view energy consumption for the last 24 hours or 7 days. To change the time range, choose 7 Days from the 24 Hours drop-down list and click Apply.

You can also change the date and time in the Start Time and End Time area to view the energy consumption for a specific day or week.

Step 4

To view the energy consumption of the switches, routers, access points, or other Power over Ethernet (PoE) devices, choose the device type from the All Devices drop-down list.

Step 5

To refresh the data on Energy Management window, enable the Auto refresh data toggle button.

The data is refreshed every 5 minutes. Click the pause button to pause data refresh.

Step 6

To view detailed information for all the sites, click Show site details button.

You can view carbon intensity, energy consumption, estimated emissions, and estimated cost of all sites.

This image shows the site details view in Energy Management window.

This table allows you to compare the values between different sites. Click the site name hyperlink to view details such as energy consumption, carbon intensity, estimated emissions, and consumption costs for the buildings and floors of a site.

You can click the map view () icon at the top-right of the window to view the sites on a map. Then, hover over a site to view details such as energy consumption, carbon intensity, emissions, and estimated consumption cost.


Use the Energy Management dashboard

This section describes the components of the Energy Management dashboard:

This image shows the Energy Management dashboard view.
  • Total energy consumption: This dashlet displays the amount of energy consumed by the devices for a chosen site and time range.

  • Energy consumption by device type: This dashlet displays the energy consumed by each device type for a chosen site and time range.

  • Estimated cost and emissions:

    • Estimated cost: Displays the estimated cost of the energy consumed based on the Electricity Maps (if available) or the International Energy Agency (IEA) data.

    • Estimated emissions: Displays carbon emissions of the energy consumed in kg.

  • Savings: This dashlet displays the energy savings, cost savings, and reduced greenhouse gas emissions.


    Note


    You can view only savings that are achieved through Cisco Access Points operating in power save mode.

    For information on how to configure Access Points in power save mode on Catalyst Center, see Create an AP power profile.


  • Energy consumption trend: Displays the trend of energy consumed over a range of time. Click the toggle button to view energy consumption trend for all devices or view the trend based on device type.

    This image displays Energy Consumption Trend view.
  • Emissions trend: Displays the trend of carbon emissions for the chosen devices over a range of time.

    This image displays Emisions Trend view.
  • Carbon intensity trend: Displays the trend of carbon intensity over a range of time. Carbon intensity refers to the amount of carbon dioxide (CO2) emissions produced per unit of energy output.

    This image displays Carbon Intensity Trend view.

Click the Energy consumption, Carbon emissions, Savings and Comparison tabs to view detailed information on each category.

Generate a report of energy management for network devices

Catalyst Center allows you to retrieve a consolidated energy management report that shows energy consumption, cost, carbon emissions, and carbon intensity data of your network devices, providing complete visibility.

For more information, see "Run a Network Devices Report" in the Cisco Catalyst Center Platform User Guide.

View energy consumption of network devices

Catalyst Center allows you to assess the energy consumption of network devices. This assessment is crucial for you to manage operational costs and reduce environmental impact.

Factors that affect energy consumption in network devices:

  • Device Type: Switches, routers, Access Points (APs), and other Power over Ethernet (PoE) devices, each with different energy requirements.

  • Usage Patterns: Devices that run at full capacity or under significant load typically consume more energy.

  • Environmental Conditions: Operating temperature and humidity can affect energy usage.

From the main menu, choose Energy Management > Energy consumption.

The Energy Consumption dashboard contains these sections:

  • Energy consumption by device type displays the total energy consumption for all devices and individual device types.

    This image shows the Energy Consumption by device type view.

    To view energy consumption of device series, from the All Devices drop-down list, choose the device type.

    This image shows the Energy Consumption by device series view.

    The table lists all the devices, providing information such as device type, device series, energy consumed by the device, and its site.

  • Energy consumption trend displays a graphical representation of energy that is consumed over a time range.

  • Device count displays the total number of devices and the number of devices based on device type over a time range. This graph displays only the number of devices that report energy data. Devices that do not report energy data are not included in the device count.

    This image shows the Device Count over a time range.

Carbon emissions of network devices

Carbon emissions refer to the release of carbon, particularly in the form of carbon dioxide (CO2), into the atmosphere. Carbon emissions significantly contribute to climate change by increasing the greenhouse effect, leading to global warming and causes various environmental impacts.

The Energy Management feature captures the estimated carbon emissions of your network devices and provides insights into these emissions over a specified time range.

This image displays the carbon emission dashboard view.

To view the carbon emissions dashboard, click the menu icon in the top-left corner, and choose Energy Management > Carbon emissions. The dashboard displays these sections:

  • Estimated total emissions: This dashlet displays the estimated greenhouse gas emissions, specifically carbon dioxide (CO2) equivalents, based on energy consumption and the carbon intensity of the local energy grid.

  • Energy mix: This dashlet displays energy generated from different sources such as gas power plants, nuclear power plants, hydroelectric dams, wind discharge, battery discharge, and so on.

    Energy consumption, particularly from electricity generation, often leads to greenhouse gas emissions. This is because electricity generation is a major source of CO2, especially when fossil fuels such as coal or natural gas are used.

    Because nuclear power plants, hydroelectric dams, and wind turbines are considered clean sources of electricity (zero to negligible carbon emissions), they are displayed in shades of green, while electricity produced from a gas power plant is shown in shades of red due to its non-negligible carbon footprint. Others shown in gray refer to the sources of electricity that are unknown.

  • Emissions trend: This area displays the graphical representation of the carbon emissions and carbon intensity over a time range.

    This image displays the Emission Trend view.

View energy savings

The Energy Management Savings dashboard shows the estimated savings of cost and energy, and the estimated reduction of gas emissions when the power save mode is applied to Cisco Access Points (APs).

From the main menu, choose Energy Management > Savings to monitor and analyze savings.


Note


Only savings that are achieved through Cisco APs operating in power save mode are captured.

For information on how to configure APs in power save mode on Catalyst Center, see Create an AP power profile.


The Savings dashboard contains these sections:

  • Estimated cost savings: This area displays the estimated cost savings achieved due to the reduced energy consumption. It also displays a graphical representation of money spent over a range of time.

    This image displays estimated cost view for Savings dashlet.
  • Estimated energy savings: This area displays the estimated energy savings that are achieved in watt hours. APs can be configured to operate in normal mode or in power-save mode. The savings value is the energy that is consumed in power-save mode that is subtracted from the energy that is consumed in normal mode. This savings is calculated based on live, switch-reported energy consumption.

    This is a more granular metric than the Assurance > PoE dashboard > Estimated AP Power Savings value, which is based on power samples. In the PoE dashboard, Assurance samples the data once per hour and computes the energy consumption based on the power sample, which is a higher-level approximation compared to the energy savings shown in the Energy Management window.

    This image displays the Estimated energy savings dashlet.
  • Estimated greenhouse gas emissions reduced: Energy consumption often leads to greenhouse gas (GHG) emissions. This area displays the amount of carbon dioxide (CO2) and other greenhouse gases reduced due to decreased energy consumption.

    This image displays Estimated greenhouse gas emissions reduced dashlet.

    Reducing GHG emissions contributes to mitigating climate change and improving air quality.

Compare energy across sites

To analyze energy across your network, Catalyst Center ranks sites based on energy consumption, estimated emissions, estimated cost, and carbon emissions intensity.

From the main menu, choose Energy Management > Comparison.

This image displays the Comparison of energy consumption, cost and carbon intensity.

The Comparison dashboard displays sites ranked by energy consumption, estimated emissions, estimated cost, and carbon emissions intensity. To view the site details for a specific rank, click the corresponding link.

Click Show site details to view the site names and the ranks for each site.

Click each site name to view more granular details of the site.

The Compare different time periods area shows a graph of energy consumption in watt-hours over selected time ranges.

This image displays a graphical representation of energy consumed over a period.