Create or import network models
The network models are typically generated using the Cisco Crosswork Planning Collector application and are saved as plan files. You can create new network models in the Cisco Crosswork Planning Design UI or import existing one from your local system. To use the plan files in the Cisco Crosswork Planning Design application, they must be available in the user space.
Use these procedures to import plan files into the user space or to manually create new network models.
Import plan files from the local machine
This section explains how to import the plan files into the user space from local machine.
Before you begin
Procedure
|
Step 1 |
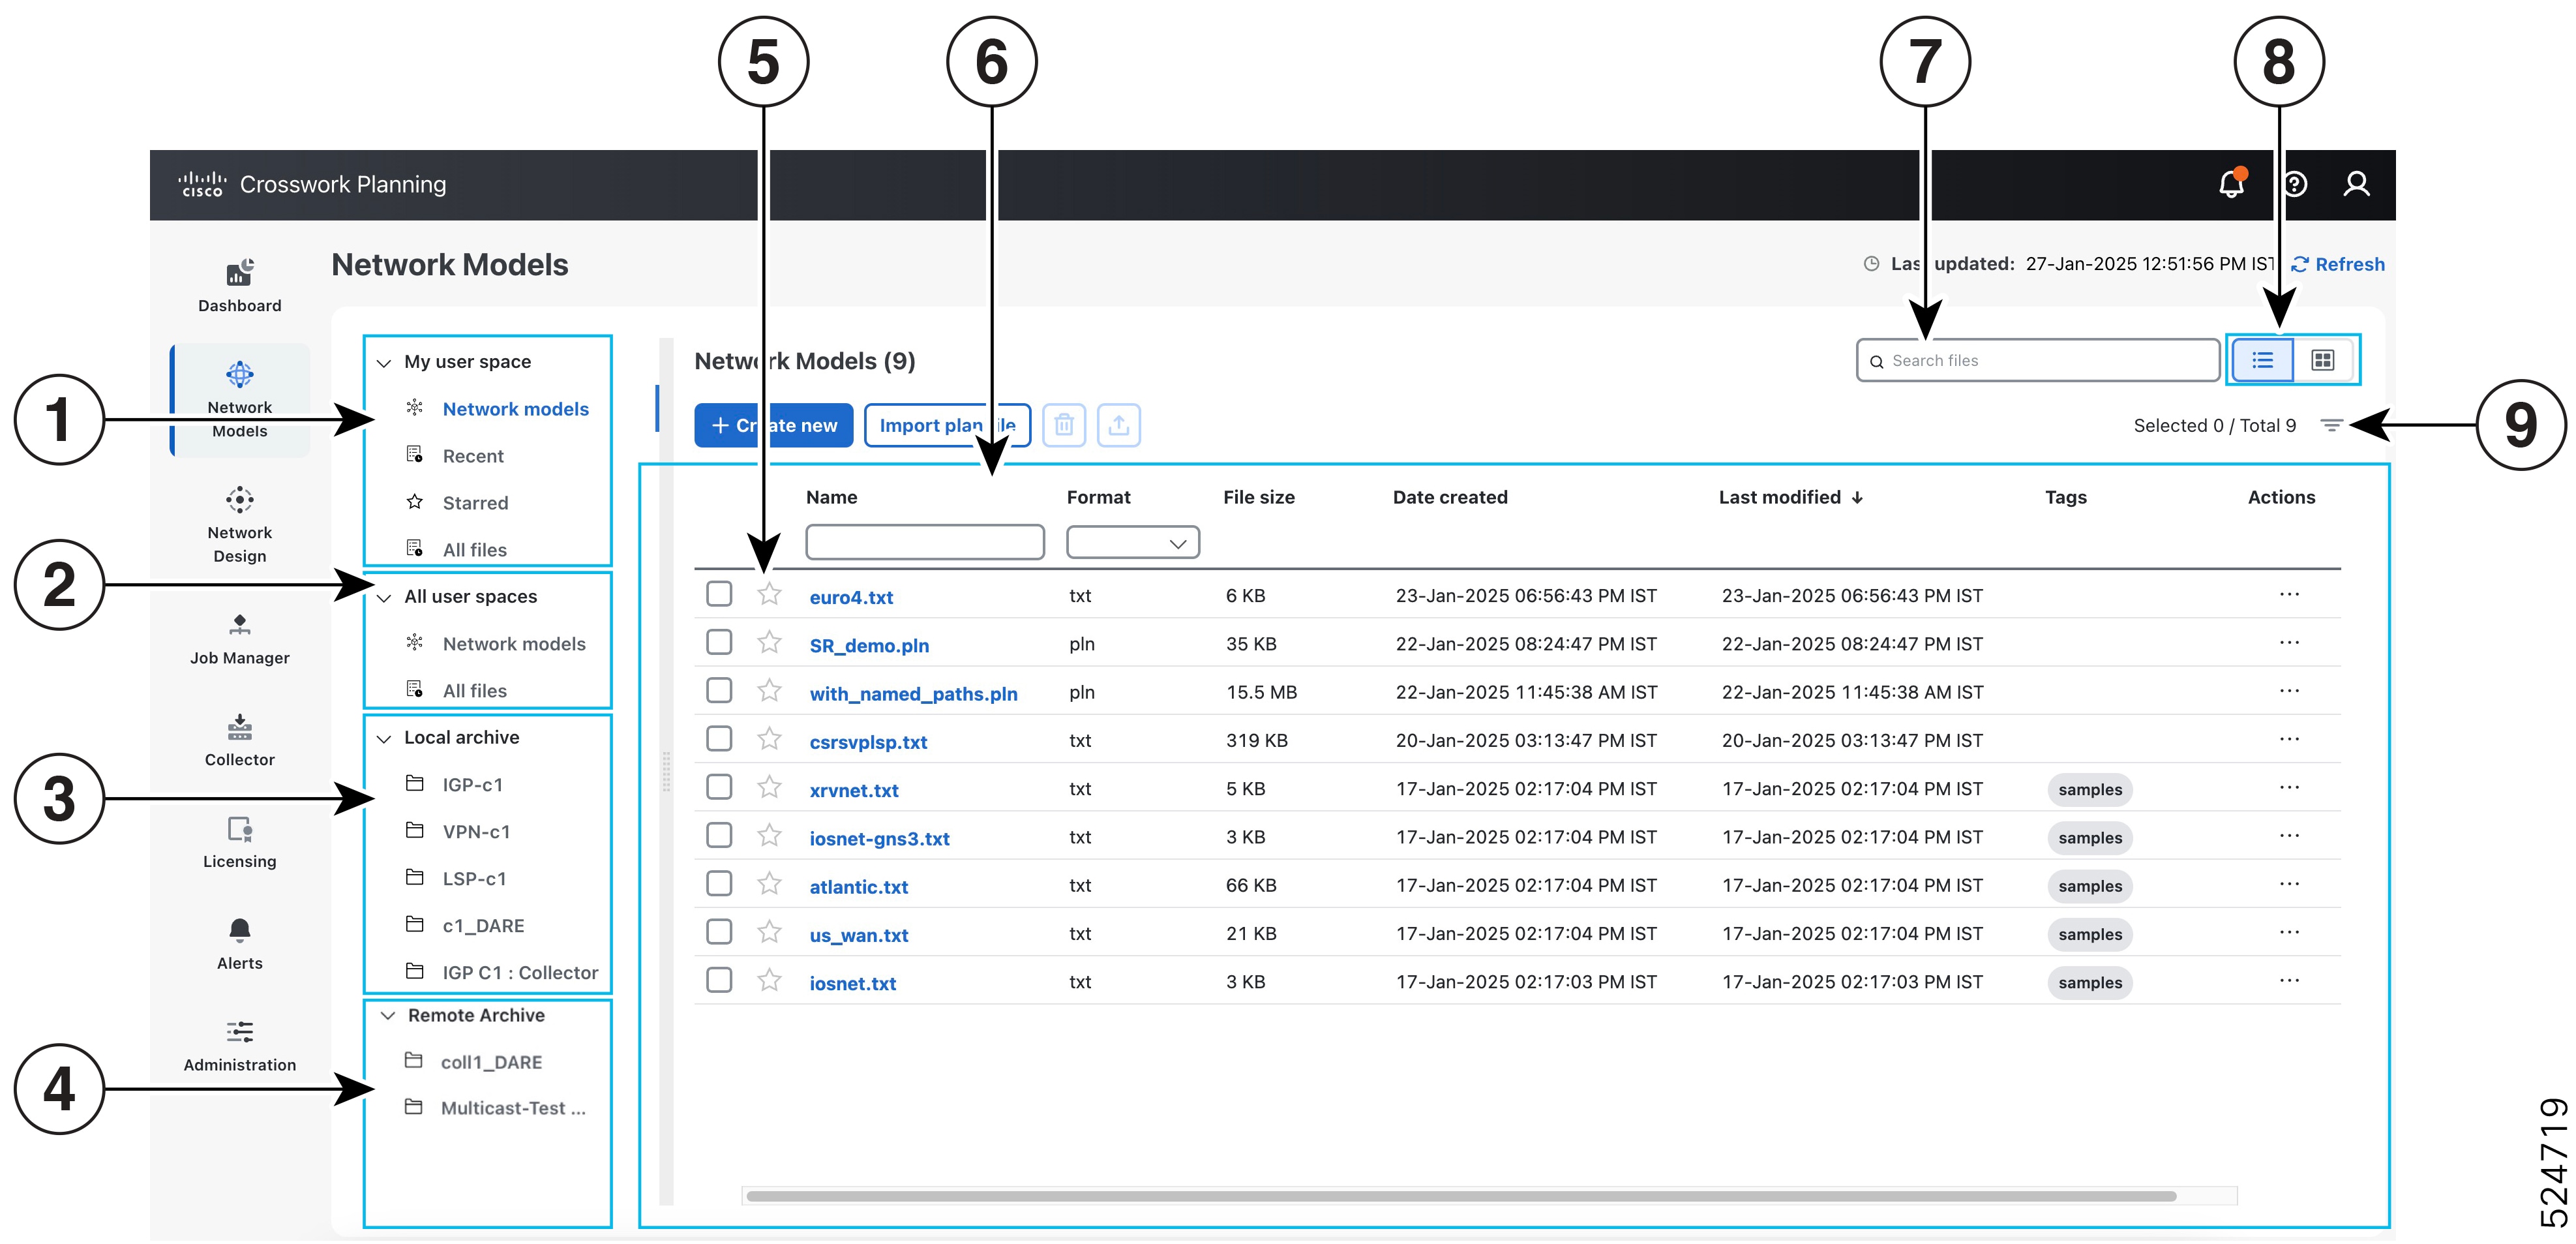
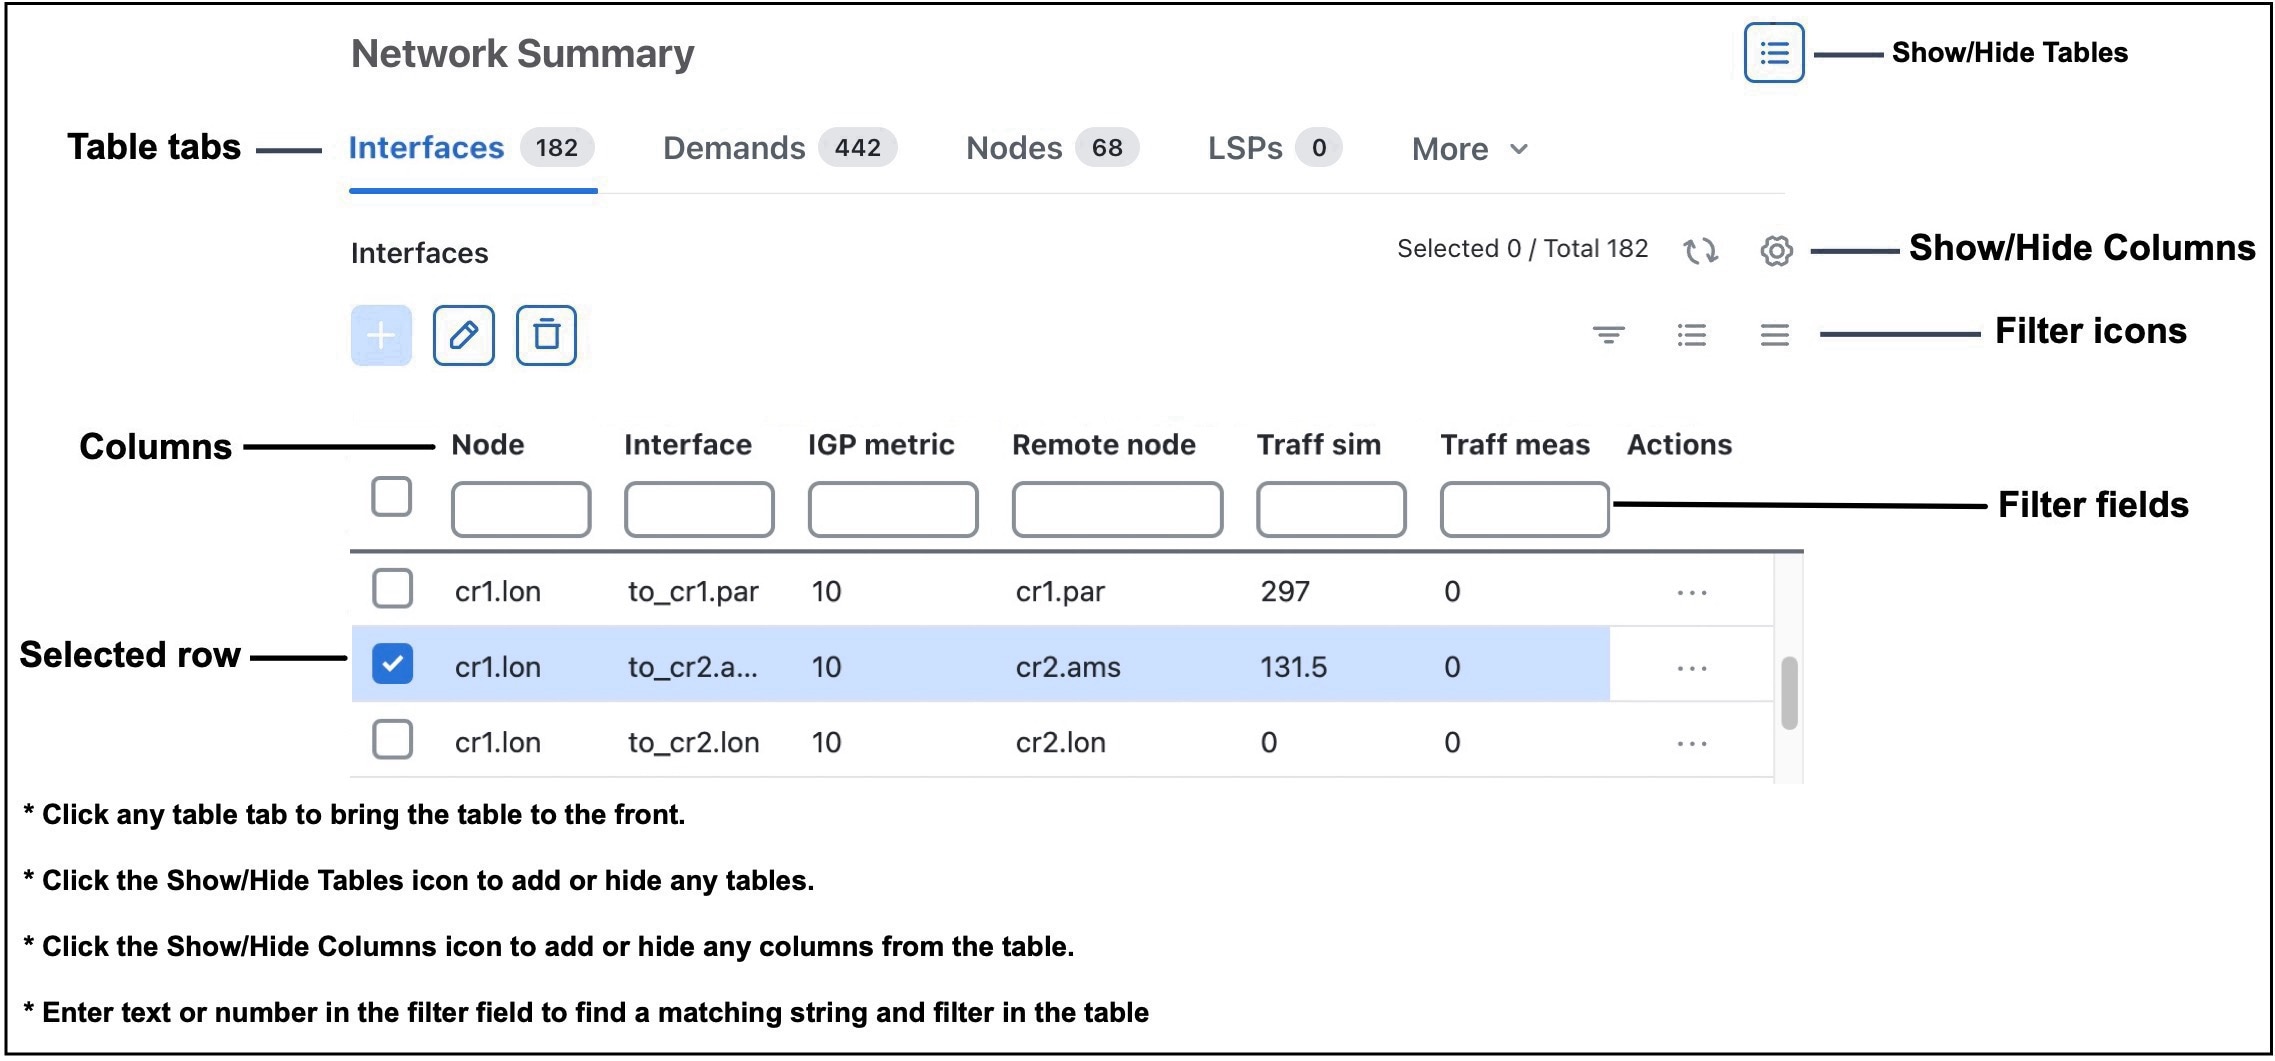
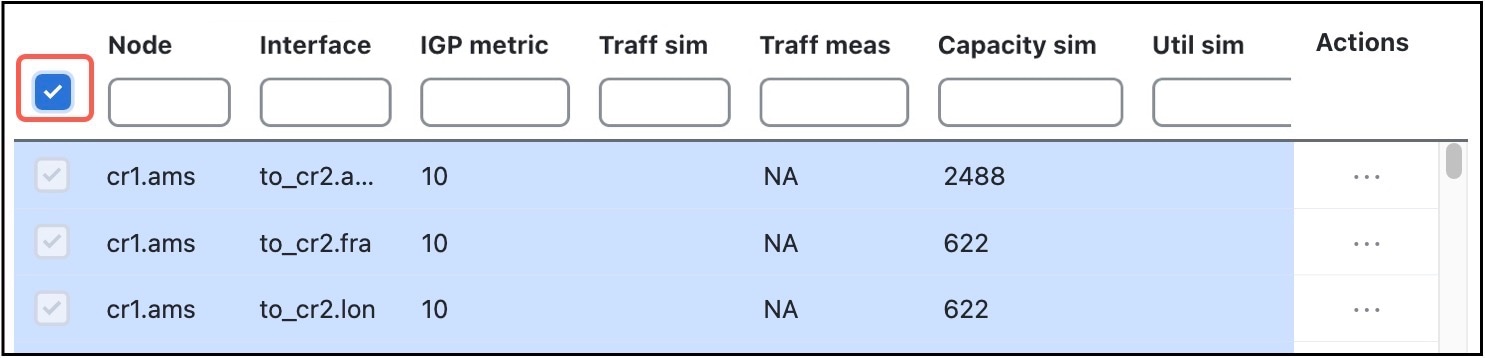
From the main menu, choose Network Models. By default, My user space > Network models page opens. |
||
|
Step 2 |
Click the Import plan file button. The Import Plan File window appears. |
||
|
Step 3 |
Click Browse and choose the plan file that you want to import. |
||
|
Step 4 |
(Optional) Select the required tags from the list (if available) or create new tags. Follow these steps to create new tags.
|
||
|
Step 5 |
Click Import. The plan file is imported into the My user space > Network models page. |
Import plan files from archive
This section explains how to import plan files into the user space from Local or Remote archive.
Before you begin
The archived network model from the Cisco Crosswork Planning Collector application is saved in a plan file format (.pln). The location of the archive differs based on whether the Cisco Crosswork Planning Design and Collector applications are installed on the same machine or different machines.
-
If the Cisco Crosswork Planning Design and Collector applications are installed on the same machine, the archived network models appear under Network Models > Local archive.
-
If the two applications are installed on different machines, connect to the machine where the Cisco Crosswork Planning Collector application is installed. After connecting, the archived network models appear under Network Models > Remote archive of the Cisco Crosswork Planning Design application. For details, see the "Scenario 2: When the Cisco Crosswork Planning Design and Collector Applications are Installed on Different Machines" section in the Cisco Crosswork Planning 7.1 Collection Setup and Administration.
Procedure
|
Step 1 |
From the main menu, choose Network Models. By default, My user space > Network models page opens. |
||
|
Step 2 |
On the left pane, under Local archive or Remote archive, list of archived collections are displayed. Select the required collection name from the list. The right panel displays the list of plan files created under this collection at various scheduled times. Use the Last updated column to know the time at which the plan file was created. |
||
|
Step 3 |
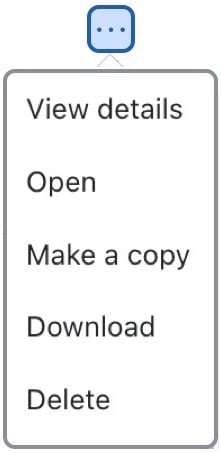
Select the required plan file from the right panel and click The Export Plan to User Space window appears. |
||
|
Step 4 |
(Optional) In the Save as field, enter a new name for the plan file. |
||
|
Step 5 |
(Optional) Select the required tags from the list (if available) or create new tags. Follow these steps to create new tags.
|
||
|
Step 6 |
Click Save. The plan file is imported into the My user space > Network models page. |
Create new network models manually
This section explains how to create new network models in the user space manually.
Procedure
|
Step 1 |
From the main menu, choose Network Models. By default, My user space > Network models page opens. |
||
|
Step 2 |
Click the Create new button. The New Network Model window opens. |
||
|
Step 3 |
In the Name field, enter the name of the plan file.
|
||
|
Step 4 |
(Optional) Select the required tags from the list (if available) or create new tags. Follow these steps to create new tags.
|
||
|
Step 5 |
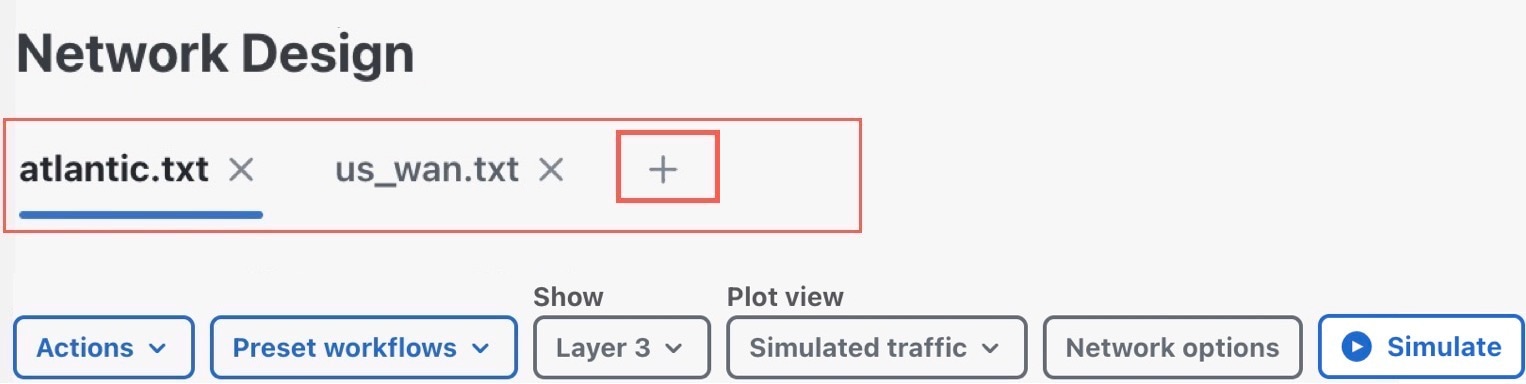
Click Save. The newly created network model opens in the Network Design page. By default, two nodes and interfaces are added to the network model. |
What to do next
-
Add nodes and site details to the network model you created. For details, see Create objects.
-
Open the plan file in the Network Design page (see Open plan files) to perform any actions, as per your requirement.

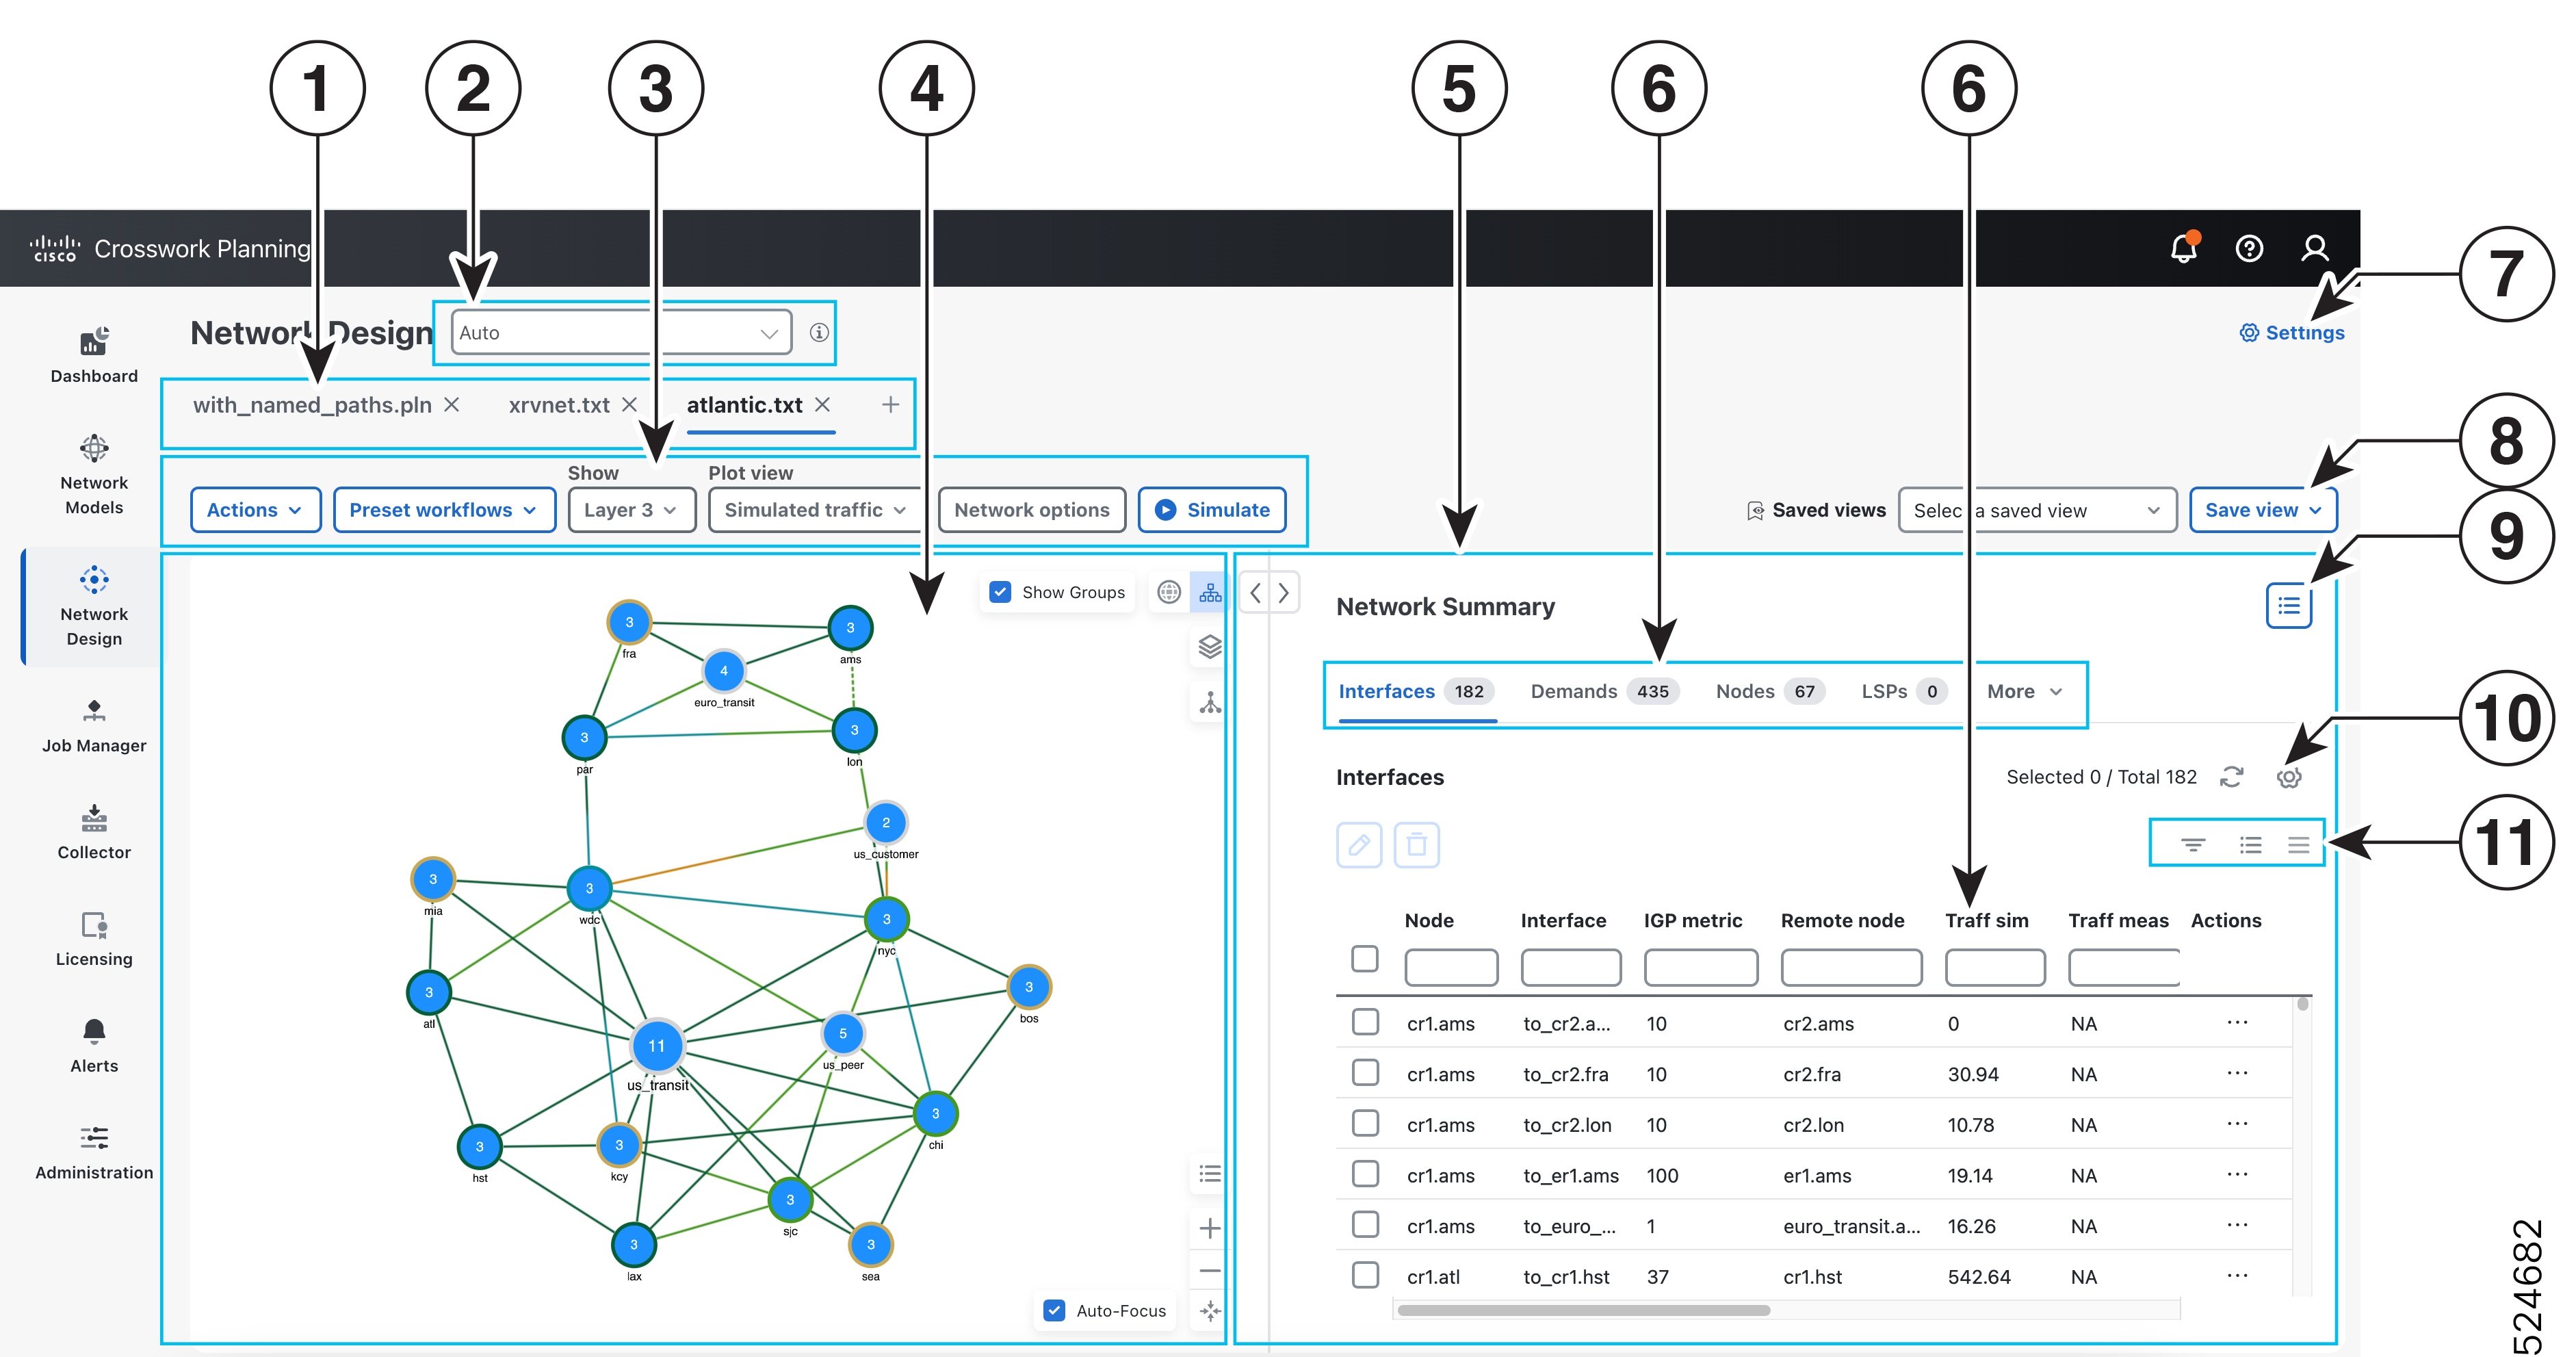
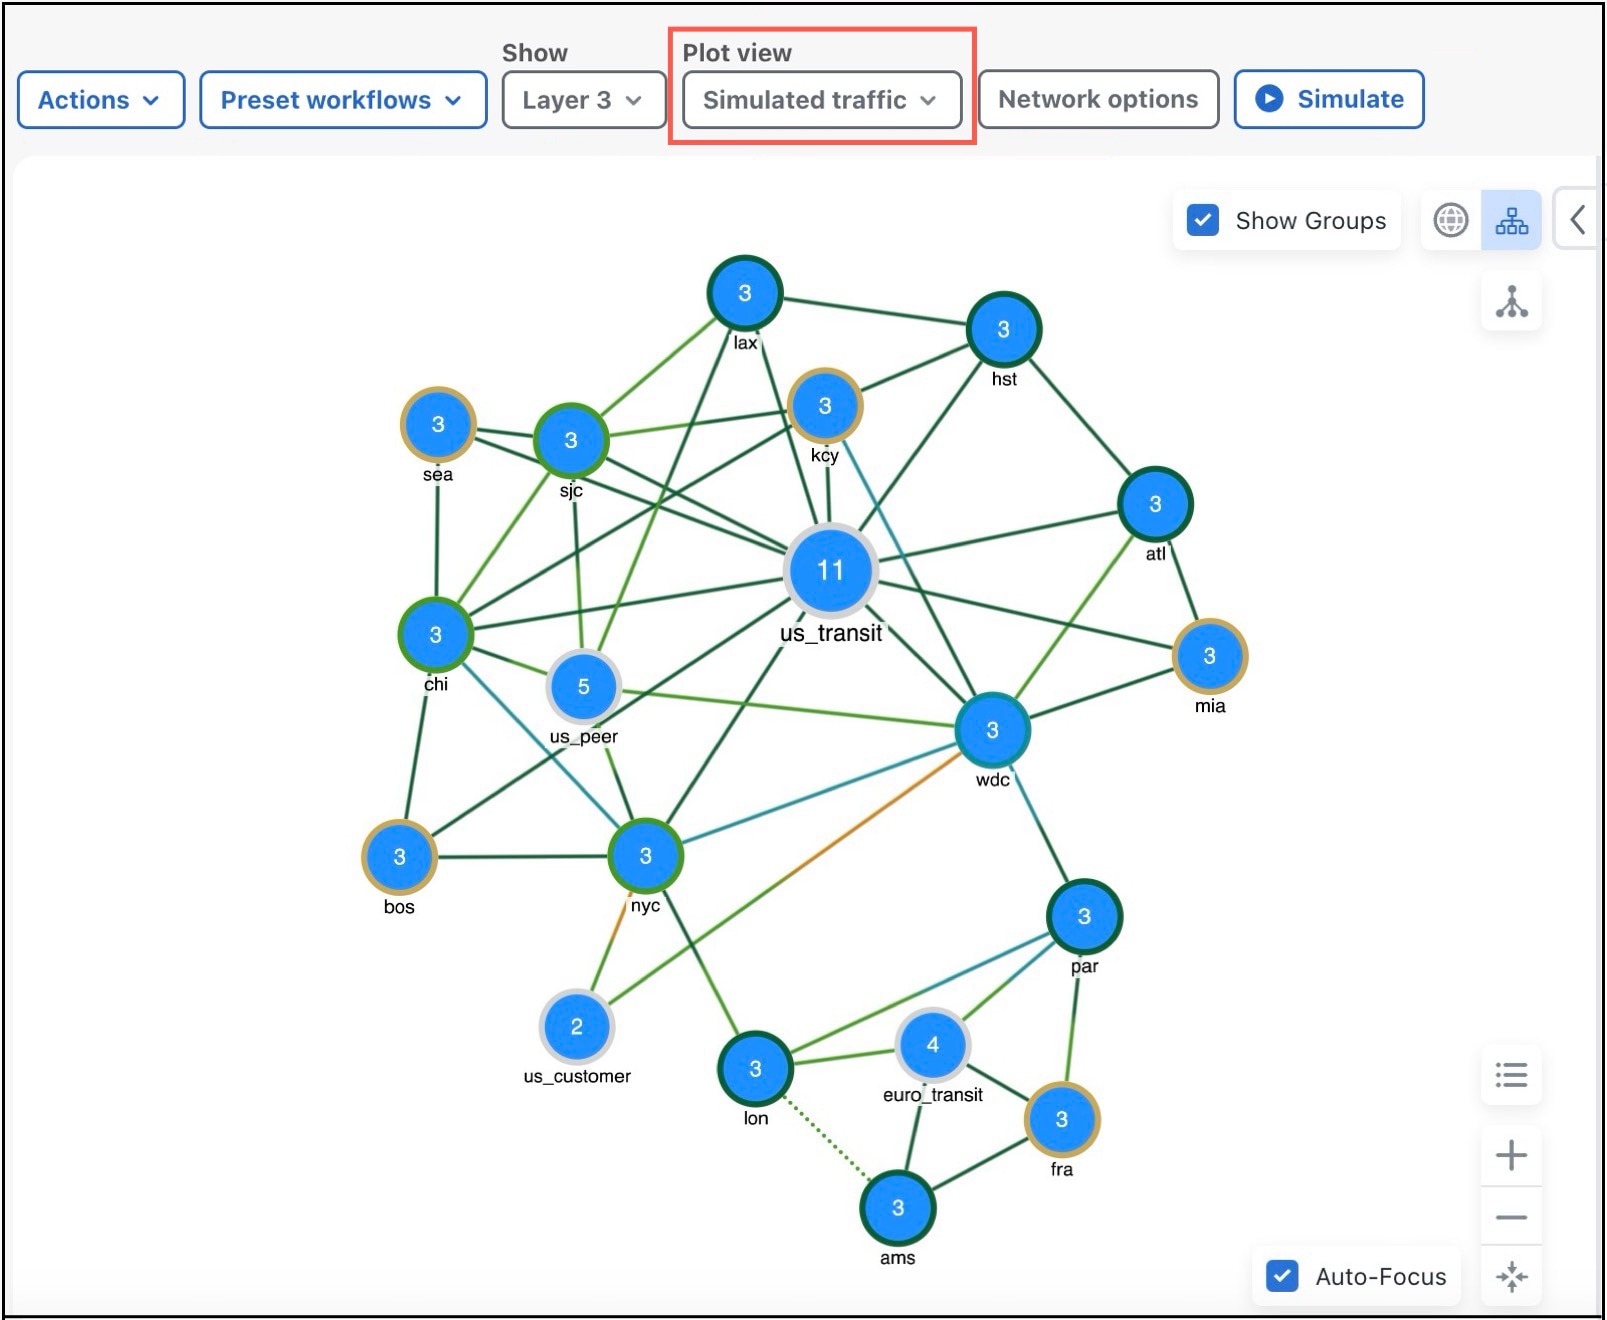
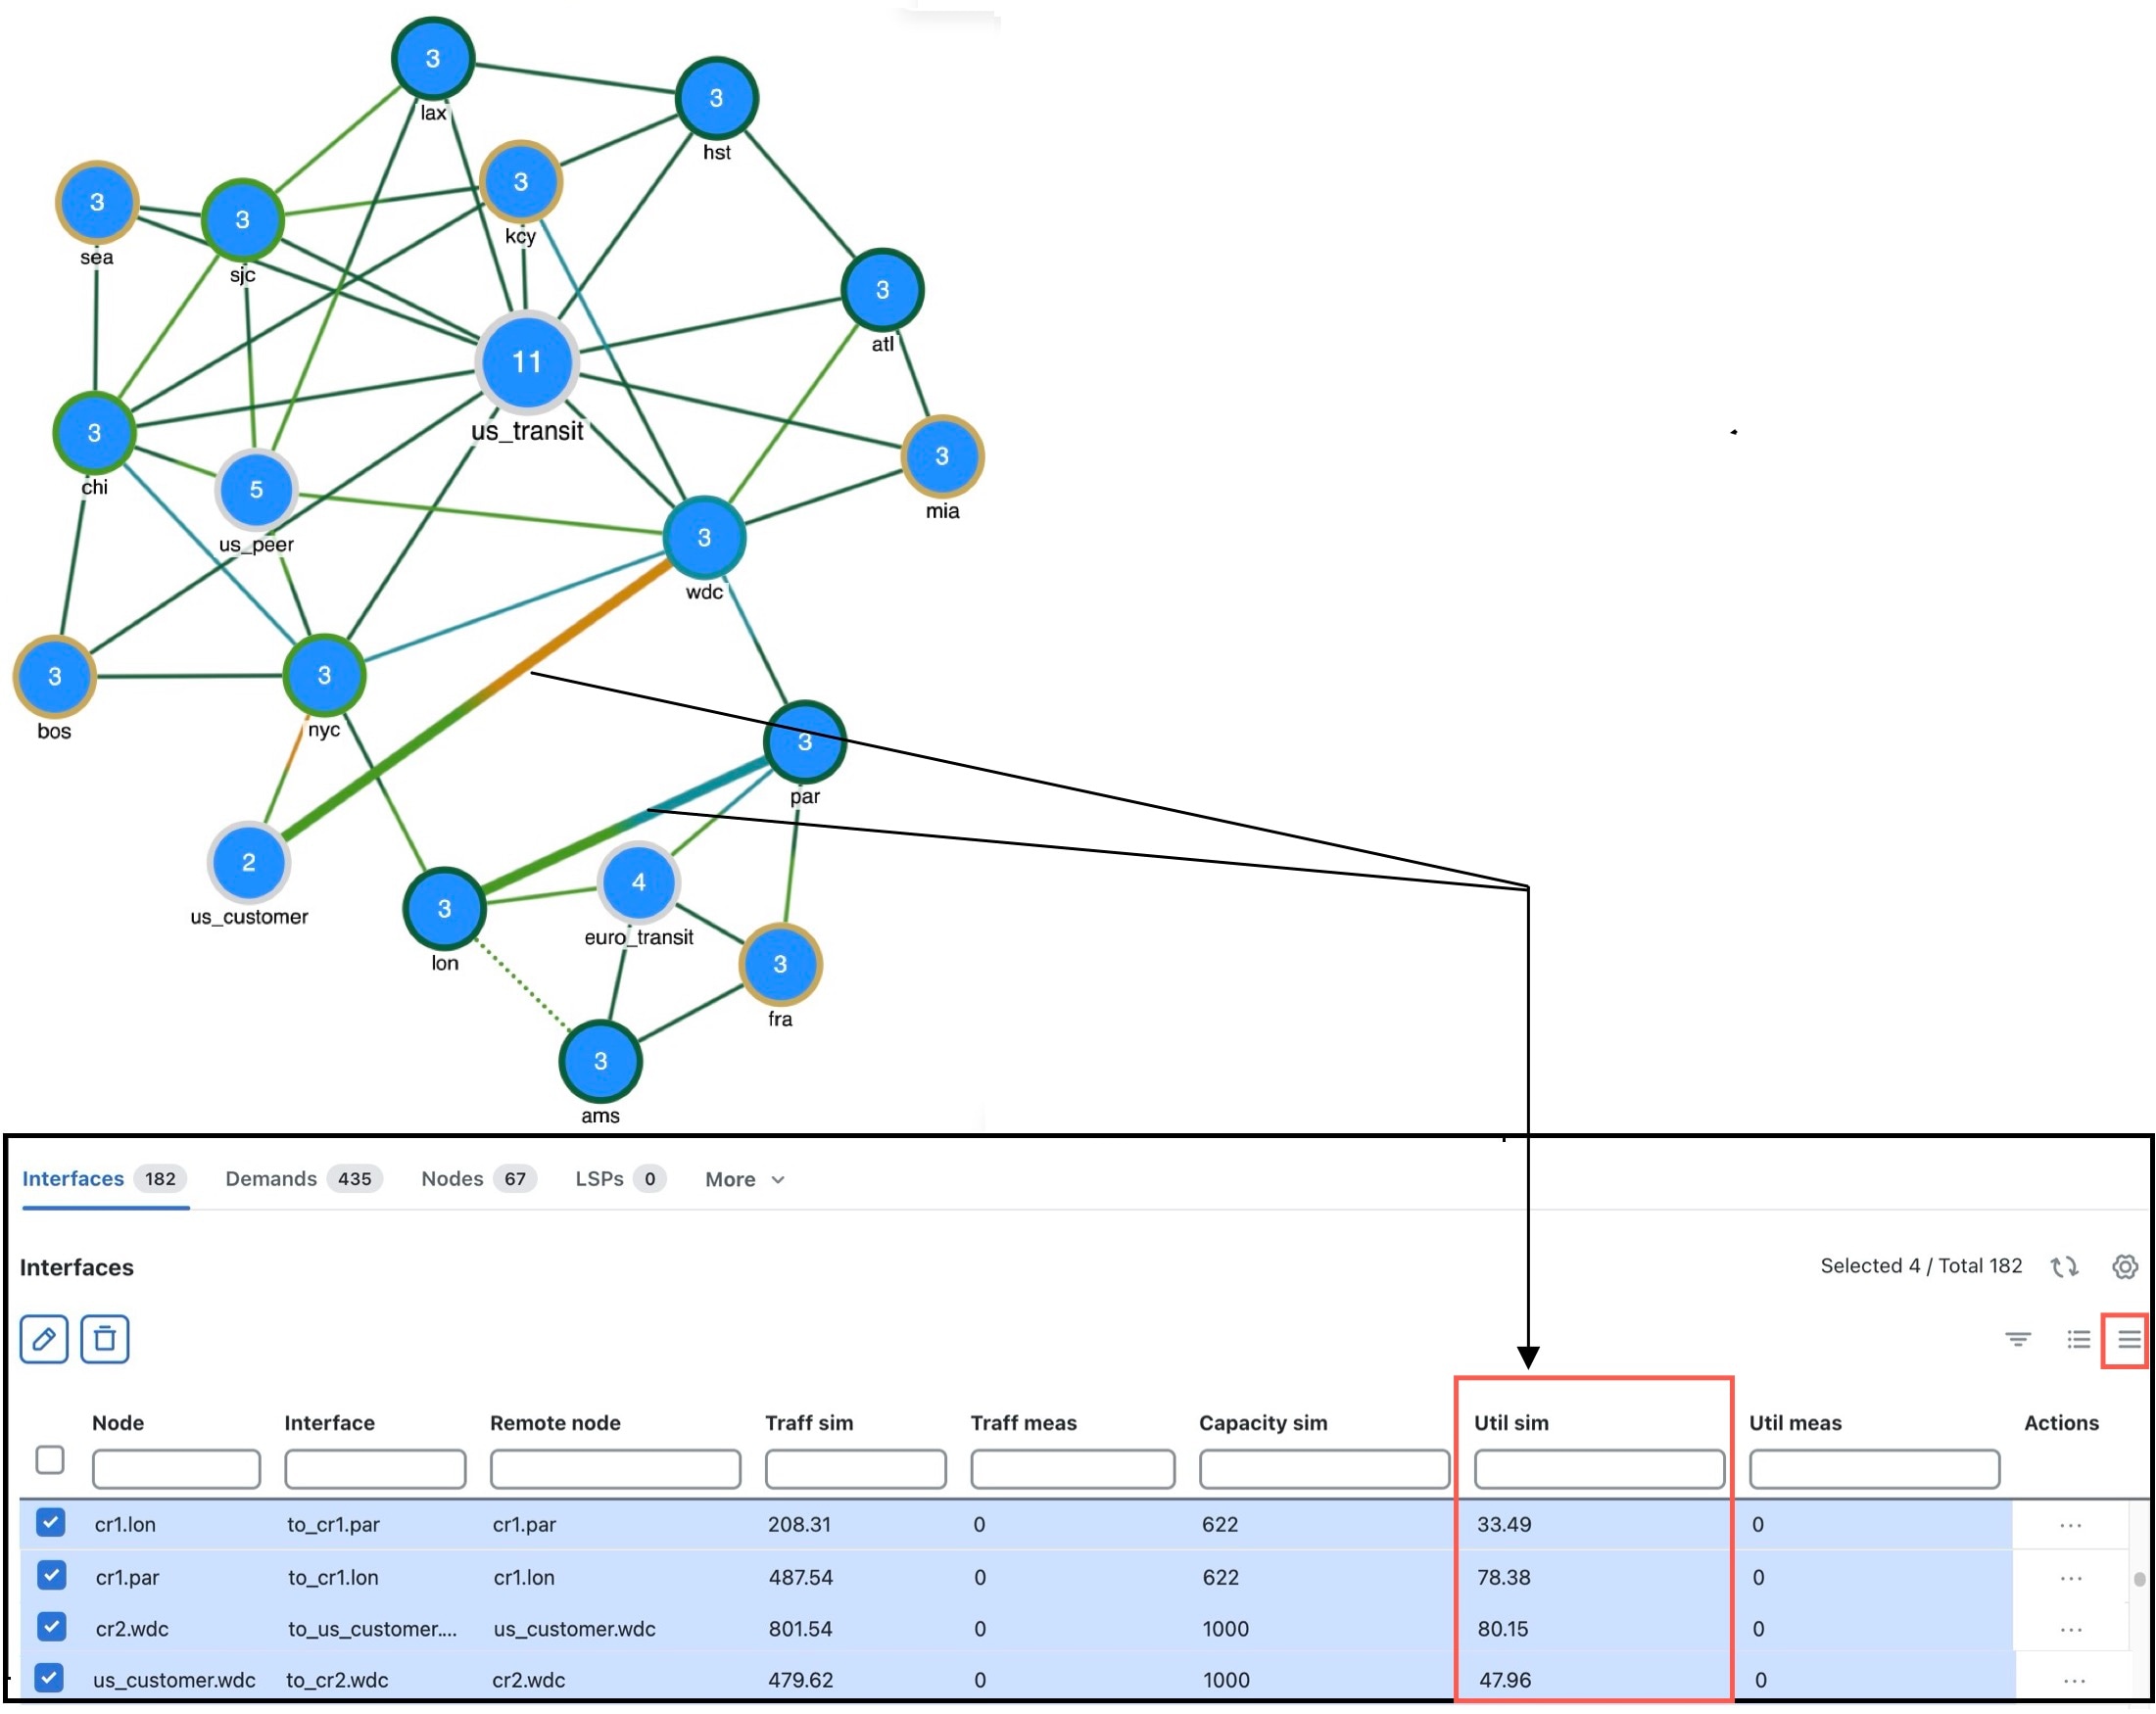
 )—Triggers resimulation. By default, any change that voids the current simulation does not automatically trigger resimulation.
For example, changes in topology trigger requires a resimulation. For details, see
)—Triggers resimulation. By default, any change that voids the current simulation does not automatically trigger resimulation.
For example, changes in topology trigger requires a resimulation. For details, see  button at the top right corner to enable/disable the Auto-resimulate option. For more information, see


 >
>  Feedback