Legend for Plan Objects

This chapter describes the representation of plan objects within the network plot in the Cisco Crosswork Planning Design UI. The objects, such as nodes and circuits, are visually depicted to facilitate network planning and design.

Plan objects

Description

Interfaces and circuits

Interfaces and Circuits

Nodes

Nodes

Sites

Sites

Demands

Demands

LSPs

LSPs

LSP paths

LSP named paths

LSP actual paths

SR LSP paths

Interfaces and Circuits

This section explains how the interfaces and circuits are represented in the network plot.

Table 1. Interface and Circuit visualization

Graphic

Description

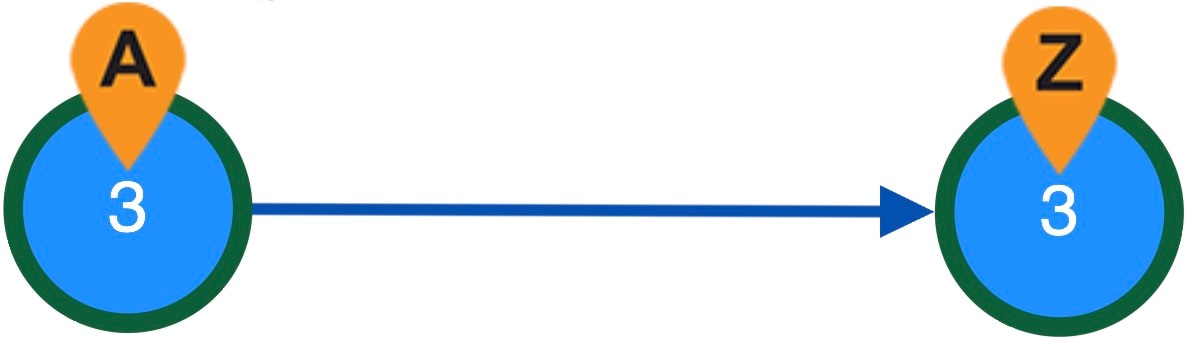
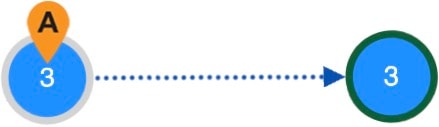
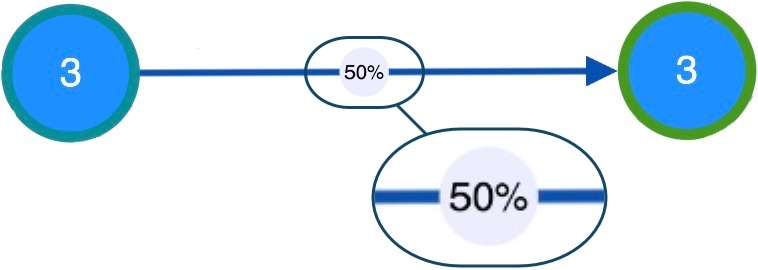
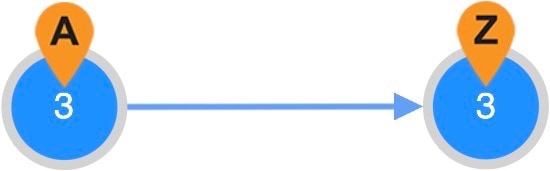
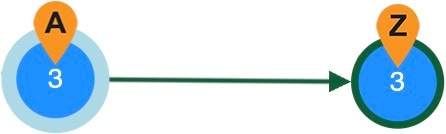
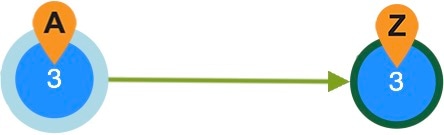
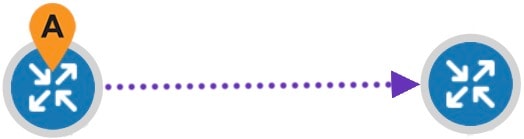
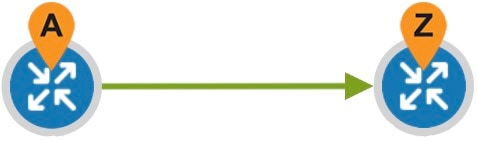
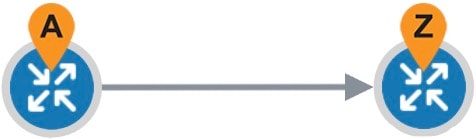
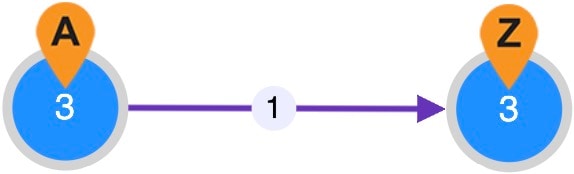
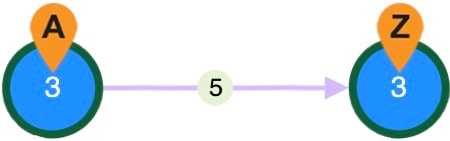
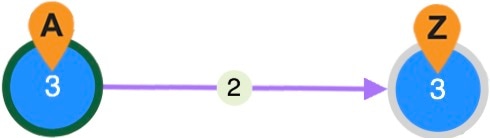
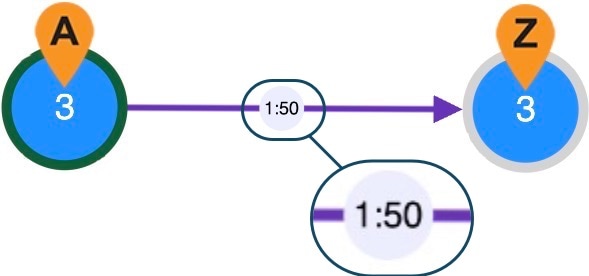
A solid line indicates a link between two devices. The color of the line varies depending on the outbound traffic utilization. For details on mapping between the color of the links and the traffic utilization, see Traffic utilization.

When an interface or circuit is selected, the width of the link doubles ().

When there are more than one link between two devices, a dotted line appears ().

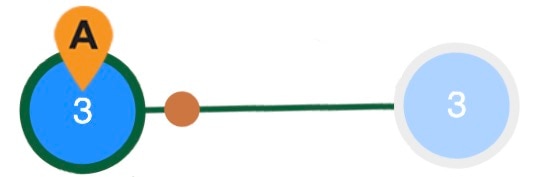
A red circle with a white X on a circuit indicates the circuit has failed.

A red circle with a white down arrow on a circuit indicates the circuit is not operational because of one of the these reasons:

  • A node connected to the circuit has failed.

  • A site that contains a node connected to the circuit has failed.

  • The circuit is a LAG (port channel) that does not meet its operational requirements (minimum number of available ports or minimum capacity, whichever is surpassed first) due to failure of some of its ports or port circuits.

  • An SRLG that contains the circuit or contains one of the above objects that are required for circuit operation has failed.

A gray circle with a white X on a circuit indicates the circuit is inactive.

A gray circle with a white down arrow on a circuit indicates the circuit is not operational because of one of the following reasons:

  • A node connected to the circuit is inactive.

  • A site containing a node connected to the circuit is inactive.

  • The circuit is a LAG that does not meet its operational requirements (minimum number of available ports or minimum capacity, whichever is surpassed first) due to some of its ports or port circuits being inactive.

  • An SRLG is inactive, containing the circuit or one of the above objects that are required for circuit operation.

Nodes

This section explains how the nodes are represented in the network plot.

Table 2. Node visualization

Graphic

Description

A blue icon as shown in the image indicates a node. Light blue outline indicates the node is selected.

A green border surrounds the node when:

  • Simulated traffic view—The node is the source or destination of simulated traffic that is greater than 0.

  • Measured traffic view—The node is the source or destination of measured traffic that is greater than 0.

  • LSP reservation view—The node is the source or destination of LSPs with non-zero bandwidth reservations.

A light gray border surrounds the node when:

  • Simulated traffic view—The node is not the source or destination of simulated traffic.

  • Measured traffic view—The node has ingress and egress traffic of 0 (zero).

  • LSP reservation view—The node is the source or destination of LSPs with 0 (zero) bandwidth reservations.

A dark gray border surrounds the node when:

  • Measured traffic view—The node has no ingress or egress traffic.

  • Worst-case traffic view—Nodes always have gray borders.

  • Failure impact view—The node is not included in the failures considered, or failing the node would not increase the traffic utilization on any circuit.

In the Failure impact view, the node border color represents the failure impact of a node. This is defined as the highest utilization experienced by any circuit if that node were to fail.

A red circle with a white X on the node indicates the node has failed.

A red circle with a white down arrow on the node indicates the node is not operational because it is contained in a failed site or in a failed SRLG.

A gray colored node indicates the node is not active.

A gray circle with a white down arrow on the node indicates the node is not operational because it is contained in an inactive site or an SRLG.

A green icon as shown in the image indicates one or more selected VPN nodes exist on the node.

Sites

Site utilization colors and symbols are based on intrasite objects. Note that intrasite objects include child sites and the objects contained within them.

This section explains how the sites are represented in the network plot.

Table 3. Site visualization

Graphic

Description

A blue circle indicates a site. The number inside the circle indicates the number of nodes (devices) in the site.

Light blue border indicates the site is selected.

  • Measured traffic and Simulated traffic views—The border color is the maximum traffic utilization color of all intrasite interfaces within the site.

  • Worst-case traffic view—The border color is the highest utilization that the interfaces within it experience over all the failure sets selected for Simulation Analysis.

  • Failure impact view—The border color is the maximum utilization level that would be caused elsewhere in the network should anode or circuit contained within it fail.

A gray border surrounds the site if all intrasite interfaces have zero utilization.

A red circle with a white X mark on the site indicates the site has failed.

A red circle with a white down arrow on the site indicates:

  • One or more intrasite objects have failed.

  • One or more nodes or circuits contained within the site are not operational because they are contained in a failed SRLG.

A gray colored site indicates:

  • The site is inactive.

  • One or more intrasite objects are inactive.

  • One or more nodes or circuits contained within the site are not operational because they are contained in an inactive SRLG.

A green icon as shown in the image indicates one or more selected VPN nodes exist on nodes within the site.

Demands

This section explains how the demands are represented in the network plot.

Table 4. Demand visualization

Graphic

Description

A dark blue arrow indicates a demand routed through an interface or a circuit. “A” and “Z” mark the source and destination site/node of a demand.

A dotted dark blue arrow indicates the rerouted demand under a failure.

Percentages show the proportion of a split demand (for example from ECMP) through an interface.

A light blue arrow indicates a demand routed over an LSP.

A dotted light blue arrow () indicates the rerouted demand over an LSP.

A dark green arrow indicates the shortest IGP path of a demand.

A dotted dark green arrow () shows the rerouted shorted IGP path of a demand during a failure.

A light green arrow indicates the shortest latency path of a demand.

A dotted light green arrow () shows the rerouted shorted latency path of a demand during a failure.

A dark brown arrow indicates the aggregated path of a demand. This appears when different types of demands, such as the shortest IGP path or shortest latency path, share the same demand route.

A dotted brown arrow () shows the rerouted aggregated path of a demand during a failure.

LSPs

This section explains how the LSPs are represented in the network plot.

Table 5. LSP visualization

Graphic

Description

A purple arrows indicates how LSP traffic is routed. “A” and “Z” mark the source and destination site/node of an LSP.

A dotted purple indicates the rerouting of LSP traffic when a failure occurs in Convergence mode.

A light green arrow indicates the shortest latency path of an LSP.

A dotted light green arrow () indicates the rerouted shorted latency path of an LSP during a failure.

A gray arrow indicates the shortest TE path of an LSP.

A dotted light gray arrow () indicates the rerouted shorted TE path of an LSP during a failure.

A brown arrow indicates the aggregated path of an LSP. This appears when different types of LSPs, such as the shortest IGP path, shortest TE path, or shortest latency path, share the same LSP route.

A dotted brown arrow () indicates the rerouted aggregated path of an LSP during a failure.

LSP paths

This section explains how the LSP paths are represented in the network plot.

Table 6. LSP path visualization

Graphic

Description

A purple arrow indicates the LSP primary path that is active (carrying traffic). “A” and “Z” mark the source and destination site/node of an LSP path. This is the path with lowest path option (for RSVP LSPs) or the highest preference (for SR LSPs). The number in the circle (here 1) is the path option.

A dotted purple arrow () indicates the rerouted primary path of an LSP during a failure.

A very dim purple arrow indicates the standby LSP path which is not a primary path and is defined as a Standby path. The number in the circle (here 5) is the path option.

A dotted arrow () shows the rerouted standby path of an LSP during a failure.

A light purple arrow indicates the alternative LSP path which is not a primary path of an LSP. The number in the circle (here 2) is the path option.

A dotted light purple arrow () shows the rerouted alternate path of an LSP during a failure.

The value in the circle (here 1:50) helps to identify the loadshare percentage that this LSP path is carrying for the selected LSP. In this example, 1 indicates the LSP path option and 50 indicates that the LSP loadshare percentage is 50%.

The maximum number of characters that can be displayed in this circle is 4. Therefore, it always shows the truncated value if the number of characters exceeds 4. For example, 1:50 is shown for 1:50% and 12:5 is shown for 12:50%. You can click the badge to see the complete value.

LSP named paths

This section explains how the LSP named paths are represented in the network plot.

Table 7. LSP named path visualization

Graphic

Description

A brown circle on an interface denotes it as a named path hop. “A” marks the source of a named path.

A brown outline on a site indicates that the site contains a node or interface that is a named path hop.

A brown outline on a node denotes it as a named path hop.

LSP actual paths

This section explains how the LSP actual paths are represented in the network plot.

Table 8. LSP actual path visualization

Graphic

Description

A dark yellow diamond on an interface denotes an LSP actual path hop on the interface.

A dark yellow outline on a site denotes an actual path hop on a node or interface within the site.

A dark yellow circle on a node denotes an actual path hop on the node.

SR LSP paths

This section explains how the SR LSP paths are represented in the network plot.

Table 9. SR LSP path visualization

Graphic

Description

A brown circle on an interface denotes an interface segment in an SR LSP.

A brown circle around a site indicates a site containing a node segment or an interface segment.

A brown circle around a node denotes the node segment in an SR LSP.