-
Cisco MDS 9000 Family Fabric Manager Configuration Guide, Release 3.4(1a)
-
Index
-
New and Changed Information
-
Preface
- Getting Started
- Installation and Switch Management
- Switch Configuration
-
Fabric Configuration
-
Configuring and Managing VSANs
-
SAN Device Virtualization
-
Creating Dynamic VSANs
-
Configuring Inter-VSAN Routing
-
Configuring and Managing Zones
-
Distributing Device Alias Services
-
Configuring Fibre Channel Routing Services and Protocols
-
Dense Wavelength Division Multiplexing
-
Managing FLOGI, Name Server, FDMI, and RSCN Databases
-
Discovering SCSI Targets
-
Configuring FICON
-
Advanced Features and Concepts
-
-
Security
-
Configuring FIPS
-
Configuring Users and Common Roles
-
Configuring SNMP
-
Configuring RADIUS and TACACS+
-
Configuring IPv4 Access Control Lists
-
Configuring Certificate Authorities and Digital Certificates
-
Configuring IPsec Network Security
-
Configuring FC-SP and DHCHAP
-
Configuring Port Security
-
Configuring Fabric Binding
-
- IP Services
- Intelligent Storage Services
- Network and Switch Monitoring
- Traffic Management
- Troubleshooting
-
Launching Fabric Manager in Cisco SAN-OS Releases Prior to 3.2(1)
-
Cisco Fabric Manager Unsupported Feature List
-
Interface Nonoperational Reason Codes
-
Managing Cisco FabricWare
-
Configuration Limits for Cisco MDS SAN-OS Release 3.1(x) and 3.2(x)
-
 Feedback
Table Of Contents
Launching Fabric Manager Client in Cisco SAN-OS Release 3.2(1) and Later
Fabric Manager Client Quick Tour
Setting Fabric Manager Preferences
Using Alias Names as Enclosures
Controlling Administrator Access with Users and Roles
Fabric Manager Troubleshooting Tools
Fabric Manager Client
Cisco Fabric Manager Client is a java-based GUI application that provides access to the Fabric Manager applications from a remote workstation.
This chapter contains the following sections:
•
Launching Fabric Manager Client in Cisco SAN-OS Release 3.2(1) and Later
•
•
•
•
•
About Fabric Manager Client
Cisco Fabric Manager is a Java and SNMP-based network fabric and device management tool with a GUI that displays real-time views of your network fabric, including Cisco MDS 9000 Family and third-party switches, hosts, and storage devices.
In addition to complete configuration and status monitoring capabilities for Cisco MDS 9000 Family switches, Fabric Manager Client provides Fibre Channel troubleshooting tools. These health and configuration analysis tools use the MDS 9000 switch capabilities including Fibre Channel ping and traceroute.
Note
Fabric Manager Advanced Mode
Advanced mode is enabled by default and provides the full suite of Fabric Manager features, including security, IVR, iSCSI, and FICON. Uncheck the Advanced check box in the upper right corner of the Fabric Manager Client to simplify the user interface. In this mode, you can access basic MDS 9000 features such as VSANs, zoning, and configuring interfaces.
Launching Fabric Manager Client in Cisco SAN-OS Release 3.2(1) and Later
Note
Note
To launch Fabric Manager Client, follow these steps:
Step 1
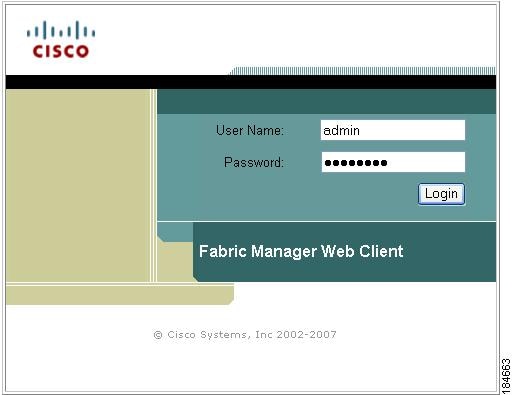
You see the Fabric Manager Web Server Login dialog box shown in Figure 5-1.
Figure 5-1 Fabric Manager Web Server Login Dialog Box
Step 2
You see the Fabric Manager Web Server Summary page.
Step 3
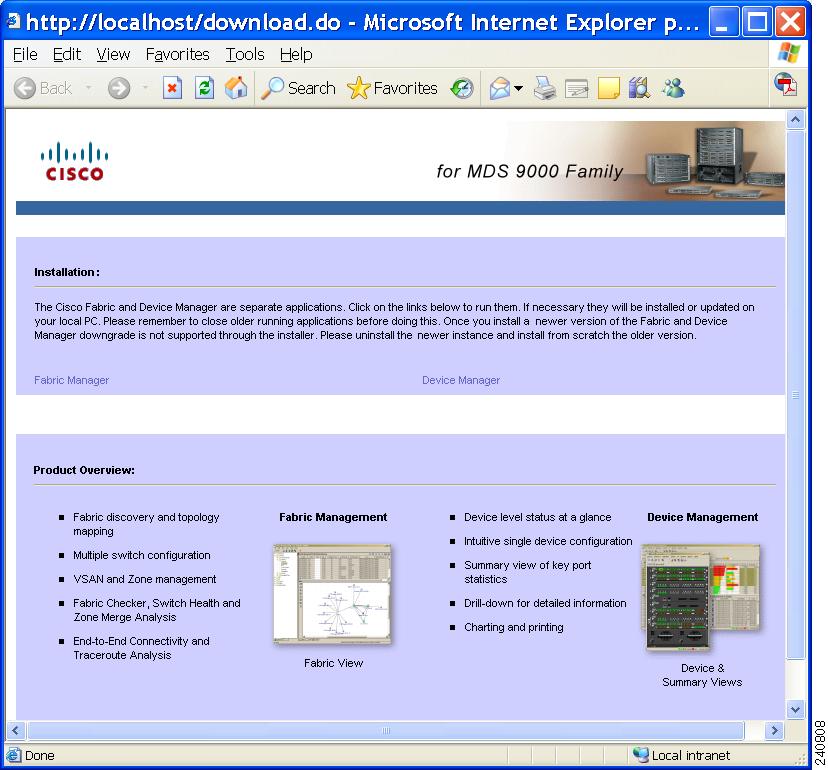
You see the Download page for Fabric Manager and Device Manager (see Figure 5-2).
Figure 5-2 Download Page for Fabric Manager and Device Manager
Step 4
If you are launching Fabric Manager Client for the first time, you see a message asking whether you want to create shortcuts for Fabric Manager (see Figure 5-3).
Figure 5-3 Fabric Manager Create Shortcut(s) Message
Step 5
Note
Step 6
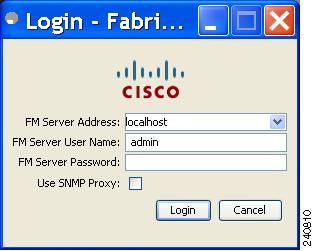
You see the Fabric Manager Login dialog box shown in Figure 5-4.
Figure 5-4 Fabric Manager Login Dialog Box
Step 7
Step 8
Step 9
Note
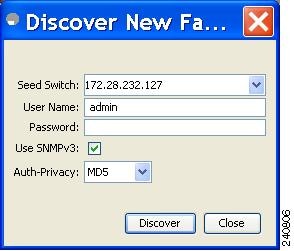
You see the Discover New Fabric dialog box shown in Figure 5-5.
Figure 5-5 Discover New Fabric Dialog Box
Note
Step 10
Step 11
Step 12
a.
b.
Note
Step 13
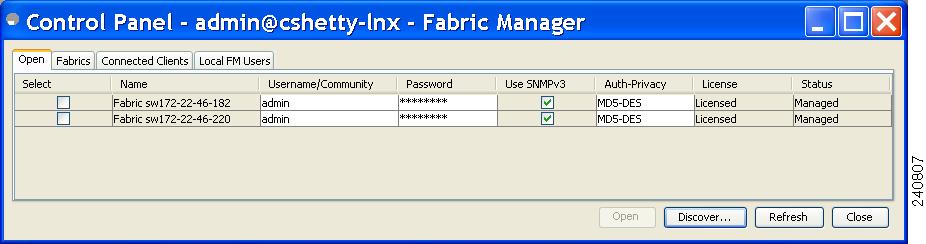
You see the Control Panel dialog box shown in Figure 5-6.
Figure 5-6 Control Panel Dialog Box
Note
Step 14
Note
Step 15
Note
To launch Fabric Manager Client from within a running instance of Fabric Manager, follow these steps:
Step 1
You see the Control Panel dialog box (see Figure 5-6).
Step 2
Note
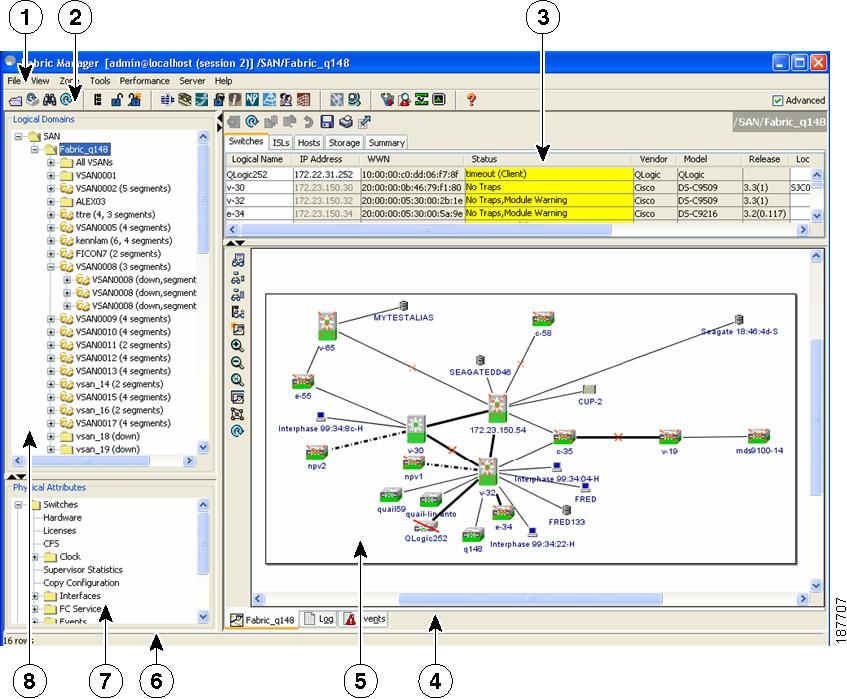
Fabric Manager Client Quick Tour
This section describes the Fabric Manager Client interface shown in Figure 5-7.
Figure 5-7 Fabric Manager Main Window
Note
Menu Bar
The menu bar at the top of the Fabric Manager main window provides options for managing and troubleshooting the current fabric and for controlling the display of information on the Fabric pane. The menu bar provides the following menus:
•
•
•
•
•
•
•
Toolbar
The Fabric Manager main toolbar provides icons for accessing the most commonly used menu bar options as shown in Table 5-1.
Logical Domains Pane
Use the Logical Domains pane to manage attributes for fabrics, VSANs, and zones, and to access user-defined groups. Under the fabric node, VSANs are ordered by a VSAN ID. The segmented VSANs are placed under the fabric node. The label next to the segmented VSAN indicates the number of segments. You can expand a segmented VSAN and the segments under that VSAN. Right-click one of the folders in the tree and click a menu item from the pop-up menu. You see the appropriate configuration dialog box.
The default name for the fabric is the name, IP address, or WWN for the principal switch in VSAN 1. If VSAN 1 is segmented, the default name is chosen from a principal switch with the smallest WWN. The fabric names you see are as follows:
•
•
•
To change the fabric name using Fabric Manager, follow these steps:
Step 1
You see the Control Panel dialog box.
Step 2
Step 3
Filtering
Fabric Manager has a filtering mechanism that displays only the data that you are interested in. To filter, first select the fabric and VSAN from the Logical Domains pane. This action narrows the scope of what is displayed in the Fabric pane. Any information that does not belong to the selected items is dimmed. Also, any information that does not belong to the selected items is not displayed in the tables in the Information pane. As shown in Figure 5-8, the filter that you select is displayed at the top right of the Fabric Manager window.
To further narrow the scope, select attributes from the Physical Attributes pane. The Fabric Manager table, display, and filter criteria change accordingly.
Physical Attributes Pane
Use the Physical Attributes pane to display a tree of the options available for managing the switches in the currently selected fabric, VSAN, or zone.
To select an option, click a folder to display the options available and then click the option. You see the table with information for the selected option in the Information pane. The Physical Attributes pane provides the following main folders:
•
•
•
•
•
•
•
•
Information Pane
Use the Information pane to display tables of information associated with the option selected from the menu tree in the Logical Domains or Physical Attributes panes. The Information pane toolbar provides buttons for performing one or more of the operations shown in Table 5-2.
Table 5-2 Information Pane Toolbar
Apply Changes
Applies configuration changes.
Refresh Values
Refreshes table values.
Create Row
Opens the appropriate dialog box to make a new row in the table.
Delete Row
Deletes the currently highlighted rows from the table.
Copy/Ctrl+C
Copies data from one row to another.
Paste/Ctrl +V
Pastes the data from one row to another.
Undo Changes/Ctrl-Z
Undoes the most recent change.
Export
Exports and saves information to a file.
Print Table
Prints the contents of the Information pane.
Detach Table
Displays a non-editable copy of the table in the Information pane in its own window, which you can move around the screen.
Note
Note
Detachable Tables
Detachable tables in Fabric Manager let you detach tables and move them to different areas on your desktop so that you can compare similar tables from different VSANs. You can keep informational tables open from one view while you examine a different area in Fabric Manager. To detach tables, click the Detach Table icon in the Information pane in Fabric Manager.
Fabric Pane
Use the Fabric pane to display the graphical representation of your fabric. Table 5-3 explains the graphics you may see displayed, depending on which devices you have in your fabric.
Table 5-3 Fabric Manager Graphics
Director class MDS 9000.
Non-director class MDS 9000.
Generic Fibre Channel switch.
Cisco SN5428.
An orange line through a device indicates that the device is manageable but there are operational problems.
An orange X through a device or link indicates that the device or ISL is not working properly.
A red line through a device indicates that the device is not manageable.
A red X through a device or link indicates that the device is down or that the ISL is down.
Fibre Channel HBA (or enclosure).
Fibre Channel target (or enclosure).
iSCSI host.
Fibre Channel ISL and edge connection.
Fibre Channel PortChannel.
IP ISL and edge connection.
IP PortChannel.
DWDM connection.
NPV connection.
Fibre Channel loop (storage).
IP cloud (hosts). This icon is also used to represent a fabric when viewing a SAN (multiple fabrics) in the Fabric Manager Fabric pane.
Any device, cloud, or loop with a box around it means that there are hidden links attached.
p
If a switch or director is grayed out, Fabric Manager can no longer communicate with it.
The bottom of the Fabric pane has the following tabs:
•
•
•
When viewing large fabrics in the Fabric pane, it is helpful to do the following tasks:
•
•
•
•
Note
Context Menus
When you right-click an icon in the Fabric pane, you see a pop-up menu with options that vary depending on the type of icon selected. The various options available for different objects include the following:
•
•
•
•
•
•
•
•
•
The Fabric pane has its own toolbar with options for saving, printing, and changing the appearance of the map. When you right-click the map, a pop-up menu appears that provides options (duplicated on the toolbar) for changing the appearance of the map.
Note
Saving the Map
You can save the map in the Fabric Pane as an image, or as an editable Visio diagram. You can save the map with or without labels on the links. The created Visio diagram is editable and saved in two layers:
•
•
To save the map as a Visio diagram, select Files > Export > Visio and choose Map or Map with link labels. The saved Visio diagram retains the viewing options that you selected from the Fabric pane. For example, if you collapse multiple links in the map and export the links as a Visio diagram, the Visio diagram shows those multiple links as one solid link.
The Show Tech Support option from the Tools menu also supports saving the map as a Visio diagram.
Purging Down Elements
The Fabric pane allows you to refresh the map at any time by clicking the Refresh Map icon. The Refresh Map icon redraws the map but does not purge elements that are down. To purge down elements you can:
•
•
•
Note
Multiple Fabric Display
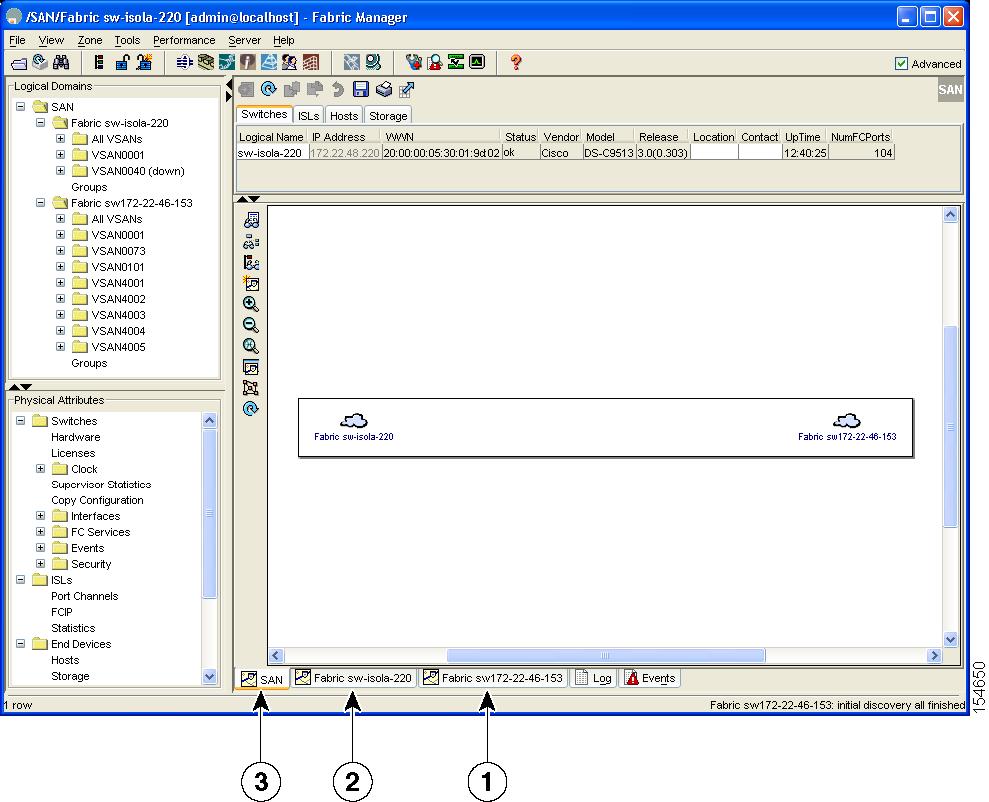
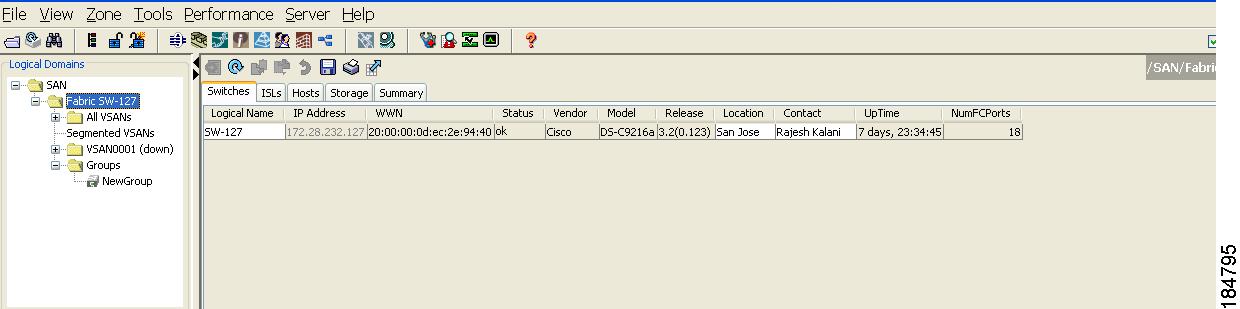
Fabric Manager can display multiple fabrics in the same pane (see Figure 5-8).
Figure 5-8 Fabric Manager's Multiple Fabric Display Window
The Fabric view tab for fabric 172.23.46.152. When selected, the Fabric view displays fabric 172.23.46.152.
The Fabric view tab for fabric 172.23.46.153. When selected, the Fabric view displays fabric 172.23.46.153.
SAN tab (selected), showing two fabrics.
Note
The information for both fabrics is displayed; you do not need to select a seed switch. To see details of a fabric, select the tab for that fabric at the bottom of the Fabric pane, or double-click the Cloud icon for the fabric in the SAN tab.
Note
Filtering by Groups
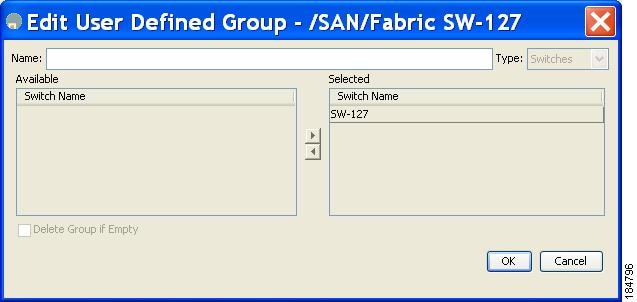
You can filter the Fabric pane display by creating groups of switches or end ports. To create a group in Fabric Manager, follow these steps:
Step 1
You see the Edit User Defined Group dialog box shown in Figure 5-9.
Figure 5-9 Edit User Defined Group Dialog Box
Step 2
Step 3
Step 4
To add a switch or end port to an existing group in Fabric Manager, follow these steps:
Step 1
You see the Edit User Defined Group dialog box (see Figure 5-9).
Step 2
Step 3
To filter the display by a group you have created, follow these steps:
Step 1
You see the list of groups that you have created as shown in Figure 5-10.
Figure 5-10 Group Highlighted in Fabric Pane Map
Step 2
In the Fabric pane, the switches or end devices in your group are shown normally; all other switches and end devices are shown in gray.
Step 3
Note
Status Bar
The status bar at the bottom of the Fabric Manager window shows the last entry displayed by the discovery process, and the possible error message on the right side. The status bar displays a message stating that something has changed in the fabric and a new discovery is needed. The status bar shows both short-term, transient messages (such as the number of rows displayed in the table) and long-term discovery issues.
Setting Fabric Manager Preferences
To set your preferences for the behavior of the Fabric Manager, choose File > Preferences from the Fabric Manager menu bar. You see the Preferences dialog box with the following tabs for setting different components of the application:
•
•
•
The default General preferences for Fabric Manager are as follows:
•
•
•
•
•
•
Note
•
•
•
•
The default SNMP preferences for Fabric Manager are as follows:
•
•
•
The default Map preferences for Fabric Manager are as follows:
•
•
•
•
•
•
•
•
•
•
•
•
Network Fabric Discovery
Cisco Fabric Manager collects information about the fabric topology through SNMP queries to the switches that are connected to Fabric Manager. The switch replies after having discovered all devices connected to the fabric by using the information from its FSPF technology database and the Name Server database and collected using the Fabric Configuration Server's request/response mechanisms that are defined by the FC-GS-3/4 standard. When you start Fabric Manager, you enter the IP address (or host name) of a seed switch for discovery.
After you start Fabric Manager and the discovery completes, Fabric Manager presents you with a view of your network fabric, including all discovered switches, hosts, and storage devices.
Modifying the Device Grouping
Because not all devices are capable of responding to FC-GS-3 requests, different ports of a single server or storage subsystem may be displayed as individual end devices on the Fabric Manager map.
To group end devices in a single enclosure to have them represented by a single icon on the map, Fabric Manager, follow these steps:
Step 1
You see the end devices displayed in the Information pane.
Step 2
Step 3
Step 4
Step 5
Step 6
Note
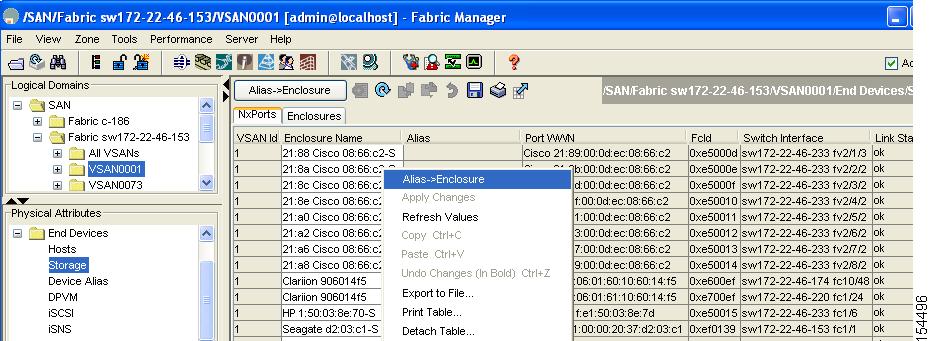
Using Alias Names as Enclosures
To create an enclosure that uses the alias name as the name of the enclosure using Fabric Manager, follow these steps:
Step 1
You see the list of devices in the Information pane. The NxPorts tab is the default.
Step 2
Figure 5-11 Alias Enclosure
Step 3
Controlling Administrator Access with Users and Roles
Cisco MDS 9000 Family switches support role-based management access whether using the CLI or Cisco Fabric Manager. This lets you assign specific management privileges to particular roles and then assign one or more users to each role.
The default-role contains the access permissions needed by a user to access the GUI (Fabric Manager and Device Manager). These access permissions are automatically granted to all users in order for them to use the GUI.
Cisco Fabric Manager uses SNMPv3 to establish role-based management access. After completing the setup routine, a single role, user name, and password are established. The role assigned to this user allows the highest level of privileges, which includes creating users and roles. Use the Cisco Fabric Manager to create roles and users and to assign passwords as required for secure management access in your network.
Using Fabric Manager Wizards
Fabric Manager Client provides the following wizards to facilitate common configuration tasks:
•
•
•
•
•
•
•
•
•
•
•
•
•
Fabric Manager Troubleshooting Tools
Fabric Manager has several troubleshooting tools available from the toolbar or Tools menu. Procedures for using these tools are described in Chapter 68, "Troubleshooting Your Fabric." This section provides a brief description of each tool:
•
•
–
–
End devices are connected to a manageable switch (have a currently active in-band or out-of-band management path.)
•
•
After the analysis is run, the results are displayed with details about the issues that were discovered. You can automatically resolve configuration differences by selecting them and clicking the Resolve button. Fabric Manager automatically changes the configuration to match the reference switch or policy file.