-
Cisco MDS 9000 Family Fabric Manager Configuration Guide, Release 3.4(1a)
-
Index
-
New and Changed Information
-
Preface
- Getting Started
- Installation and Switch Management
- Switch Configuration
-
Fabric Configuration
-
Configuring and Managing VSANs
-
SAN Device Virtualization
-
Creating Dynamic VSANs
-
Configuring Inter-VSAN Routing
-
Configuring and Managing Zones
-
Distributing Device Alias Services
-
Configuring Fibre Channel Routing Services and Protocols
-
Dense Wavelength Division Multiplexing
-
Managing FLOGI, Name Server, FDMI, and RSCN Databases
-
Discovering SCSI Targets
-
Configuring FICON
-
Advanced Features and Concepts
-
-
Security
-
Configuring FIPS
-
Configuring Users and Common Roles
-
Configuring SNMP
-
Configuring RADIUS and TACACS+
-
Configuring IPv4 Access Control Lists
-
Configuring Certificate Authorities and Digital Certificates
-
Configuring IPsec Network Security
-
Configuring FC-SP and DHCHAP
-
Configuring Port Security
-
Configuring Fabric Binding
-
- IP Services
- Intelligent Storage Services
- Network and Switch Monitoring
- Traffic Management
- Troubleshooting
-
Launching Fabric Manager in Cisco SAN-OS Releases Prior to 3.2(1)
-
Cisco Fabric Manager Unsupported Feature List
-
Interface Nonoperational Reason Codes
-
Managing Cisco FabricWare
-
Configuration Limits for Cisco MDS SAN-OS Release 3.1(x) and 3.2(x)
-
 Feedback
Table Of Contents
Configuring RMON Using Threshold Manager
Enabling 32 bit RMON Alarms for VSANs
Enabling 32 and 64-Bit RMON Alarms for Physical Components
Creating a New RMON from Device Manager Threshold Manager
Enabling RMON Alarms for VSANs
Configuring RMON
RMON is an Internet Engineering Task Force (IETF) standard monitoring specification that allows various network agents and console systems to exchange network monitoring data. You can use the RMON alarms and events to monitor Cisco MDS 9000 Family switches running the Cisco SAN-OS Release 2.0(1b) or later software.
This chapter includes the following sections:
•
Configuring RMON Using Threshold Manager
About RMON
All switches in the Cisco MDS 9000 Family support the following RMON functions (defined in RFC 2819):
•
•
Refer to the Cisco MDS 9000 Family MIB Quick Reference for agent and management information.
See the "About SNMP Security" section on page 31-1 for SNMP security-related CLI configurations.
Configuring RMON Using Threshold Manager
RMON is disabled by default and no events or alarms are configured in the switch. You can configure your RMON alarms and events by using the CLI or by using Threshold Manager in Device Manager.
The Threshold Monitor allows you to trigger an SNMP event or log a message when the selected statistic goes over a configured threshold value. RMON calls this a rising alarm threshold. The configurable settings are as follows:
•
•
•
•
Note
Note
RMON Alarm Configuration
Threshold Manager provides a list of common MIB objects to set an RMON threshold and alarm on. You can also set an alarm on any MIB object. The specified MIB must be an existing SNMP MIB object in standard dot notation (1.3.6.1.2.1.2.2.1.14.16 for ifInOctets.16).
Use one of the following options to specify the interval to monitor the MIB variable (ranges from 1 to 4294967295 seconds):
•
•
•
The range for the rising threshold and falling threshold values is -2147483647 to 2147483647.
Caution
You can optionally specify the following parameters:
•
•
Enabling RMON Alarms by Port
To configure an RMON alarm for one or more ports using Device Manager, follow these steps:
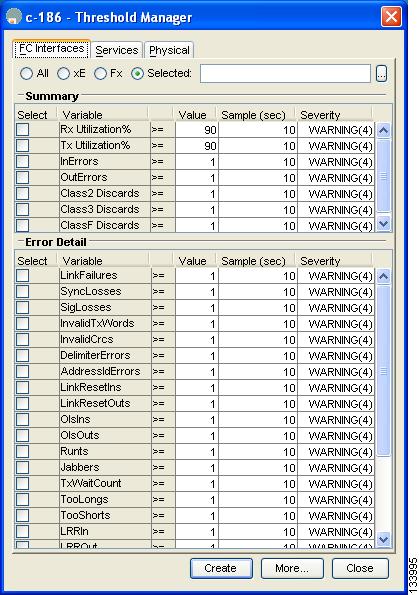
Step 1
You see the Threshold Manager dialog box as shown in Figure 61-1.
Figure 61-1 Threshold Manager Dialog Box
Step 2
a.
b.
c.
Alternatively, click the appropriate radio button to choose ports by type: All ports, xE ports, or Fx ports.
Step 3
Step 4
Step 5
Step 6
Step 7
Step 8
Step 9
Step 10
To configure an RMON alarm for one or more ports using Device Manager, follow these steps:
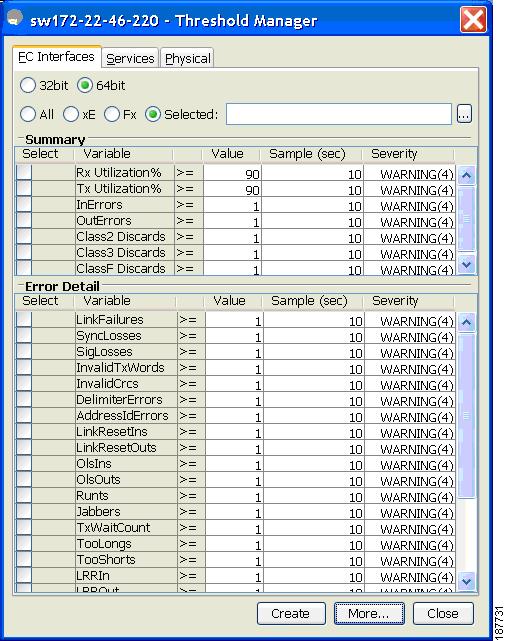
Step 1
You see the create 32 and 64-bit alarm dialog box shown in Figure 61-2.
Figure 61-2 Create 32 and 64-Bit Dialog Box
Step 2
a.
b.
c.
Alternatively, click the appropriate radio button to choose ports by type: All ports, xE ports, or Fx ports.
Step 3
Step 4
Step 5
Step 6
Step 7
Step 8
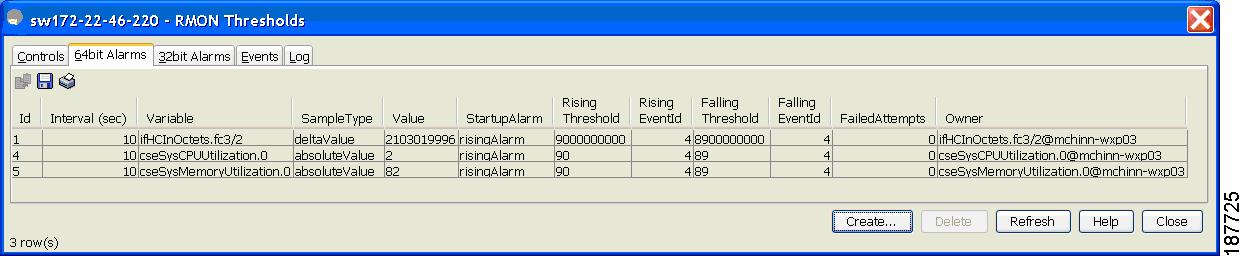
Step 9
Figure 61-3 RMON Threshold Dialog Box
Step 10
To create 64-bit RMON alarms using Fabric Manager, follow these steps:
Step 1
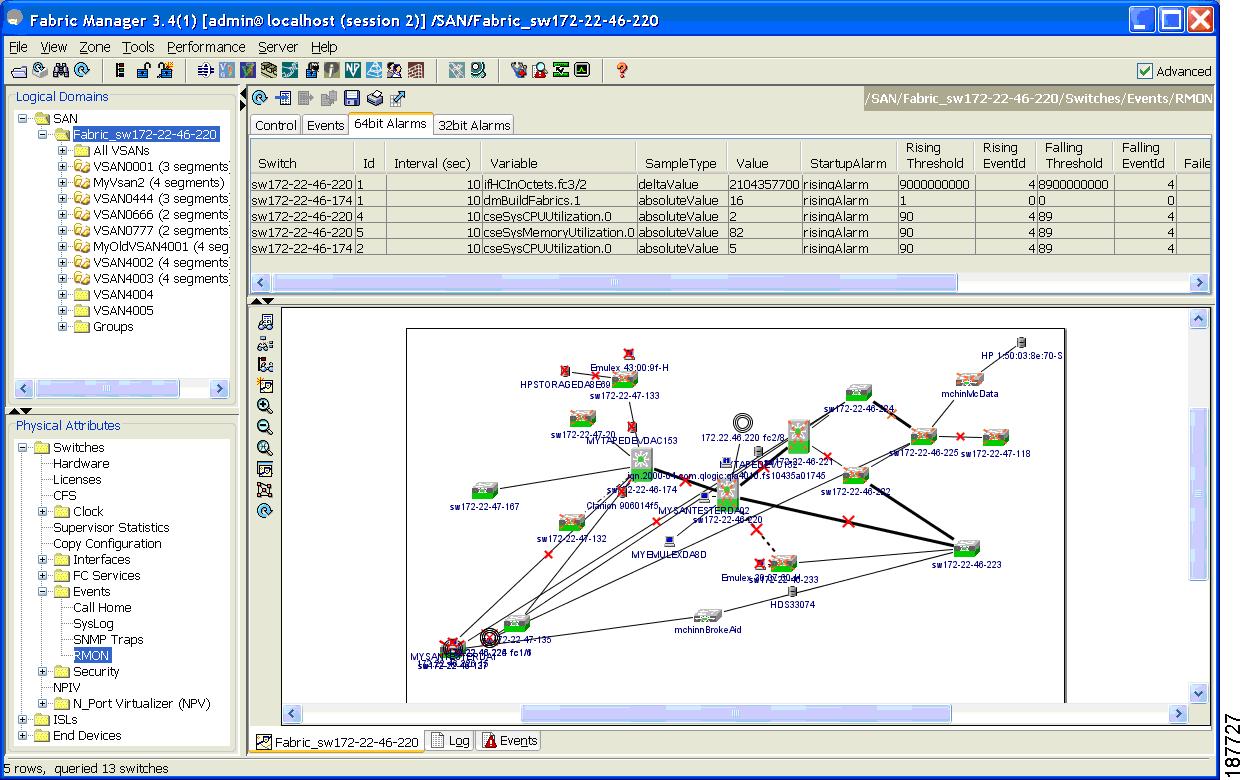
You see the 64-bit alarm dialog box as shown in Figure 61-4.
Figure 61-4 64-Bit alarm Dialog Box
Step 2
Step 3
Figure 61-5 64-Bit Alarm Create Row Tab
Step 4
Step 5
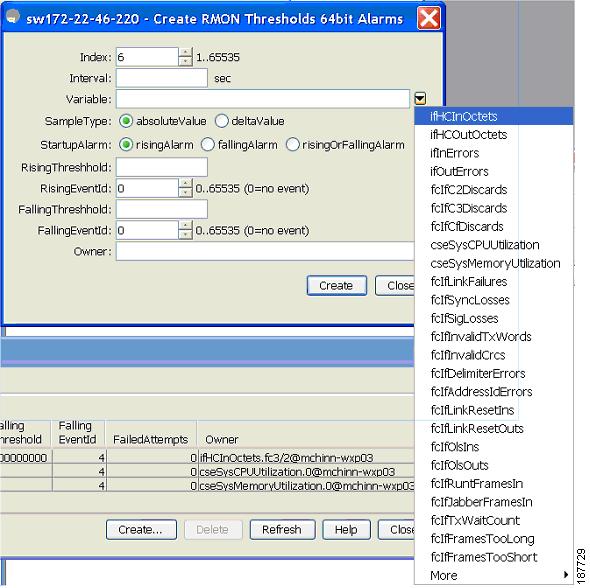
Figure 61-6 MIB Variable Field Dialog Box for 64-Bit Alarms
Note
Step 6
Step 7
Step 8
Step 9
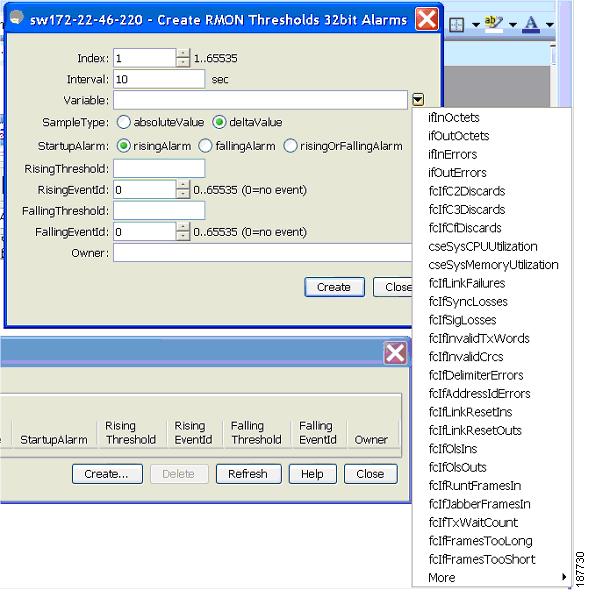
Figure 61-7 MIB Variable Field Dialog Box for 32-Bit Alarms
Step 10
Enabling 32 bit RMON Alarms for VSANs
To enable an RMON alarm for one or more VSANs using Device Manager, follow these steps:
Step 1
You see the Threshold Manager dialog box.
Step 2
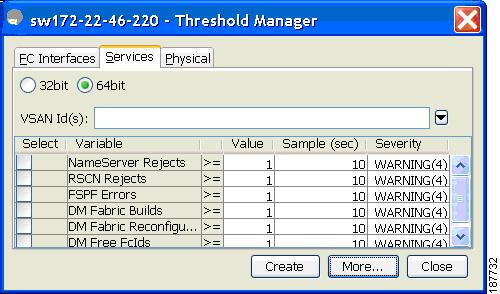
You see the Threshold Manager dialog box with the Services tab for 32-bit alarm selectedas shown in Figure 61-8.
Figure 61-8 Services Tab for 32-Bit Alarm Dialog Box
Step 3
Step 4
Step 5
Step 6
Step 7
Step 8
Step 9
Step 10
If you do not confirm the operation, the system only defines a log event.
Step 11
Enabling 32 and 64-Bit RMON Alarms for Physical Components
To configure an RMON alarm for a physical component for a 64-bit alarm using Device Manager, follow these steps:
Step 1
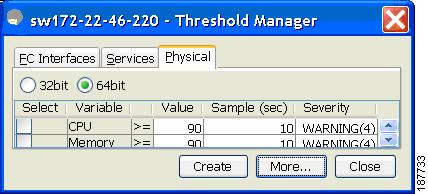
You see the Threshold Manager dialog box with the Physical tab for the 64-bit alarm selectedas shown in Figure 61-9.
Figure 61-9 Physical Tab for the 64-Bit Alarm
Step 2
Step 3
Step 4
Step 5
Step 6
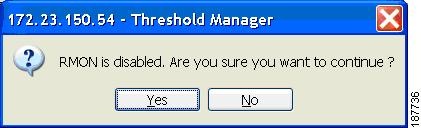
Step 7
If you do not confirm the operation, the system only defines a log event.
Step 8
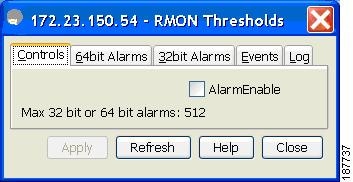
Figure 61-10 64-Bit Alarm Tab
Note
Creating a New RMON from Device Manager Threshold Manager
RMON does not check the RMON alarm configuration before configuring the switch.
To configure an RMON alarm from Device Manager Threshold Manager, follow these steps:
Step 1
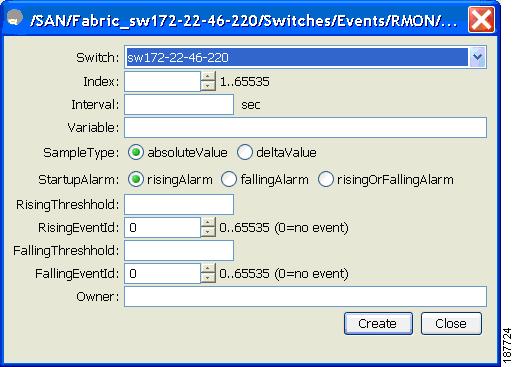
You see the create RMON alarm Threshold Manager dialog box as shown in Figure 61-11.
Figure 61-11 Create RMON Alarm Threshold Manager
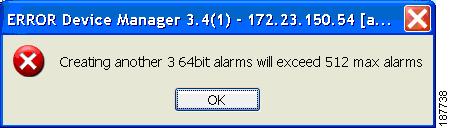
A user error is prompted if adding the new alarm exceeds the maximum alarm.
Note
Figure 61-12 RMON Control Threshold Tab
Figure 61-13 Device Manager Error Tab
Enabling RMON Alarms for VSANs
To enable an RMON alarm for one or more VSANs using Device Manager, follow these steps:
Step 1
You see the Threshold Manager dialog box.
Step 2
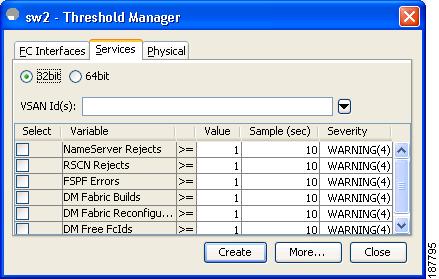
You see the Threshold Manager dialog box with the Services tab selected as shown in Figure 61-14.
Figure 61-14 Threshold Manager Services Tab
Step 3
Step 4
Step 5
Step 6
Step 7
Step 8
Step 9
If you do not confirm the operation, the system only defines a log event.
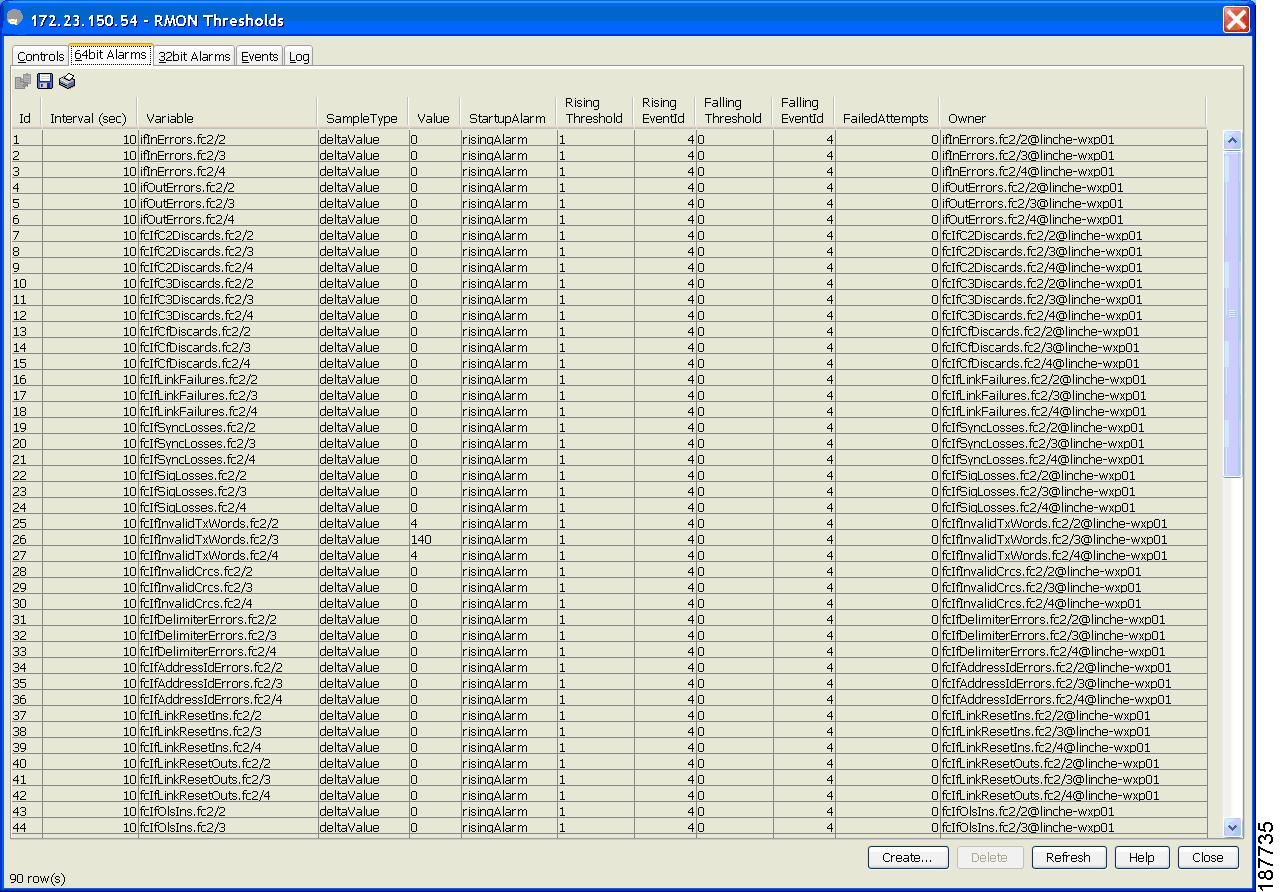
Step 10
Figure 61-15 List of Threshold Alarms
Step 11
Managing RMON Events
To define customized RMON events using Device Manager, follow these steps:
Step 1
Step 2
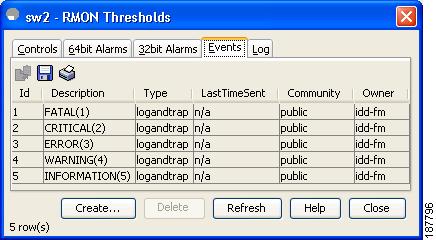
You see the RMON Thresholds Events tab as shown in Figure 61-16.
Figure 61-16 RMON Thresholds Events Tab
Step 3
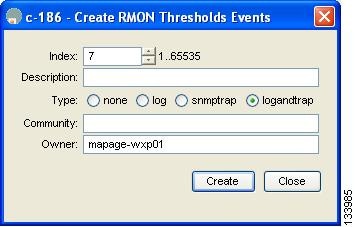
You see the Create RMON Thresholds Events dialog box as shown in Figure 61-17.
Figure 61-17 Create RMON Thresholds Events Dialog Box
Step 4
Step 5
Step 6
Step 7
Step 8
Step 9
Managing RMON Alarms
To view the alarms that have already been enabled using Device Manager, follow these steps:
Step 1
Step 2
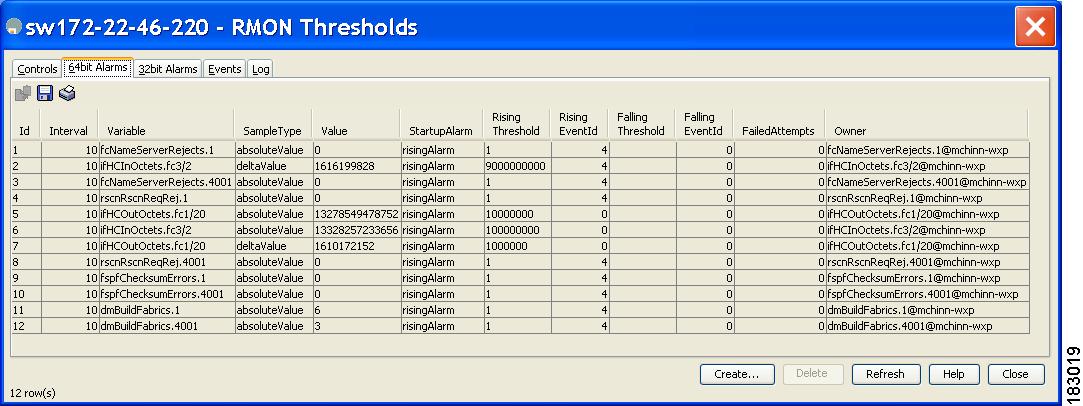
You see the RMON Thresholds dialog box as shown in Figure 61-18.
Figure 61-18 RMON Thresholds Dialog Box
Step 3
Viewing the RMON Log
To view the RMON log using Device Manager, follow these steps:
Step 1
Step 2
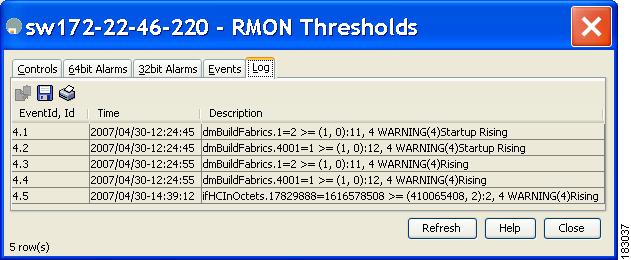
You see the RMON Thresholds Log tab (see Figure 61-19). This is the log of RMON events that have been triggered by the Threshold Manager.
Figure 61-19 RMON Thresholds Log Tab
Default Settings
Table 61-1 lists the default settings for all RMON features in any switch.