-
Cisco MDS 9000 Family Fabric Manager Configuration Guide, Release 3.4(1a)
-
Index
-
New and Changed Information
-
Preface
- Getting Started
- Installation and Switch Management
- Switch Configuration
-
Fabric Configuration
-
Configuring and Managing VSANs
-
SAN Device Virtualization
-
Creating Dynamic VSANs
-
Configuring Inter-VSAN Routing
-
Configuring and Managing Zones
-
Distributing Device Alias Services
-
Configuring Fibre Channel Routing Services and Protocols
-
Dense Wavelength Division Multiplexing
-
Managing FLOGI, Name Server, FDMI, and RSCN Databases
-
Discovering SCSI Targets
-
Configuring FICON
-
Advanced Features and Concepts
-
-
Security
-
Configuring FIPS
-
Configuring Users and Common Roles
-
Configuring SNMP
-
Configuring RADIUS and TACACS+
-
Configuring IPv4 Access Control Lists
-
Configuring Certificate Authorities and Digital Certificates
-
Configuring IPsec Network Security
-
Configuring FC-SP and DHCHAP
-
Configuring Port Security
-
Configuring Fabric Binding
-
- IP Services
- Intelligent Storage Services
- Network and Switch Monitoring
- Traffic Management
- Troubleshooting
-
Launching Fabric Manager in Cisco SAN-OS Releases Prior to 3.2(1)
-
Cisco Fabric Manager Unsupported Feature List
-
Interface Nonoperational Reason Codes
-
Managing Cisco FabricWare
-
Configuration Limits for Cisco MDS SAN-OS Release 3.1(x) and 3.2(x)
-
 Feedback
Table Of Contents
Real-Time Performance Monitoring
Device Manager Real-Time Performance Monitoring
Fabric Manager Real-Time ISL Statistics
Historical Performance Monitoring
Creating a Flow with Performance Manager
Creating a Collection with Performance Manager
Using the Performance Manager Configuration Wizard
Viewing Performance Manager Reports
Performance Tables and Details Graphs
Viewing Performance of Host-Optimized Port Groups
Viewing Performance Manager Events
Generating Top10 Reports in Performance Manager
Generating Top10 Reports Using Scripts
Exporting Data Collections to XML Files
Exporting Data Collections in Readable Format
Configuring Performance Manager for Use with Cisco Traffic Analyzer
Performance Monitoring
Cisco Fabric Manager and Device Manager provide multiple tools for monitoring the performance of the overall fabric, SAN elements, and SAN links. These tools provide real-time statistics as well as historical performance monitoring.
This chapter contains the following sections:
•
Real-Time Performance Monitoring
•
Real-Time Performance Monitoring
Real-time performance statistics are a useful tool in dynamic troubleshooting and fault isolation within the fabric. Real-time statistics gather data on parts of the fabric in user-configurable intervals and display these results in Fabric Manager and Device Manager.
Device Manager Real-Time Performance Monitoring
Device Manager provides an easy tool for monitoring ports on the Cisco MDS 9000 Family switches. This tool gathers statistics at a configurable interval and displays the results in tables or charts. These statistics show the performance of the selected port in real-time and can be used for performance monitoring and troubleshooting. For a selected port, you can monitor any of a number of statistics including traffic in and out, errors, class 2 traffic, and FICON data. You can set the polling interval from ten seconds to one hour, and display the results based on a number of selectable options including absolute value, value per second, and minimum or maximum value per second.
Device Manager checking for oversubscription on the host-optimized four-port groups on relevant modules. Right-click the port group on a module and choose Check Oversubscription from the pop-up menu.
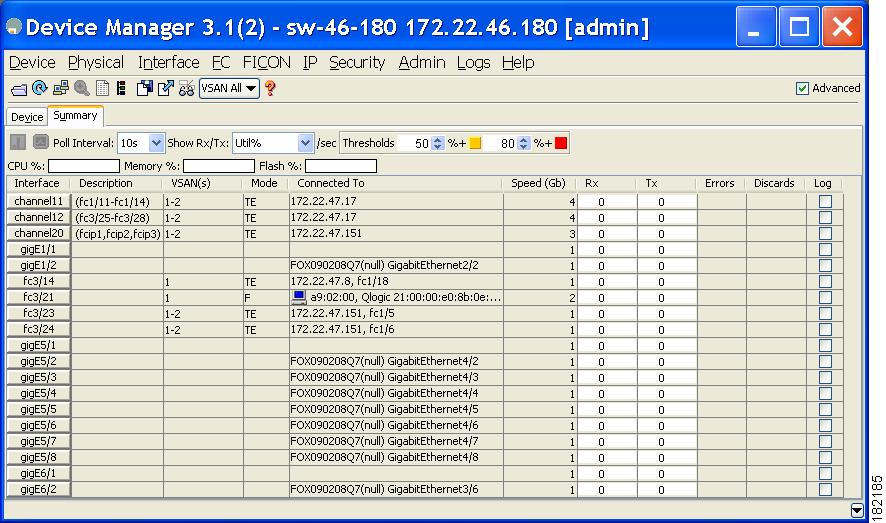
Device manager provides two performance views, the Summary View tab, and the configurable monitor option per port.
To configure the summary view in Device Manager, follow these steps:
Step 1
You see all of the active ports on the switch, as well as the configuration options available from the Summary view shown in Figure 60-1.
Figure 60-1 Device Manager Summary Tab
Step 2
Step 3
Step 4
Note that you can also display percent utilization for a single port by selecting the port and clicking the Monitor Selected Interface Traffic Util % icon.
Step 5
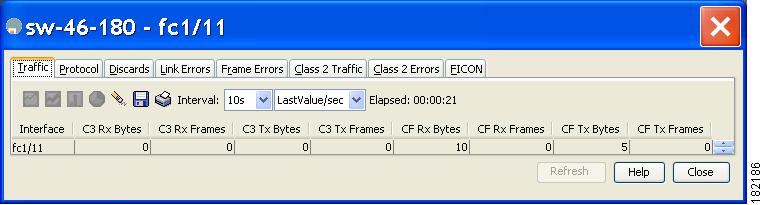
The configurable monitor per port option gives statistics for in and out traffic on that port, errors, class 2 traffic and other data that can be graphed over a period of time to give a real-time view into the performance of the port.
To configure per port monitoring using Device Manager, follow these steps:
Step 1
Step 2
You see the port real-time monitor dialog box shown in Figure 60-2.
Figure 60-2 Device Manager Monitor Dialog Box
Step 3
Step 4
Tip
Fabric Manager Real-Time ISL Statistics
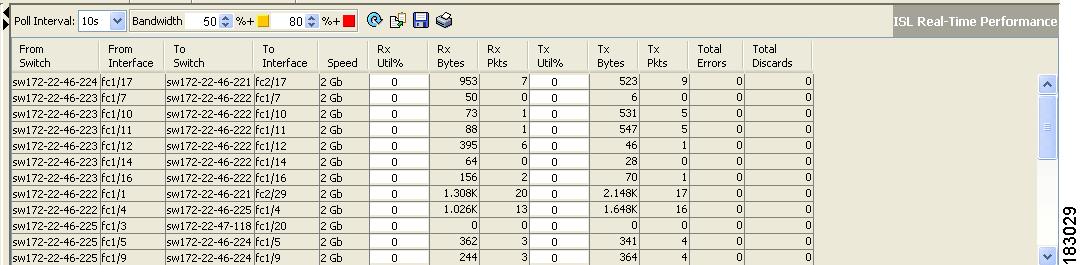
You can configure Fabric Manager to gather ISL statistics in real time. These ISL statistics include receive and transmit utilization, bytes per second, as well as errors and discards per ISL.
To configure ISL statistics using Fabric Manager, follow these steps:
Step 1
You see any ISL statistics in the Information pane (see Figure 60-3).
Figure 60-3 ISL Performance in Real Time
Step 2
Step 3
The table shown updates each polling interval to show the statistics for all configured ISLs in the fabric.
Step 4
Historical Performance Monitoring
Performance Manager gathers network device statistics historically and provides this information graphically using a web browser. It presents recent statistics in detail and older statistics in summary. Performance Manager also integrates with external tools such as Cisco Traffic Analyzer.
See the "Performance Manager Architecture" section on page 8-1 for an overview of Performance Manager.
Creating a Flow with Performance Manager
Performance Manager has a Flow Configuration Wizard that steps you through the process of creating host-to-storage, storage-to-host, or bidirectional flows. See the "Flow Statistics Configuration" section on page 8-3 for information on creating flows.
Creating a Collection with Performance Manager
The Performance Manager Configuration Wizard steps you through the process of creating collections using configuration files. Collections are defined for one or all VSANs in the fabric. Collections can include statistics from the SAN element types described in Table 60-1.
Using Performance Thresholds
The Performance Manager Configuration Wizard allows you to set up two thresholds that trigger events when the monitored traffic exceeds the percent utilization configured. These event triggers can be set as either Critical or Warning events that are reported on the Fabric Manager web client Events browser page.
You must choose either absolute value thresholds or baseline thresholds that apply to all transmit or receive traffic defined in the collection. Click the Use absolute values radio button on the last screen of the Performance Manager Configuration Wizard to configure thresholds that apply directly to the statistics gathered. These statistics, as a percent of the total link capacity, are compared to the percent utilization configured for the threshold type. If the statistics exceed either configured threshold, an event is shown on the Fabric Manager web client Events tab.
As an example, the collection has absolute value thresholds set for 60% utilization (for warning) and 80% utilization (for critical). If Performance Manager detects that the traffic on a 1-Gigabit link in its collection exceeds 600 Mbps, a warning event is triggered. If the traffic exceeds 800 Mbps, a critical event is triggered.
Baseline thresholds are defined for a configured time of day or week (1 day, 1 week, or 2 weeks). The baseline is created by calculating the average of the statistical results for the configured time each day, week, or every 2 weeks. Table 60-2 shows an example of the statistics used to create the baseline value for a collection defined at 4 pm on a Wednesday.
Baseline thresholds create a threshold that adapts to the typical traffic pattern for each link for the same time window each day, week, or every 2 weeks. Baseline thresholds are set as a percent of the average (110% to 500%), where 100% equals the calculated average.
As an example, a collection is created at 4 pm on Wednesday, with baseline thresholds set for 1 week, at 150% of the average (warning) and 200% of the average (critical). Performance Manager recalculates the average for each link at 4 pm every Wednesday by taking the statistics gathered at that time each Wednesday since the collection started. Using this as the new average, Performance Manager compares each received traffic statistic against this value and sends a warning or critical event if the traffic on a link exceeds this average by 150% or 200% respectively.
Table 60-3 shows two examples of 1-Gigabit links with different averages in our example collection and at what traffic measurements the Warning and Critical events are sent.
Table 60-3 Example of Events Generated for 1-Gigabit Links
400 Mbps
600 Mbps
800 Mbps
200 Mbps
300 Mbps
400 Mbps
Set these thresholds on the last screen of the Collections Configuration Wizard by checking the Send events if traffic exceeds threshold check box.
Using the Performance Manager Configuration Wizard
See the "Creating Performance Collections" section on page 7-50.
Viewing Performance Manager Reports
You can view Performance Manager statistical data using preconfigured reports that are built on demand and displayed in a web browser. These reports provide summary information as well as detailed statistics that can be viewed for daily, weekly, monthly, or yearly results.
Choose Performance > Reports to access Performance Manager reports from Fabric Manager. This opens a web browser window showing the default Fabric Manager web client event summary report. Click the Performance tab to view the Performance Manager reports. Performance Manager begins reporting data ten minutes after the collection is started
Note
Performance Summary
The Performance Summary page presents a dashboard display of the throughput and link utilization for hosts, ISLs, storage, and flows for the last 24-hour period. The summary provides a quick overview of the fabric's bandwidth consumption and highlights any hotspots.
The report includes network throughput pie charts and link utilization pie charts. Use the navigation tree on the left to show summary reports for monitored fabrics or VSANs. The summary displays charts for all hosts, storage elements, ISLs, and flows. Each pie chart shows the percent of entities (links, hosts, storage, ISLs, or flows) that measure throughput or link utilization on each of six predefined ranges. Move the mouse over a pie chart section to see how many entities exhibit that range of statistics. Double-click any pie chart to bring up a table of statistics for those hosts, storage elements, ISLs, or flows.
Performance Tables and Details Graphs
Click Host, Storage, ISL, or Flow to view traffic over the past day for all hosts, storage, ISLs, or flows respectively. A table lists all of the selected entities, showing transmit and receive traffic and errors and discards, if appropriate. The table can be sorted by any column heading. The table can also be filtered by day, week, month, or year. Tables for each category of statistics display average and peak throughput values and provide hot-links to more detailed information.
Clicking a link in any of the tables opens a details page that shows graphs for traffic by day, week, month, and year. If flows exist for that port, you can see which storage ports sent data. The details page also displays graphs for errors and discards if they are part of the statistics gathered and are not zero.
If you double-click a graph on a Detail report, it will launch the Cisco Traffic Analyzer for Fibre Channel, if configured. The aliases associated with hosts, storage devices, and VSANs in the fabric are passed to the Cisco Traffic Analyzer to provide consistent, easy identification.
Viewing Performance of Host-Optimized Port Groups
You can monitor the performance of host-optimized port groups by clicking Performance > End Devices and selecting Port Groups from the Type drop-down list.
Viewing Performance Manager Events
Performance Manager events are viewed through Fabric Manager Web Server. To view problems and events in Fabric Manager Web Server, choose a fabric and then click the Events tab to see a summary or detailed report of the problems and events that have occurred in the selected fabric.
Generating Top10 Reports in Performance Manager
You can generate historical Top10 reports that can be saved for later review. These reports list the entities from the data collection, with the most active entities appearing first. This is a static, one-time only report that generates averages and graphs of the data collection as a snapshot at the time the report is generated.
Tip
These Top10 reports differ from the other monitoring tables and graphs in Performance Manager in that the other data is continuously monitored and is sortable on any table column. The Top10 reports are a snapshot view at the time the report was generated.
Note
See the "Creating a Custom Report Template" section on page 7-33 for information on creating a Top10 report.
Generating Top10 Reports Using Scripts
You can generate Top10 reports manually by issuing the following commands:
•
"/<user_directory>/.cisco_mds9000/bin/pm.sh display pm/pm.xml <output_directory>"•
"c:\Program Files\Cisco Systems\MDS 9000\bin\pm.bat display pm\pm.xml
<output_directory>"
On UNIX, you can automate the generation of the Top10 reports on your Fabric Manager Server host by adding the following cron entry to generate the reports once an hour:
0 * * * * /<user_directory>/.cisco_mds9000/bin/pm.sh display pm/pm.xml <output_directory>If your crontab does not run automatically or Java complains about an exception similar to Example 60-1, you need to add "-Djava.awt.headless=true" to the JVMARGS command in /<user_directory>/.cisco_mds9000/bin/pm.sh.
Example 60-1 Example Java Exception
in thread "main" java.lang.InternalError Can't connect to X11 window server using '0.0' as
the value of the DISPLAY variable.
Exporting Data Collections to XML Files
The RRD files used by Performance Manager can be exported to a freeware tool called rrdtool. The rrd files are located in pm/db on the Fabric Manager Server. To export the collection to an XML file, enter the following command at the operating system command-line prompt:
/bin/pm.bat xport xxx yyyIn this command, xxx is the RRD file and yyy is the XML file that is generated. This XML file is in a format that rrdtool is capable of reading with the command:
rrdtool restore filename.xml filename.rrdYou can import an XML file with the command:
bin/pm.bat pm restore <xmlFile> <rrdFile>This reads the XML export format that rrdtool is capable of writing with the command:
rrdtool xport filename.xml filename.rrd.The pm xport and pm restore commands can be found on your Fabric Manager Server at bin\PM.bat for Windows platforms or bin/PM.sh on UNIX platforms. For more information on the rrdtool, refer to the following website: http://www.rrdtool.org.
Exporting Data Collections in Readable Format
Cisco MDS SAN-OS Release 2.1(1a) introduces the ability to export data collections in comma-separated format (CSV). This format can be imported to various tools, including Microsoft Excel. You can export these readable data collections either from the Fabric Manager Web Server menus or in batch mode from the command line on Windows or UNIX. Using Fabric Manager Web Server, you can export one file. Using batch mode, you can export all collections in the pm.xml file.
Note
To export data collections to Microsoft Excel using Fabric Manager Web Server, follow these steps:
Step 1
You see the overview table.
Step 2
Step 3
You see the Excel chart for that entity in a pop-up window.
To export data collections using command-line batch mode, follow these steps:
Step 1
Step 2
Step 3
When you open this exported file in Microsoft Excel, the following information displays:
•
•
•
•
Configuring Performance Manager for Use with Cisco Traffic Analyzer
Performance Manager works in conjunction with the Cisco Traffic Analyzer to allow you to monitor and manage the traffic on your fabric. Using Cisco Traffic Analyzer with Performance Manager requires the following components:
•
•
•
To configure Performance Manager to work with the Cisco Traffic Analyzer, follow these steps:
Step 1
Step 2
•
•
•
Step 3
a.
b.
http://<ip address>:<port number>where:
ip address is the address of the management workstation on which you have installed the Cisco Traffic Analyzer, and
:port number is the port that is used by Cisco Traffic Analyzer (the default is :3000).
c.
d.
e.
D:\<directory>\ntop.batwhere:
D: is the drive letter for the disk drive where the Cisco Traffic Analyzer is installed, and
directory is the directory containing the ntop.bat file.
f.
Step 4
Step 5
a.
b.
c.
http://<ip address>/<directory>where:
ip address is the address of the management workstation on which you have installed the Cisco Traffic Analyzer, and directory is the path to the directory where the Cisco Traffic Analyzer is installed.
d.
e.
f.
Note
Step 6
Note
Step 7
Note
Note
For information on viewing and interpreting your Cisco Traffic Analyzer data, refer to the Cisco MDS 9000 Family Port Analyzer Adapter 2 Installation and Configuration Note.For performance drill-down, Fabric Manager Server can launch the Cisco Traffic Analyzer in-context from the Performance Manager graphs. The aliases associated with hosts, storage devices, and VSANs are passed to the Cisco Traffic Analyzer to provide consistent, easy identification.