Cisco MDS 9000 Family Fabric Manager Configuration Guide, Release 3.4(1a)
Configuring System Message Logging

Table Of Contents

Configuring System Message Logging

About System Message Logging

System Message Logging Configuration

Message Logging Initiation

Console Severity Level

Module Logging

Log Files

System Message Logging Servers

Verifying Syslog Servers from Fabric Manager Web Server

Outgoing System Message Logging Server Facilities

Viewing Logs from Fabric Manager Web Server

Viewing Logs from Device Manager

Default Settings


Configuring System Message Logging


This chapter describes how to configure system message logging on Cisco MDS 9000 Family switches. It includes the following sections:

About System Message Logging

System Message Logging Configuration

Default Settings

About System Message Logging

You can monitor system messages by clicking the Events tab on Fabric Manager or by choosing Logs > Events >  Current on Device Manager. You can also monitor system messages remotely by accessing the switch through Telnet, SSH, or the console port, or by viewing the logs on a system message logging server.


Note When the switch first initializes, the network is not connected until initialization completes. Therefore, messages are not redirected to a system message logging server for a few seconds.


Log messages are not saved across system reboots. However, a maximum of 100 log messages with a severity level of critical and below (levels 0, 1, and 2) are saved in NVRAM.

Table 53-1 describes some samples of the facilities supported by the system message logs.

Table 53-1 Internal Logging Facilities 

Facility Keyword
Description
Standard or Cisco MDS Specific

acl

ACL manager

Cisco MDS 9000 Family specific

all

All facilities

Cisco MDS 9000 Family specific

auth

Authorization system

Standard

authpriv

Authorization (private) system

Standard

bootvar

Bootvar

Cisco MDS 9000 Family specific

callhome

Call Home

Cisco MDS 9000 Family specific

cron

Cron or at facility

Standard

daemon

System daemons

Standard

fcc

FCC

Cisco MDS 9000 Family specific

fcdomain

fcdomain

Cisco MDS 9000 Family specific

fcns

Name server

Cisco MDS 9000 Family specific

fcs

FCS

Cisco MDS 9000 Family specific

flogi

FLOGI

Cisco MDS 9000 Family specific

fspf

FSPF

Cisco MDS 9000 Family specific

ftp

File Transfer Protocol

Standard

ipconf

IP configuration

Cisco MDS 9000 Family specific

ipfc

IPFC

Cisco MDS 9000 Family specific

kernel

Kernel

Standard

local0 to local7

Locally defined messages

Standard

lpr

Line printer system

Standard

mail

Mail system

Standard

mcast

Multicast

Cisco MDS 9000 Family specific

module

Switching module

Cisco MDS 9000 Family specific

news

USENET news

Standard

ntp

NTP

Cisco MDS 9000 Family specific

platform

Platform manager

Cisco MDS 9000 Family specific

port

Port

Cisco MDS 9000 Family specific

port-channel

PortChannel

Cisco MDS 9000 Family specific

qos

QoS

Cisco MDS 9000 Family specific

rdl

RDL

Cisco MDS 9000 Family specific

rib

RIB

Cisco MDS 9000 Family specific

rscn

RSCN

Cisco MDS 9000 Family specific

securityd

Security

Cisco MDS 9000 Family specific

syslog

Internal system messages

Standard

sysmgr

System manager

Cisco MDS 9000 Family specific

tlport

TL port

Cisco MDS 9000 Family specific

user

User process

Standard

uucp

UNIX-to-UNIX Copy Program

Standard

vhbad

Virtual host base adapter daemon

Cisco MDS 9000 Family specific

vni

Virtual network interface

Cisco MDS 9000 Family specific

vrrp_cfg

VRRP configuration

Cisco MDS 9000 Family specific

vrrp_eng

VRRP engine

Cisco MDS 9000 Family specific

vsan

VSAN system messages

Cisco MDS 9000 Family specific

vshd

vshd

Cisco MDS 9000 Family specific

wwn

WWN manager

Cisco MDS 9000 Family specific

xbar

Xbar system messages

Cisco MDS 9000 Family specific

zone

Zone server

Cisco MDS 9000 Family specific


Table 53-2 describes the severity levels supported by the system message logs.

Table 53-2 Error Message Severity Levels 

Level Keyword
Level
Description
System Message Definition

emergencies

0

System unusable

LOG_EMERG

alerts

1

Immediate action needed

LOG_ALERT

critical

2

Critical conditions

LOG_CRIT

errors

3

Error conditions

LOG_ERR

warnings

4

Warning conditions

LOG_WARNING

notifications

5

Normal but significant condition

LOG_NOTICE

informational

6

Informational messages only

LOG_INFO

debugging

7

Debugging messages

LOG_DEBUG


Note Refer to the Cisco MDS 9000 Family System Messages Reference for details on the error log message format.


System Message Logging Configuration

System logging messages are sent to the console based on the default (or configured) logging facility and severity values.

This sections includes the following topics:

Message Logging Initiation

Console Severity Level

Module Logging

Log Files

System Message Logging Servers

Verifying Syslog Servers from Fabric Manager Web Server

Viewing Logs from Fabric Manager Web Server

Message Logging Initiation

You can disable logging to the console or enable logging to a given Telnet or SSH session.

When you disable or enable logging to a console session, that state is applied to all future console sessions. If you exit and log in again to a new session, the state is preserved.

When you enable or disable logging to a Telnet or SSH session, that state is applied only to that session. If you exit and log in again to a new session, the state is not preserved.

To enable or disable the logging state for a Telnet or SSH session using Fabric Manager, follow these steps:


Step 1 Select a switch in the Fabric pane.

Step 2 Expand Switches, expand Events and select SysLog in the Physical Attributes pane.

You see the SysLog information in the Information pane.

Step 3 Click the Switch Logging tab.

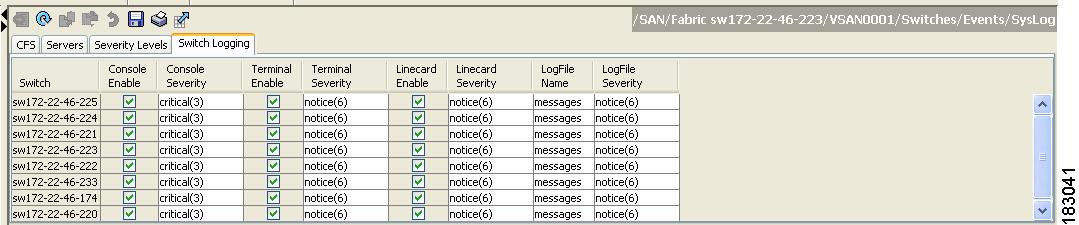
You see the switch information shown in Figure 53-1.

Figure 53-1 Switch Logging Tab in Fabric Manager

Step 4 Select a switch in the Information pane.

Step 5 Check (enable) or uncheck (disable) the Console Enable check box.

Step 6 Click the Apply Changes icon.


Console Severity Level

When logging is enabled for a console session (default), you can configure the severity levels of messages that appear on the console. The default severity for console logging is 2 (critical).


Tip The current critical (default) logging level is maintained if the console baud speed is 9600 baud (default). All attempts to change the console logging level generates an error message. To increase the logging level (above critical), you must change the console baud speed to 38400 baud.


.

To configure the severity level for a logging facility using Fabric Manager, follow these steps:


Step 1 Select a switch in the Fabric pane.

Step 2 Expand Switches, expand Events and select SysLog in the Physical Attributes pane.

You see the SysLog information in the Information pane.

Step 3 Click the Switch Logging tab.

You see the switch information shown in Figure 53-2.

Figure 53-2 Switch Logging Tab in Fabric Manager

Step 4 Select a switch in the Information pane.

Step 5 Select a severity level from the Console Severity drop-down list in the row for that switch.

Step 6 Click the Apply Changes icon.


Module Logging

By default, logging is enabled at level 7 for all modules. You can enable or disable logging for each module at a specified level.

To configure the severity level for a logging facility, follow these steps:


Step 1 In Fabric Manager, expand Switches, expand Events and select SysLog in the Physical Attributes pane.

In Device Manager, choose Logs > Syslog > Setup and click the Switch Logging tab in the Syslog dialog box.

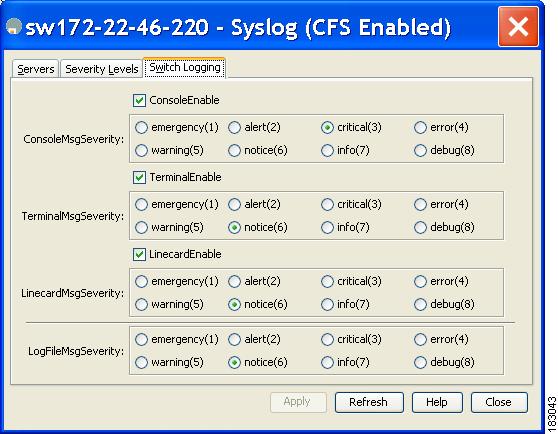
You see the switch information shown in Figure 53-3 or Figure 53-4.

Figure 53-3 Switch Logging Tab in Fabric Manager

Figure 53-4 Switch Logging Tab in Device Manager

Step 2 Check the check boxes where you want message logging to occur (ConsoleEnable, TerminalEnable, LineCardEnable).

Step 3 Choose the message severity threshold from the Console Severity drop-down box for each switch in Fabric Manager (see Figure 53-3) or click the appropriate message severity level radio button in Device Manager (see Figure 53-4).

Step 4 Click the Apply Changes icon in Fabric Manager, or click Apply in Device Manager to save and apply your changes.


Log Files

Logging messages can be saved to a log file. You can configure the name of this file and restrict its size as required. The default log file name is messages. The file name can have up to 80 characters and the file size ranges from 4096 bytes to 4194304 bytes.

To send log messages to a file using Fabric Manager, follow these steps:


Step 1 Select a switch in the Fabric pane.

Step 2 Expand Switches, expand Events and select SysLog in the Physical Attributes pane.

You see the SysLog information in the Information pane.

Step 3 Select a switch in the Information pane.

Step 4 Click the Switch Logging tab.

You see the information in Figure 53-5.

Figure 53-5 Switch Logging Tab in Fabric Manager

Step 5 Enter the name of the log file in the LogFile Name column in the row for that switch.

Step 6 Click the Apply Changes icon.


Note The configured log file is saved in the /var/log/external directory. The location of the log file cannot be changed.


System Message Logging Servers

You can configure a maximum of three system message logging servers.

To send log messages to a UNIX system message logging server, you must configure the system message logging daemon on a UNIX server. Log in as root, and follow these steps:


Step 1 Add the following line to the /etc/syslog.conf file.

local1.debug                    /var/log/myfile.log


Note Be sure to add five tab characters between local1.debug and /var/log/myfile.log. Refer to entries in the /etc/syslog.conf file for further examples.


The switch sends messages according to the specified facility types and severity levels. The local1 keyword specifies the UNIX logging facility used. The messages from the switch are generated by user processes. The debug keyword specifies the severity level of the condition being logged. You can set UNIX systems to receive all messages from the switch.

Step 2 Create the log file by entering these commands at the UNIX shell prompt:

$ touch /var/log/myfile.log
$ chmod 666 /var/log/myfile.log

Step 3 Make sure the system message logging daemon reads the new changes by entering this command:

$ kill -HUP ~cat /etc/syslog.pid~


Note Most tabs in the Information pane for features using CFS are dimmed until you click the CFS tab. The CFS tab shows which switches have CFS enabled and shows the master switch for this feature. Once the CFS tab is click, the other tabs in the Information pane that use CFS are activated.


You can configure a maximum of three syslog servers. One of these syslog servers should be Fabric Manager if you want to view system messages from the Event tab in Fabric Manager.

To configure system message logging servers, follow these steps:
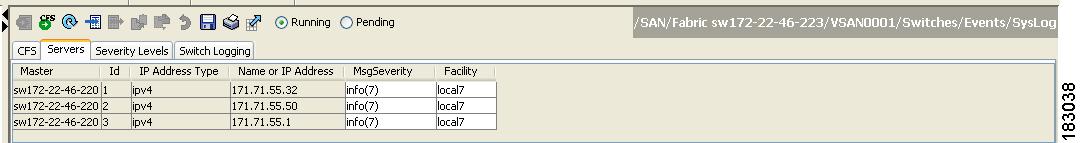

Step 1 In Fabric Manager, Expand Switches, expand Events and select SysLog in the Physical Attributes pane, then click the Servers tab in the Information pane.

Figure 53-6 Servers Tab in Fabric Manager Syslog

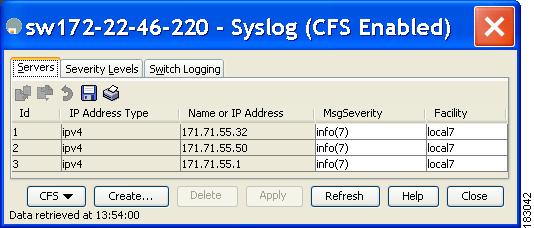
In Device Manager, choose Logs > Syslog > Setup and click the Servers tab in the Syslog dialog box.

Figure 53-7 Servers Tab in Device Manager Syslog

Step 2 Click the Create Row icon in Fabric Manager, or click Create in Device Manager (see Figure 53-7) to add a new syslog server.

Step 3 Enter the name or IP address in dotted decimal notation (for example, 192.168.2.12) of the syslog server in the Name or IP Address field.

Step 4 Set the message severity threshold by clicking the MsgSeverity radio button and set the facility by clicking the Facility radio button.

Step 5 Click the Apply Changes icon in Fabric Manager, or click Create in Device Manager to save and apply your changes.


Device Manager allows you to view event logs on your local PC as well as those on the switch. For a permanent record of all events that occur on the switch, you should store these messages off the switch. To do this the MDS switch must be configured to send syslog messages to your local PC and a syslog server must be running on that PC to receive those messages. These messages can be categorized into four classes:

Hardware—Line card or power supply problems

Link Incidents—FICON port condition changes

Accounting—User change events

Events—All other events


Note You should avoid using PCs that have IP addresses randomly assigned to them by DHCP. The switch continues to use the old IP address unless you manually change it; however the Device Manager prompts you if it does detect this situation. UNIX workstations have a built-in syslog server. You must have root access (or run the Cisco syslog server as setuid to root) to stop the built-in syslog daemon and start the Cisco syslog server.


Verifying Syslog Servers from Fabric Manager Web Server

To verify the syslog servers remotely using Fabric Manager Web Server, follow these steps:


Step 1 Point your browser at the Fabric Manager Web Server. See the "Launching Fabric Manager Web Server" section on page 7-7.

Step 2 Choose Events > Syslog to view the syslog server information for each switch. The columns in the table are sortable.


Outgoing System Message Logging Server Facilities

All system messages have a logging facility and a level. The logging facility can be thought of as where and the level can be thought of as what.

The single system message logging daemon (syslogd) sends the information based on the configured facility option. If no facility is specified, local7 is the default outgoing facility.

The internal facilities are listed in Table 53-1 and the outgoing logging facilities are listed in Table 53-3.

Table 53-3 Outgoing Logging Facilities 

Facility Keyword
Description
Standard or Cisco MDS Specific

auth

Authorization system

Standard

authpriv

Authorization (private) system

Standard

cron

Cron or at facility

Standard

daemon

System daemons

Standard

ftp

File Transfer Protocol

Standard

kernel

Kernel

Standard

local0 to local7

Locally defined messages

Standard (local7 is the default)

lpr

Line printer system

Standard

mail

Mail system

Standard

news

USENET news

Standard

syslog

Internal system messages

Standard

user

User process

Standard

uucp

UNIX-to-UNIX Copy Program

Standard


Viewing Logs from Fabric Manager Web Server

To view system messages remotely using Fabric Manager Web Server, follow these steps:


Step 1 Point your browser at the Fabric Manager Web Server. See the "Launching Fabric Manager Web Server" section on page 7-7.

Step 2 Click the Events tab followed by the Details to view the system messages. The columns in the events table are sortable. In addition, you can use the Filter button to limit the scope of messages within the table.


Viewing Logs from Device Manager

You can view system messages from Device Manager if Device Manager is running from the same workstation as the Fabric Manager Server. Choose Logs > Events > current to view the system messages on Device Manager. The columns in the events table are sortable. In addition, you can use the Find button to locate text within the table.

You can view switch-resident logs even if you have not set up your local syslog server or your local PC is not in the switch's syslog server list. Due to memory constraints, these logs will wrap when they reach a certain size. The switch syslog has two logs: an NVRAM log that holds a limited number of critical and greater messages and a nonpersistent log that contains notice or greater severity messages. Hardware messages are part of these logs.


Note When using the show logging command, output is displayed only when the configured logging levels for the switch are different from the default levels.


Default Settings

Table 53-4 lists the default settings for system message logging.

Table 53-4 Default System Message Log Settings 

Parameters
Default

System message logging to the console

Enabled for messages at the critical severity level.

System message logging to Telnet sessions

Disabled.

Logging file size

4194304.

Log file name

Message (change to a name with up to 200 characters).

Logging server

Disabled.

Syslog server IP address

Not configured.

Number of servers

Three servers.

Server facility

Local 7.