- About This Guide
- Cisco Voice Switch Service Module Introduction
- Cisco Voice Switch Service Module Description
- Configuring VoIP Switching Applications
- Configuring Switches for AAL2 Trunking Applications
- Configuring VXSM Features
- VXSM as a Signaling Gateway
- VXSM as a Transcoding Gateway
- Implementing Lawful Intercept on VXSM
- Configuring Lawful Intercept Support
- Loading and Upgrading VXSM Code Images
- VXSM Troubleshooting
- Media Gateway Clocking
- Collecting Troubleshooting Data
- Troubleshooting Procedures
- Obtaining Information on Current Voice Calls—H.248
VXSM Troubleshooting
This chapter describes how to trouble shoot and resolve known types of problems on the Cisco MGX 8850 VXSM card. The following topics are covered in this chapter:
•![]() Collecting Troubleshooting Data
Collecting Troubleshooting Data
•![]() Obtaining Information on Current Voice Calls—H.248
Obtaining Information on Current Voice Calls—H.248
•![]() Obtaining Information on Current Voice Calls—xGCP
Obtaining Information on Current Voice Calls—xGCP
•![]() Obtaining Information on Active and Emergency Voice Calls
Obtaining Information on Active and Emergency Voice Calls
Collecting Troubleshooting Data
This section provides procedures for collecting troubleshooting data for when a VXSM card fails. These procedures use PXM45, VXSM, RPM-XF and AXSM commands. See Chapter 5, "VXSM CLI Commands" in this document for detailed descriptions of the VXSM CLI commands. Refer to the following documents for descriptions of the PXM45, RPM-XF and AXSM CLI commands:
•![]() Cisco MGX 8850 (PXM1E/PXM45), MGX 8950, and MGX 8830 Command Reference, Release 5.2.
Cisco MGX 8850 (PXM1E/PXM45), MGX 8950, and MGX 8830 Command Reference, Release 5.2.
•![]() Cisco ATM Services (AXSM) Software Configuration Guide and Command Reference for MGX Switches, Release 5.2
Cisco ATM Services (AXSM) Software Configuration Guide and Command Reference for MGX Switches, Release 5.2
•![]() Cisco MGX Route Processor Module (RPM-XF) Installation and Configuration Guide, Release 4
Cisco MGX Route Processor Module (RPM-XF) Installation and Configuration Guide, Release 4
Table 11-1 shows the initial steps you can take using CLI commands to trouble shoot any problem on the VXSM. These steps enable you to collect data and failure reports.
Troubleshooting Procedures
Table 11-2 provides a list of known types of problems, their possible causes, and their possible solutions. The problems are listed alphabetically by topic.
Obtaining Information on Current Voice Calls—H.248
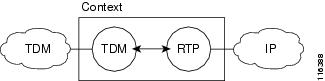
With H.248, calls are modeled using a context. A context contains one or more terminations. In Release 5, a context can contain at most two terminations. In this release, there are two types of terminations: TDM (also referred to as SCN or Switched Circuit Network) and RTP.
A basic VoIP call leg is modeled as a context containing one TDM termination and one RTP termination.
Figure 11-1 VoIP Call Leg Model
.
A TDM hairpin call is modeled as a context containing two TDM terminations.
Figure 11-2 TDM Hairpin Model
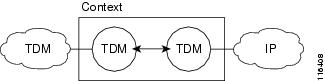
Table 11-3 lists commands for obtaining information about current voice calls on the VXSM.
Examples
The dsph248calls CLI command displays all of the H.248 terminations.
shelf.1.VXSM.a > dsph248calls
TermId TermType Media Codec Vad Ecan
------ -------- -------- ----- ----- ----
1 SCN 'Voice' 'G.711 U' ----- 'Enabled'
8067 RTP 'Voice' 'G.711 U' 'Enabled' -----
2 SCN 'Voice' 'G.711 U' ----- 'Enabled'
8068 RTP 'Voice' 'G.711 U' 'Enabled' -----
The dsph248status -cntxs CLI command displays the status of all H.248 contexts.
shelf.1.VXSM.a > dsph248status -cntxs
=======================================
Status for all contexts
=======================================
Number of active contexts:2
List of contexts
Status of context 4:
Creation date and time:02/03/2004, 17:31:21
Number of terminations in context:2
List of termination IDs:
8068 2
Status of context 3:
Creation date and time:02/03/2004, 17:31:21
Number of terminations in context:2
List of termination IDs:
8067 1
The dsph248status -cntx CLI command displays the status of a particular H.248 context.
shelf.1.VXSM.a > dsph248status -cntx 1
=======================================
Status of context 1
=======================================
Creation date and time: 07/04/2003, 13:55:45
Number of terminations in context: 2
List of terminations:
term_id: 8065, term_type: MG_TERM_TYPE_PDN_IP, term_name: RTP8065
term_id: 3, term_type: MG_TERM_TYPE_SCN, term_name: ds/1/1/3
The dsph248status -term CLI command displays the status of a particular H.248 termination.
shelf.1.VXSM.a > dsph248status -term 1 1 1
==========================================
Status of termination with ID 1
==========================================
Termination type:MG_TERM_TYPE_SCN
Termination name:ds/1/1/1
Termination state:MG_TERM_STATE_INSERVICE
Termination test flag:False
Termination context id:3
Id of profile on termination:0
Number of streams on termination:1
Termination about to be deleted:False
Next state of termination:MG_NEXT_STATE_INSERVICE
Last modified/updated:02/03/2004, 17:31:21
NOTE:This timestamp is not preserved across switchovers.
It is independently generated on each card.
Supported packages:
H248_GENERIC_PKG H248_TDMC_PKG
The dsph248call -term CLI command displays information pertaining to a particular H.248 terminations:
shelf.1.VXSM.a > dsph248call -term 1
Term Id :1
Term Type :SCN
Term Name :ds/1/1/1
connMode :4 ('Send-recv')
loopBackType :1 ('None')
RTP Encapsulation Parameters ...
ssrc :424285698 (0x194a1602)
RTCP Enable :TRUE
dspCodec :2 ('G.711 U')
packetPeriod :'20 ms'
vadMode :2 ('Enabled')
vadThreshold :-38
vadHangoverTime :250 ms
ecan enabled :'Enabled'
ecanTail :128 ms
ecanFlags :0x0
Type <CR> to continue, Q<CR> to stop:
upspeedCodec :2 ('G.711 U')
jitterMode :2 ('Adaptive')
jitterMinDelay :5 ms
jitterMaxDelay :100 ms
jitterNomDelay :30 ms
jitterFaxNomDelay :0 ms
txGain :0
rxGain :0
nsePayloadType :100 (0x64)
nteTxPayloadType :0 (0x0)
nteRxPayloadType :0 (0x0)
profileType :0
profileNum :0
hsRedCount :0
lsRedCount :0
toneDetect :0x3c32
toneDetectBitmap :0x0
Type <CR> to continue, Q<CR> to stop:
digitDetect :1 ('DTMF')
digitRelayMethod :1 ('Send as Voice')
icsEnable :0 (FALSE)
nx64FramePattern :0 (CRML_PATTERN_NONE)
trunkMode :0 (CRML_MODE_NONE)
nx64FrameFlagCnt :0
dtmfTransport :0 (FALSE)
trunkCond :0 (FALSE)
The dsph248cnts -phyterm command displays counters corresponding to all of the H.248 physical (TDM or SCN) terminations on the VXSM card:
shelf.1.VXSM.a > dsph248cnts -phyterm
=================================================================
All Gateway Physical Terminations Statistic
DS1:DS0 Termination Termination Num of Num of Num of OOS Num of OOS
line Id Name Add Failure from MGC from OAM
============ =========== ============ ====== ======= ==========
1.1.1.2.3:1 361 DS/1/16/1 1 0 0 0
1.1.1.2.3:2 362 DS/1/16/2 0 0 0 0
......
1.1.1.2.3:23 383 DS/1/16/23 0 0 0 0
1.1.1.2.3:24 384 DS/1/16/24 1 0 0 0
The dsph248cnt -ephterm command displays counters corresponding to all of the H.248 ephemeral (such as RTP) terminations on the VXSM card:
shelf.1.VXSM.a > dsph248cnt -ephterm
=========================================================
Gateway Ephemeral Terminations Statistic
=========================================================
Num of Add Commands : 2
Num of Commands Failure : 0
Obtaining Information on Current Voice Calls—xGCP
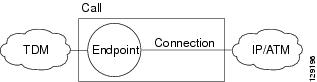
The Current Voice xGCP call (xGCP) model is based upon endpoints and connections. Connections have modes. Supported modes include Receive-Only, Send/Receive, Inactive, Loopback, and Continuity Test. The connection model is shown in Figure 11-3.
Figure 11-3 xGCP Connection Model
To obtain information regarding the status of TGCP activities. Use the PXM and VXSM commands as follows. The PXM CLI commands in Table 11-4 display the list of events and errors logged by the active and standby VXSM cards, starting with the most recent event or error.
Use the VXSM CLI commands in Table 11-5 to monitor the basic operation of the currently-active VXSM card and to check if calls are being processed after switchover:
•![]() dspxgcpcnts—Displays a static summary of the number of TGCP commands that failed/succeeded on the ACTV card at that moment; executing this command a few times will give the user an idea whether commands are being sent to the VXSM and whether VXSM is processing those commands.
dspxgcpcnts—Displays a static summary of the number of TGCP commands that failed/succeeded on the ACTV card at that moment; executing this command a few times will give the user an idea whether commands are being sent to the VXSM and whether VXSM is processing those commands.
•![]() dspxgcpdetailcnts—Displays number of times a TGCP command is received/sent/retransmitted.
dspxgcpdetailcnts—Displays number of times a TGCP command is received/sent/retransmitted.
•![]() dspxgcpendpts <endpt-name>—Displays all the endpt state if connection is present on that endpoint.
dspxgcpendpts <endpt-name>—Displays all the endpt state if connection is present on that endpoint.
•![]() dspxgcpendpts *—Can be used to display all.
dspxgcpendpts *—Can be used to display all.
•![]() -dspxgcpendptcons <endpt-name>—Displays the connection ID. Call ID of the connection on that endpoint.
-dspxgcpendptcons <endpt-name>—Displays the connection ID. Call ID of the connection on that endpoint.
Obtaining Information on Active and Emergency Voice Calls
This section describes how to obtain information on active and emergency calls on the Cisco MGX 8850 VXSM card.
With H.248, display counters are used to obtain information about the number of active and emergency voice calls that have been placed during a specified period of time. These counters can be displayed at gateway level, virtual gateway (VGW), and line level interface.
In xGCP, display counters are used to obtain information about the number of active voice calls only. These counters are configured at gateway level and line level interface.
Table 11-6 lists commands for obtaining information about active and emergency voice calls on the VXSM.
Example
The dspcallcnt -gw command displays number of active and emergency calls per gateway, as shown in the following example:
M8850_NY.9.VXSM.a > dspcallcnt -gw
======================================================
Call Count for GW
======================================================
Number of Active Calls : 0
Number of Emergency Calls : 0
To get the active and emergency call information from the SNMP network manager, use the getmany -v1 command. An internal MIB table (cmgcallStatsTable) contains mandatory endpoint configuration information for all calls. The objects in the internal table, cmgcallActiveCalls and cmgcallEmergencyCalls, are used to identify the active and emergency calls.
Bearer Tracing Feature
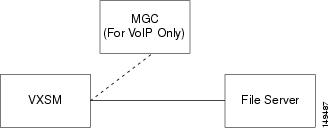
The VXSM card includes a useful troubleshooting tool that has the ability to collect fundamental information about the content of bearer streams and to transmit the information in real-time to an external file server for offline analysis. This feature, known as Bearer Tracing, involves the VXSM card, the Media Gateway Controller for VoIP applications, and a file server to receive the bearer traces (Figure 11-4).
Figure 11-4 Bearer Tracing Major Elements
Within the VXSM card, the Bearer Tracing feature is performed in the voice module (Figure 11-5).
Figure 11-5 VXSM Bearer Tracing High-Level Function
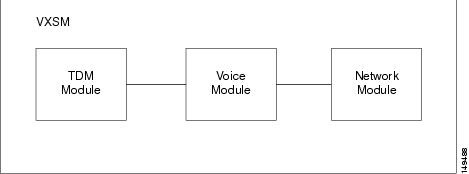
The Voice Module contains a number of probes on the card that are situated at various points in the path of the bearer stream through the card. There are 10 probes (Figure 11-6).
Figure 11-6 Bearer Trace Probe Locations


Note ![]() The numbering used to identify the probes in the diagram above is the same numbering that the VXSM Bearer Tracing command use to identify the probes.
The numbering used to identify the probes in the diagram above is the same numbering that the VXSM Bearer Tracing command use to identify the probes.
The following probes can be traced on a TDM-IP call:
1 = PCM Input from TDM network
2 = PCM Output to the TDM network
3 = Input from the packet network
4 = Output to the packet network
5 = Output from echo canceller (Ecan/Sout)
6 = Voice Playout Unit - Jitter buffer events
7 = T.38 information at the Decoder—level 1
8 = T.38 information at the Decoder—level 2
9 = DIM Message Trace to and from DSP
10 = Voice Playout Unit—segments
The following probes can be traced on a TDM-TDM call:
1 = PCM Input from TDM network
2 = PCM Output to the TDM network
5 = Output from echo canceller (Ecan/Sout)
On an IP-IP call, the probes that can be traced depend on the type of call. In Transcoding mode, the following probes are traced:
3 = Input from the packet network
4 = Output to the packet network
9 = DIM message trace to and from DSP
10 = Voice Playout Unit—segments
In fast routing and transparent mode, the following probes are traced:
3 = Input from the packet network
4 = Output to the packet network
Bearer Trace Operation
Step 1 ![]() To be able to collect bearer traces on a endpoint, VXSM must:
To be able to collect bearer traces on a endpoint, VXSM must:
a. ![]() Have an active bearer channel
Have an active bearer channel
In VoIP—A call must be set up
or
In AAL2—An AAL2 nailed up connection must be added by adding a CID
And
b. ![]() Be connected to a computer where the trace files are to be stored (referred to as a fileserver, server, or network).
Be connected to a computer where the trace files are to be stored (referred to as a fileserver, server, or network).
Note ![]() If a call agent is used, the same machine can be a call agent and a file server at the same time.
If a call agent is used, the same machine can be a call agent and a file server at the same time.
Step 2 ![]() To start collecting bearer traces:
To start collecting bearer traces:
a. ![]() If bearer tracing is set up and activated on an endpoint that has an active bearer channel, tracing starts immediately, otherwise, it starts as soon as a call (VoIP) or a connection (AAL2) is activated on the endpoint.
If bearer tracing is set up and activated on an endpoint that has an active bearer channel, tracing starts immediately, otherwise, it starts as soon as a call (VoIP) or a connection (AAL2) is activated on the endpoint.
b. ![]() If bearer tracing is set up and not activated on an endpoint, tracing must be initiated manually even if there is an active call/connection on the endpoint.
If bearer tracing is set up and not activated on an endpoint, tracing must be initiated manually even if there is an active call/connection on the endpoint.
Step 3 ![]() To stop collecting bearer traces:
To stop collecting bearer traces:
a. ![]() End the active call/connection on the endpoint, or
End the active call/connection on the endpoint, or
b. ![]() Manually stop the trace
Manually stop the trace
Note ![]() As long as the trace is not stopped, VXSM continues to send trace samples to the file server
As long as the trace is not stopped, VXSM continues to send trace samples to the file server
Step 4 ![]() VXSM generates a trace filename each time a trace is started and active on an endpoint. The filename is based on the probe type, the endpoint index and on specific user input that constitutes the file signature.
VXSM generates a trace filename each time a trace is started and active on an endpoint. The filename is based on the probe type, the endpoint index and on specific user input that constitutes the file signature.
Note ![]() The file signature could be set to remain the same from one trace session to another or, in some cases; it could be set to be specific to each session (see Trace Files).
The file signature could be set to remain the same from one trace session to another or, in some cases; it could be set to be specific to each session (see Trace Files).
If the connection to the file server cannot be established, bearer tracing is deactivated automatically. To reactivate bearer tracing:
a. ![]() Fix the network issues that prevent the network connection to be established.
Fix the network issues that prevent the network connection to be established.
And
b. ![]() Restart the call on the endpoint, or stop then start the trace manually.
Restart the call on the endpoint, or stop then start the trace manually.
Note ![]() All trace probes can be activated on the same endpoint. Each probe initiates its own trace stream to the network and writes its data to its own file except for VPU traces where VPU event traces and VPU segment traces are written to the same file.
All trace probes can be activated on the same endpoint. Each probe initiates its own trace stream to the network and writes its data to its own file except for VPU traces where VPU event traces and VPU segment traces are written to the same file.
Note ![]() The level 1 and level 2 T.38 probes (7 and 8) cannot be activated at the same time. These probes also need PCM trace to be on.
The level 1 and level 2 T.38 probes (7 and 8) cannot be activated at the same time. These probes also need PCM trace to be on.
Note ![]() The total number of probes activated at the same time is limited, but the amount of data transferred per probe is not limited.
The total number of probes activated at the same time is limited, but the amount of data transferred per probe is not limited.
Note ![]() Ensure that there is enough free space on the file server to store the trace files generated by VXSM. For an estimate of the required space per trace, see the "Per Trace Bandwidth and File Size Requirements" section.
Ensure that there is enough free space on the file server to store the trace files generated by VXSM. For an estimate of the required space per trace, see the "Per Trace Bandwidth and File Size Requirements" section.
Bearer Trace Types
Bearer Traces are transmitted to the server as files with file names that indicate the probe type, the endpoint being probed and, optionally, a timestamp. Files are assigned names by the Bearer Tracing feature that indicate these items. For more details on file naming see Trace Files.
PCM Traces
There are 2 PCM traces, pcmin and pcmout, to and from the voice network, respectively. In CLI, pcmin Probe 1 collects pcmin and probe 2 collects pcmout. The pcmin trace files generated by VXSM have the .pcmin prefix and .pcm suffix, pcmout trace file have the .pcmout prefix and the .pcm suffix.
The format for a PCM trace is either 8-bit PCM A-law or 8-bit PCM mu-law, depending on the physical interface being used. VXSM currently ties the PCM encoding to the physical interface.
Echo Canceller Traces—Sout
A sout trace is collected from the output of the echo canceller and is collected by probe 5.
The format of the sout stream is a big-endian signed 16-bit linear format. The value 32757 represents full scale. The sout trace file generated by VXSM has the sout prefix and .pcm suffix
The sout stream is synchronized to the PCM In and PCM Out signals.
The sout tracing cannot be enabled if the Ecan is not enabled on the given connection
Packet Traces
The packet traces are collected at the input and output of the packet IO interface.
The current implementation focuses on RTP traces. The packet trace is in raw IP pcap format that is readable by packet sniffers such as Ethereal.
Voice Playout Unit Traces
There are two type of voice playout unit (VPU) traces:
•![]() VPU event on probe 6—VPU Event trace (vpevt) reports jitter-related events when they happen.
VPU event on probe 6—VPU Event trace (vpevt) reports jitter-related events when they happen.
•![]() VPU segment on probe 10—The Voice Playout Unit (jitter buffer) segment trace (vpseg) reports jitter-related data every segment (that is, every 5 ms).
VPU segment on probe 10—The Voice Playout Unit (jitter buffer) segment trace (vpseg) reports jitter-related data every segment (that is, every 5 ms).
Although there are 2 types of VPU traces, only one file is created on the server for both traces. The vpu file generated by VXSM has the vpu prefix and the vpu suffix.
T.38 Traces
When a fax call is active using T.38 fax relay, traces can be gathered from the Fax module within the DSP. The user can select to gather 2 levels of traces:
•![]() Level 1—Basic events to decipher T.30 and other signaling progress
Level 1—Basic events to decipher T.30 and other signaling progress
•![]() Level 2—Proprietary Telogy format
Level 2—Proprietary Telogy format
When enabling the tracing functionality for T.38 the user can chose to monitor any DS0 in a DS1 or a specific DS0 in a DS1. When monitoring any DS0 in a DS1 the first fax relay session activated on the monitored span will have tracing enabled. User can choose to monitor any DS0 in a DS1 by choosing a special DS0 attribute in the addbearertraceendpt CLI.
A total of 10 simultaneous DS0 can be monitored at any one time. In addition to this, a maximum number of 10 trace sessions can be activated simultaneously.
The file containing the T38 traces will have a header that provides some information about the fax relay session. It contains ds1 and ds0 information, tcid/dsp information, and the timestamp indicating when the file was created.
In CLI, the T38 level l trace 1is activated by probe 8 and T38 level 2 trace is activated by probe 7.
The file created on the server for T38 level 1 trace has the suffix DBG1.
The file created on the server for T38 level 2 trace has the suffix DBG2.
Both level 1 and level 2 traces have the prefix FaxRelayTrace.
After the filename base is entered by the user, the filename is also appended to the endpoint prefix, followed by the DS0 number.
For example, in the case of FTP where the timestamp is used as a filename base, the filename for a level 1 trace on endpoint 2 ds0 1 is: FaxRelayTrace_022306172604_2_1.DBG1. See Table 11-10 for details.
MSG Traces
Probe 9 collects MSG traces. The message trace file generated by VXSM has the msg prefix and the msg suffix.
Message traces contain the information within DIM traces. MSG Traces are asynchronous and depend on whether or not the activity on the card generates DIM traces.
Bearer Tracing Connectivity
External Interface
VXSM can be connected to the file server either through the control PVC or through the VXSM Ethernet port.
If the control PVC is used, the provisioning of the control PCV needs to include the bandwidth required for the transfer of trace data to the network.
Per Trace Bandwidth and File Size Requirements
Bearer tracing requires that enough bandwidth be available to accommodate the bearer trace traffic data and the transport protocol packet and control overhead. Table 11-7 and Table 11-8 below show the estimate per-trace bandwidth requirements in the case of FTP and TFTP. The file size of the accumulated bearer trace data on the server is also provided so that enough space is set aside for the trace files to be stored in the FTP server. The file size of the trace files is limited only by the free space on the file server. To make sure that trace files have no loss of data, provide enough space on the file server for the trace files.
Bearer Tracing for AAL2 Connections
FTP and TFTP protocols run on an IP network. For Voice over IP, VXSM inherently uses an AAL5 control PVC to communicate with the MGC. The same control PVC can be used to communicate with the external FTP/TFTP server.
Control PVC is not inherent in an AAL2 configuration (for example, AAL2 trunking). To access the IP cloud in such a situation, either a control PVC or the Ethernet console need to be configured. Unless pinging the file server is possible, tracing does not operate.
IPSec and Bearer Tracing
The Bearer Tracing mechanism uses FTP/TFTP connections to transfer the traces to the server. The trace data are carried over the control PVC, which is also used to communicate with MGC. For many solutions, IPSec is used to secure the communication with the MGC over control PVC. In such cases, the FTP/TFTP traffic is bypassed by IPSec to transfer trace data to the bearer tracing server.
Bearer Trace CLI Requirements
Persistency
The operational state of bearer tracing is not saved in disk database. Hence, all the information is lost if the card resets. All the bearer tracing commands are non-MIB commands.
Backward Compatibility
Commands introduced in the PCM tracing functionality in the earlier VXSM releases are no longer functional. They are replaced by the new bearer tracing commands in VXSM Release 5.3.
Bearer Trace Configuration
After a bearer trace or a server profile is added, the only way to change its configuration is by deleting the trace or the server profile and adding it again with the new configuration.
Note ![]() For bearer tracing to occur, there must be a connection between VXSM and the file server. An FTP or TFTP server need to be running on the file server and access permission to the directory (and in the case of TFTP, to the files) must be granted.
For bearer tracing to occur, there must be a connection between VXSM and the file server. An FTP or TFTP server need to be running on the file server and access permission to the directory (and in the case of TFTP, to the files) must be granted.
Note ![]() Before you delete either configuration, make sure that the trace is stopped.
Before you delete either configuration, make sure that the trace is stopped.
Considerations and Limitations
1. ![]() A VXSM card supports up to 32 simultaneous trace sessions.
A VXSM card supports up to 32 simultaneous trace sessions.
2. ![]() A VXSM card supports the following max number of traces per probe type (Table 11-9):
A VXSM card supports the following max number of traces per probe type (Table 11-9):
|
|
|
|---|---|
Pcmin |
5 |
Pcmout |
5 |
Pkt in |
5 |
Pkt out |
5 |
Ecan/Sout |
5 |
VPU |
5 |
MSG |
2 |
3. ![]() Only one trace per DSP core is possible, consequently, adding tracing on an endpoint will fail if the dsp core is found to have tracing enabled for a different endpoint.
Only one trace per DSP core is possible, consequently, adding tracing on an endpoint will fail if the dsp core is found to have tracing enabled for a different endpoint.
4. ![]() Network latencies beyond 20 seconds have an impact on the quality of traces. To avoid loss of data during the trace collection, have the file server on the same LAN segment as VXSM.
Network latencies beyond 20 seconds have an impact on the quality of traces. To avoid loss of data during the trace collection, have the file server on the same LAN segment as VXSM.
5. ![]() Bearer tracing requires about 1 percent of CPU use. For tracing to operate properly, only enable the number of traces that the system CPU use can manage. Also, under a heavy call-rate, there might not be enough CPU bandwidth to accommodate the maximum number of traces.
Bearer tracing requires about 1 percent of CPU use. For tracing to operate properly, only enable the number of traces that the system CPU use can manage. Also, under a heavy call-rate, there might not be enough CPU bandwidth to accommodate the maximum number of traces.
6. ![]() In Packet Trace, to capture events such as DTMF or Tones in a trace file, stop bearer tracing before using the trace file in an offline processing.
In Packet Trace, to capture events such as DTMF or Tones in a trace file, stop bearer tracing before using the trace file in an offline processing.
7. ![]() FTP sessions time out after 30 seconds of inactivity so that dead network connections do not affect the system adversely.
FTP sessions time out after 30 seconds of inactivity so that dead network connections do not affect the system adversely.
8. ![]() All traces must be set up at the same time as there is no provision to set up each one individually.
All traces must be set up at the same time as there is no provision to set up each one individually.
9. ![]() We recommend that bearer traces and T.38 traces are run separately.
We recommend that bearer traces and T.38 traces are run separately.
Configuring the Bearer Tracing Feature
Configuration Summary
The following steps provide a quick summary of the procedure for configuring the Bearer Tracing feature.
Step 1 ![]() In a typical network scenario, identify the ds0 that needs to be monitored for bearer trace collection. Use addbearertraceendpt to define the endpoint and the trace probes that need to be enabled.
In a typical network scenario, identify the ds0 that needs to be monitored for bearer trace collection. Use addbearertraceendpt to define the endpoint and the trace probes that need to be enabled.
Step 2 ![]() Use addbearertracesrvprof to add TFTP or FTP server profile.
Use addbearertracesrvprof to add TFTP or FTP server profile.
Step 3 ![]() Use addbearertrace to tie the endpoint to the defined server profile.
Use addbearertrace to tie the endpoint to the defined server profile.
Step 4 ![]() Make sure that the necessary files are created on the server with correct write permissions if TFTP transfer mode is to be used.
Make sure that the necessary files are created on the server with correct write permissions if TFTP transfer mode is to be used.
Step 5 ![]() Use bearertracestart to enable the tracing on the given endpoint if it is not already enabled using addbearertrace or simply start a call on the endpoint
Use bearertracestart to enable the tracing on the given endpoint if it is not already enabled using addbearertrace or simply start a call on the endpoint
Step 6 ![]() Use bearertracestop to stop the tracing on the given endpoint, or simply stop the call in a VOIP configuration or delete the connection in an AAL2 configuration
Use bearertracestop to stop the tracing on the given endpoint, or simply stop the call in a VOIP configuration or delete the connection in an AAL2 configuration
Detailed Configuration
To set up bearer tracing, use the following procedure.
Step 1 ![]() Set up a connection to an external server to receive the trace information. See Bearer Tracing Connectivity for connectivity details
Set up a connection to an external server to receive the trace information. See Bearer Tracing Connectivity for connectivity details
Step 2 ![]() Use the addbearertraceendpt command to create a bearer trace session.
Use the addbearertraceendpt command to create a bearer trace session.
This command is used to create a session with a specified DS0 or DS1 endpoint for bearer tracing. See T.38 Traces for T.38 endpoints.
The syntax of this command is:
addbearertraceendpt <endptIndex> <LineNum> <ds0> -termId <Term ID> -cnt <counter> -rmIp <remote IP address> -trace <probe>
For <endptIndex> enter a number in the range 1 to 32. This parameter uniquely identifies the bearer trace session.
For <LineNum>, enter line number of the endpoint in one of the following formats.
Note ![]() For IP-IP bearer tracing, the line number should be 0.0.0.0, which is an invalid line number for TDM-IP call. If line number is set to zero, then the ds0 number can be any number. The options termId, rmIp, and cnt is valid only when the line number is 0.0.0.0.
For IP-IP bearer tracing, the line number should be 0.0.0.0, which is an invalid line number for TDM-IP call. If line number is set to zero, then the ds0 number can be any number. The options termId, rmIp, and cnt is valid only when the line number is 0.0.0.0.
For <ds0>, enter:
A number in the range 1 to 24 or all for a T1 interface.
A number in the range 1 to 32 or all for an E1 interface.
The termId is a unique number associated with each IP call leg. To enable bearer tracing for the complete IP-IP call, enter the addbearertraceendpt command for IP-IP call leg 1 and IP-IP leg 2. Make sure that the termId belongs to the IP-IP call leg.
If cnt option alone is selected, then bearer tracing is enabled for next counter number of IP-IP call legs. The maximum number of counters is five.
If you provide rmIp, then the command enables bearer tracing for maximum number of IP-IP call legs. If the number of existing IP-IP call legs are more than five, then bearer tracing for the last five IP-IP call legs starts immediately. If the number of existing IP-IP call legs with the same remote IP address is less than five, then bearer tracing starts immediately on existing IP-IP call legs and enables bearer tracing for the rest of the upcoming calls with the same remote IP address.
If you provide the options rmIp and cnt together, then only upcoming calls (not existing) of a specified remote IP address are traced. The counter number of upcoming calls are traced.
For -trace<probe>, enter the probe numbers to be used in the session. Enter either a single number or multiple numbers, for example, 1,3,5,7)
1 = PCM Input
2 = PCM Output
3= Network Input
4= Network Output
5= Sout (echo canceller output)
6 = VPU - Events
7 = T38 Level 2
8 = T38 Level 1
9 = Message Events
10 = VPU - Segments
Note ![]() The line number all option can be used only when one of the probes 7 and 8 is chosen.
The line number all option can be used only when one of the probes 7 and 8 is chosen.
To verify the creation of the session, use the dspbearertraceendpt command. The format of this command is:
dspbearertraceendpt <endptIndex>
Step 3 ![]() Use the addbearertracesrvprof command to create the network segment of a bearer trace session.
Use the addbearertracesrvprof command to create the network segment of a bearer trace session.
The syntax of this command is:
addbearertracesrvprof <profIndex> <srvIP> <xferMode> <fileNameBase>[<uploadPath> <portNumber/login><password>]
For <profIndex>, enter a number in the range 1 to 10. This parameter uniquely identifies the bearer trace server profile.
For <srvIP>, enter the IP address of the server to receive the bearer trace reports. The IP address can be provided using either IP dot-notation (nnn.nnn.nnn.nnn) or a name (alpha.beta.com) with a proper DNS support.
For <xferMode>, specify the transfer mode for communicating with the server. Enter 0 for FTP, or 1 for TFTP.
For <fileNameBase>, specify a fileNameBase. For FTP, the user can also enter # to indicate the default fileNameBase is to be used (default is not allowed for TFTP).
VXSM generates filenames as follows (Table 11-10):
For <uploadPath>, specify the path of the file in the server. For example. /pcm/tes
Note ![]() The server root directory is used if the path is not specified.
The server root directory is used if the path is not specified.
For <portNumber/login>, enter a TFTP port number if xferMode = 1 or the FTP login name If xferMode = 0.
The TFTP port number is a number in the range 1 to 255 with a default of 69.
For login, use the FTP login name, default is guest.
For <password>, use the FTP password, default is guest.
The creation of the profile can be verified by using the dspbearertracesrvprof command. The format of this command is:
dspbearertracesrvprof <profIndex>
Step 4 ![]() Use the addbearertrace command to link the TDM segment and the network segment of the bearer trace session. Optionally, this command can also start the bearer trace function.
Use the addbearertrace command to link the TDM segment and the network segment of the bearer trace session. Optionally, this command can also start the bearer trace function.
The format of the addbearertrace command is:
addbearertrace <endptIndex> <profIndex> <active>
For <endptIndex>, enter the endpoint index number of the bearer trace session. A number in the range of 1 to 32.
For <profIndex>, enter the profile number of the bearer trace profile. A number in the range of 1 to10.
For <active>, specify 1 for enable or 0 for disable. If this parameter is omitted, the default is enable.
Note ![]() If the bearer tracing is enabled, tracing starts automatically whenever a call is added on the given bearer endpoint. If the bearer tracing is not enabled, then it must be explicitly started using the bearertracestart command (see also the corresponding bearertracestop command).
If the bearer tracing is enabled, tracing starts automatically whenever a call is added on the given bearer endpoint. If the bearer tracing is not enabled, then it must be explicitly started using the bearertracestart command (see also the corresponding bearertracestop command).
The creation of the association can be verified by using the dspbearertrace command. The format of this command is:
dspbearertrace<endptIndex>
Bearer Trace Configuration Examples
Example 1
This sample procedure sets up the bearer tracing endpoint, the FTP or TFTP server, and a method of mapping them to each other before making and tracing a call. The call is on ds0=1 on ds1=1. Configure the bearer tracing endpoint and the servers:
Step 1 ![]() Configure the bearer trace endpoint with appropriate trace probes.
Configure the bearer trace endpoint with appropriate trace probes.
martler.2.VXSM.a > addbearertraceendpt 1 1.1.1.1.1 1 -trace 1,2,5
Step 2 ![]() Configure the bearer trace server with appropriate parameters.
Configure the bearer trace server with appropriate parameters.
martler.2.VXSM.a > addbearertracesrvprof 1 172.17.38.159 0 sarang/root password
Step 3 ![]() Map the bearer trace endpoint using the bearer trace server.
Map the bearer trace endpoint using the bearer trace server.
martler.2.VXSM.a > addbearertrace 1 1 1
Step 4 ![]() Verify that the mapping is successful.
Verify that the mapping is successful.
martler.2.VXSM.a > dspbearertraceendpts
=============================================
BEARER TRACE ENDPT PROFILES
=============================================
Index : 1
line : 1.1.1.1.1
lineNo : 1
ds0No : 1
bearerTraceSrvProf : 0x1 <---- Server Profile is added
bearerTraceProbes : 0x13
Step 5 ![]() Verify that the parameters for bearer trace server are correct.
Verify that the parameters for bearer trace server are correct.
martler.2.VXSM.a > dspbearertracesrvprofs
=============================================
BEARER TRACE SERVER PROFILES
=============================================
Server Profile Index : 1
Bearer Trace Server IP : 172.17.38.159
Server upload directory : /
TFTP/FTP Mode : FTP
File Name Base : sarang
FTP server login : root
FTP server password : password
---------------------------------------------
Step 6 ![]() Place a call on ds0=1 and ds1=1, and then delete it after some time. On the FTP server the following files are created.
Place a call on ds0=1 and ds1=1, and then delete it after some time. On the FTP server the following files are created.
-rw-r--r-- 1 root other 690480 Oct 16 12:17 pcminsarang_1.pcm
-rw-r--r-- 1 root other 690480 Oct 16 12:17 pcmoutsarang_1.pcm
-rw-r--r-- 1 root other 1380960 Oct 16 12:17 soutsarang_1.pcm
Example 2
The following example shows how to collect PCM traces for a call with both endpoints on the same card:
Step 1 ![]() Configure the bearer tracing endpoint for PCMin and PCMout traces.
Configure the bearer tracing endpoint for PCMin and PCMout traces.
addbearertraceendpt 1 1.1.1.1.1 1 -trace 1,2
addbearertraceendpt 2 1.1.1.1.1 2 -trace 1,2
Step 2 ![]() Add a Bearer Trace File Server.
Add a Bearer Trace File Server.
addbearertracesrvprof 1 172.17.38.159 0 rxie /tftpboot root password
Step 3 ![]() Map the bearer endpt to the server profile.
Map the bearer endpt to the server profile.
addbearertrace 1 1 1
addbearertrace 2 1 1
When you make a call on endpoints 1 and 2, the PCM tracing starts automatically because of the last parameter in the addbearertrace command above.
However, If you use a different last parameter as in the following commands,
addbearertrace 1 1 0
addbearertrace 2 1 0
Tracing does not start automatically and the following commands are needed to start the tracing after the call is up:
bearertracestart 1
bearertracestart 2
Step 4 ![]() To stop bearer tracing at any time, use the following CLIs:
To stop bearer tracing at any time, use the following CLIs:
bearertracestop 1
bearertracestop 2
Trace Files
Server File Requirements
1. ![]() Before you enable bearer tracing, files corresponding to the trace files that will be generated by VXSM need to be created on the file server.
Before you enable bearer tracing, files corresponding to the trace files that will be generated by VXSM need to be created on the file server.
2. ![]() Write access to both the created traces files and to the directory where they reside must be set.
Write access to both the created traces files and to the directory where they reside must be set.
3. ![]() If a directory is specified when adding a server profile on VXSM, this directory is relative to the default TFTP directory specified in the TFTP config file (in UNIX, the default is set to /tftpboot in /etc/inet.conf.
If a directory is specified when adding a server profile on VXSM, this directory is relative to the default TFTP directory specified in the TFTP config file (in UNIX, the default is set to /tftpboot in /etc/inet.conf.
FileNames
Bearer trace information is saved to the server as data chunks that will be stored in a file of which the name is generated by VXSM. The file naming scheme is slightly different depending upon whether TFTP or FTP are used as the transport protocol.
TFTP Filenames
Filenames used with TFTP consist of the following parts:
•![]() A probe type
A probe type
•![]() A FILENAMEBASE
A FILENAMEBASE
•![]() The endpoint index being probed
The endpoint index being probed
•![]() A file extension
A file extension
For example, a trace for PCM In on a bearer trace endpoint of index 1 and with a Filename Base Mytrace yields a filename of:
pcminMytrace_1.pcm
Before enabling the bearer trace function, filenames corresponding to trace files must be created on the server. Further, VXSM must have write access to the trace files and the directory in which they reside. The path to the file is relative to the default TFTP directory (usually set as /tftpboot).
Note ![]() When using the FILENAMEBASE, subsequent traces for the same probe and same endpoint overwrite the previous file in the server. It is the responsibility of the server to take action to prevent this occurrence.
When using the FILENAMEBASE, subsequent traces for the same probe and same endpoint overwrite the previous file in the server. It is the responsibility of the server to take action to prevent this occurrence.
FTP Filenames
For systems using FTP, the use of a FILENAMEBASE is optional. If a FILENAMEBASE is specified, the same file naming scheme used for TFTP is used (see previous paragraphs). If a FILENAMEBASE is not specified, VXSM generates a filename having the following parts:
•![]() A probe type
A probe type
•![]() A timestamp MMDDYYHHMMSS based upon a 24-hour clock)
A timestamp MMDDYYHHMMSS based upon a 24-hour clock)
•![]() The endpoint index being probed
The endpoint index being probed
•![]() A file extension
A file extension
For example, a trace for PCM In on a bearer trace endpoint of index 1 yields a filename of:
pcmin111205104520_1.pcm
Note ![]() The filename method using timestamps automatically prevents the overwriting of previous trace files.
The filename method using timestamps automatically prevents the overwriting of previous trace files.
Note ![]() Make sure there is enough space on the server to store all the different trace files for the same probe. The files can get very large if tracing is on for a long time.
Make sure there is enough space on the server to store all the different trace files for the same probe. The files can get very large if tracing is on for a long time.
Troubleshooting a Bearer Trace Operation
A number of issues can cause the trace to lose samples. When tracing is enabled on an endpoint, always check the trace error counters on both the motherboard and the daughter card to track the status of the trace stream.
The commands to use are:
•![]() btresetstats—Reset motherboard bearer trace stats
btresetstats—Reset motherboard bearer trace stats
•![]() dcbtresetstats—Reset daughter card bearer trace stats
dcbtresetstats—Reset daughter card bearer trace stats
•![]() dspbtstats—Display motherboard bearer trace stats
dspbtstats—Display motherboard bearer trace stats
•![]() dspdcbtpktstats—Display daughter card bearer trace packet stats
dspdcbtpktstats—Display daughter card bearer trace packet stats
•![]() dspdcbtstats—Display daughter card bearer trace stats
dspdcbtstats—Display daughter card bearer trace stats
In the bearer tracing infrastructure, the user needs to define the bearer tracing endpoints (ds0) on which bearer traces are to be collected. The user needs to define bearer trace server where the bearer traces will be stored using FTP or TFTP. Any given bearer trace endpoint needs to be mapped to a bearer trace server, so that the bearer traces for that endpoint are stored at the mapped bearer trace server. The user can specify which directory the bearer traces can be stored and the base for the file names in which the traces are to be stored.
The user must make sure the following conditions exist:
1. ![]() The bearer trace server can be pinged from the VXSM card.
The bearer trace server can be pinged from the VXSM card.
2. ![]() The VXSM control PVC IP address can be pinged from the bearer trace server.
The VXSM control PVC IP address can be pinged from the bearer trace server.
3. ![]() If there is no control PVC (example: AAL2 trunking), the Ethernet console connection should be used. In any case, step 1 should pass.
If there is no control PVC (example: AAL2 trunking), the Ethernet console connection should be used. In any case, step 1 should pass.
4. ![]() The bearer trace server supports FTP and TFTP protocol.
The bearer trace server supports FTP and TFTP protocol.
5. ![]() In case of TFTP protocol, appropriate files are created with proper rwx permissions.
In case of TFTP protocol, appropriate files are created with proper rwx permissions.
6. ![]() If the bearer trace transfer takes place through control PVC, the control PVC should have sufficient bandwidth allocated (Table 11-12).
If the bearer trace transfer takes place through control PVC, the control PVC should have sufficient bandwidth allocated (Table 11-12).
Bearer Trace Command Summary
The commands for the Bearer Trace feature are listed below. For detailed descriptions of these commands, refer to the Cisco Voice Switch Services (VXSM) Configuration Guide for MGX Switches and Media Gateways, Release 5.3.
•![]() addbearertraceendpt <endptIndex> <LineNum> <ds0> -trace <probe>
addbearertraceendpt <endptIndex> <LineNum> <ds0> -trace <probe>
•![]() addbearertracesrvprof <profIndex> <srvIP> <xferMode> <fileNameBase>[<uploadPath> <portNumber/login><password>]
addbearertracesrvprof <profIndex> <srvIP> <xferMode> <fileNameBase>[<uploadPath> <portNumber/login><password>]
•![]() bearertracestart <endptIndex>
bearertracestart <endptIndex>
•![]() bearertracestop <endptIndex>
bearertracestop <endptIndex>
•![]() delbearertrace <endptIndex>
delbearertrace <endptIndex>
•![]() delbearertraceendpt <endptIndex>
delbearertraceendpt <endptIndex>
•![]() delbearertracesrvprof <profIndex>
delbearertracesrvprof <profIndex>
•![]() dspbearertraceendpt <endptIndex>
dspbearertraceendpt <endptIndex>
•![]() dspbearertraceendpts
dspbearertraceendpts
•![]() dspbearertracesrvprof <profIndex>
dspbearertracesrvprof <profIndex>
•![]() dspbearertracesrvprofs
dspbearertracesrvprofs
•![]() btresetstats <endptID><probe>
btresetstats <endptID><probe>
•![]() dcbtresetstats <endptID><probe>
dcbtresetstats <endptID><probe>
•![]() dspbtstats <endptID><probe>
dspbtstats <endptID><probe>
•![]() dspdcbtstats <endptID><probe>
dspdcbtstats <endptID><probe>
•![]() dspdcbtpktstats <endptID><probe>
dspdcbtpktstats <endptID><probe>
Troubleshooting Commands
Table 11-13 lists CLI commands for troubleshooting the VXSM.
Obtaining Information from VXSM Cards
This section describes how to obtain information from a VXSM card.
Table 11-14 lists the commands for obtaining information from the VXSM card.
Example
The debughelp -All command displays information in categorized groups, as shown in the following example:
DEChassis.14.VXSM.a > debughelp -All
*******************************************
Warning: It may affect your load setup!!!!!
*******************************************
Do you still want to continue(y/n) :y
-------------------- General_Config --------------------
--- dspcons
=================================================================================
PVC Connections
=================================================================================
If Upld Admin
Num VPI VCI PVC Type Appl M/S Active Protection Counter State Alarm
=== === ===== ==== ======= ========= === ======= =========== ======== ===== =====
1 103 103 AAL5 VBR3RT control M active protected 10 UP none
1 103 113 AAL5 VBR3RT bearer M active protected 12 UP none
1 103 123 AAL5 VBR3RT bearer M active protected 14 UP none
1 103 133 AAL5 VBR3RT bearer M active protected 16 UP none
1 103 203 AAL5 VBR3RT control M standby protected 9 UP none
1 103 213 AAL5 VBR3RT bearer M standby protected 11 UP none
1 103 223 AAL5 VBR3RT bearer M standby protected 13 UP none
1 103 233 AAL5 VBR3RT bearer M standby protected 15 UP none
Obtaining Signaling Messages on VXSM
This section describes how to obtain signaling messages on VXSM.
Table 11-15 lists the commands for capturing signaling messages on VXSM.
Capturing Information with FileSigMsg
From Release 5.6.21 onwards, the debughelp -FileSigMsg command allows you to capture signaling messages between VXSM and Cisco MGC in the PXM HD.
Restrictions and Usage Guidelines
Follow these restrictions and guidelines when you enable FileSigMsg:
•![]() This feature is supported on all codec templates for the H248 and MGCP protocol.
This feature is supported on all codec templates for the H248 and MGCP protocol.
•![]() This feature supports all card types such as T1, E1, OC3, and so on.
This feature supports all card types such as T1, E1, OC3, and so on.
•![]() This feature is disabled by default.
This feature is disabled by default.
•![]() You can capture a maximum of five call signaling messages in the PXM HD. The debughelp -FileSigMsg command creates the H248_Sig_Msgs or MGCP_Sig_Msgs file in the PXM HD at the location C:vxsmlogs. After capturing signaling messages, ensure that you execute the debughelp -FileSigMsg -H248/-MGCP 1 command to stop capturing signaling messages.
You can capture a maximum of five call signaling messages in the PXM HD. The debughelp -FileSigMsg command creates the H248_Sig_Msgs or MGCP_Sig_Msgs file in the PXM HD at the location C:vxsmlogs. After capturing signaling messages, ensure that you execute the debughelp -FileSigMsg -H248/-MGCP 1 command to stop capturing signaling messages.
Steps to Capture Information with FileSigMsg
Perform the following steps to capture signaling messages between VXSM and Cisco MGC:
Step 1 ![]() Execute the debughelp -FileSigMsg command. The command format is as follows:
Execute the debughelp -FileSigMsg command. The command format is as follows:
debughelp -FileSigMsg ccp {H248 | MGCP} Option {1 | 2}
Table 11-16 describes the parameter options for the debughelp -FileSigMsg command.
|
|
|
|---|---|
ccp |
• • |
Option |
• • |
Step 2 ![]() After capturing the required signaling messages, ensure that you disable the feature by using the Disable option.
After capturing the required signaling messages, ensure that you disable the feature by using the Disable option.
Example
The following example displays how you can use the debughelp -FileSigMsg command to capture signaling messages:
DEChassis.14.VXSM.a > debughelp -FileSigMsg -H248 2
DEChassis.14.VXSM.a > debughelp -FileSigMsg -MGCP 1
Capturing Information with FTPSigMsg
From Release 5.6.21 onwards, you can capture in a server, signaling messages between VXSM and Cisco MGC using FTP.
Restrictions and Usage Guidelines
Follow these restrictions and guidelines when you enable FTPSigMsg:
•![]() This feature is supported on all codec templates for the H248 and MGCP protocol.
This feature is supported on all codec templates for the H248 and MGCP protocol.
•![]() This feature supports all card types such as T1, E1, OC3, and so on.
This feature supports all card types such as T1, E1, OC3, and so on.
•![]() This feature is disabled by default.
This feature is disabled by default.
•![]() The command can run for a maximum time of fifteen minutes at a maximum speed of ten CPS. Before executing this command, ensure that your server has sufficient space. The debughelp -FTPSigMsg command creates a file at a path specified by you. After capturing signaling messages, ensure that you execute the debughelp -FTPSigMsg -H248/-MGCP 1 command to stop capturing signaling messages.
The command can run for a maximum time of fifteen minutes at a maximum speed of ten CPS. Before executing this command, ensure that your server has sufficient space. The debughelp -FTPSigMsg command creates a file at a path specified by you. After capturing signaling messages, ensure that you execute the debughelp -FTPSigMsg -H248/-MGCP 1 command to stop capturing signaling messages.
Steps to Capture Information with FTPSigMsg
Perform the following steps to capture signaling messages between VXSM and Cisco MGC:
Step 1 ![]() Execute the debughelp -FTPSigMsg command. The command format is as follows:
Execute the debughelp -FTPSigMsg command. The command format is as follows:
debughelp -FTPSigMsg ccp {H248 | MGCP} Option {1 | 2} [Server | Login | Password | Path |Filename]
Table 11-17 describes the parameter options for the debughelp -FileFTPMsg command.
Step 2 ![]() After capturing the required signaling messages, ensure that you disable the feature by using the Disable option.
After capturing the required signaling messages, ensure that you disable the feature by using the Disable option.
Example
The following example displays how you can use the debughelp -FTPSigMsg command to capture signaling messages:
DEChassis.14.VXSM.a > debughelp -FTPSigMsg -H248 2 10.78.161.9 cisco cisco/Specify/Path
Filename
DEChassis.14.VXSM.a > debughelp -FTPSigMsg -H248 1
DEChassis.14.VXSM.a > debughelp -FTPSigMsg -MGCP 2 10.78.161.9 cisco cisco/Specify/Path
Filename
DEChassis.14.VXSM.a > debughelp -FTPSigMsg -MGCP 1
 Feedback