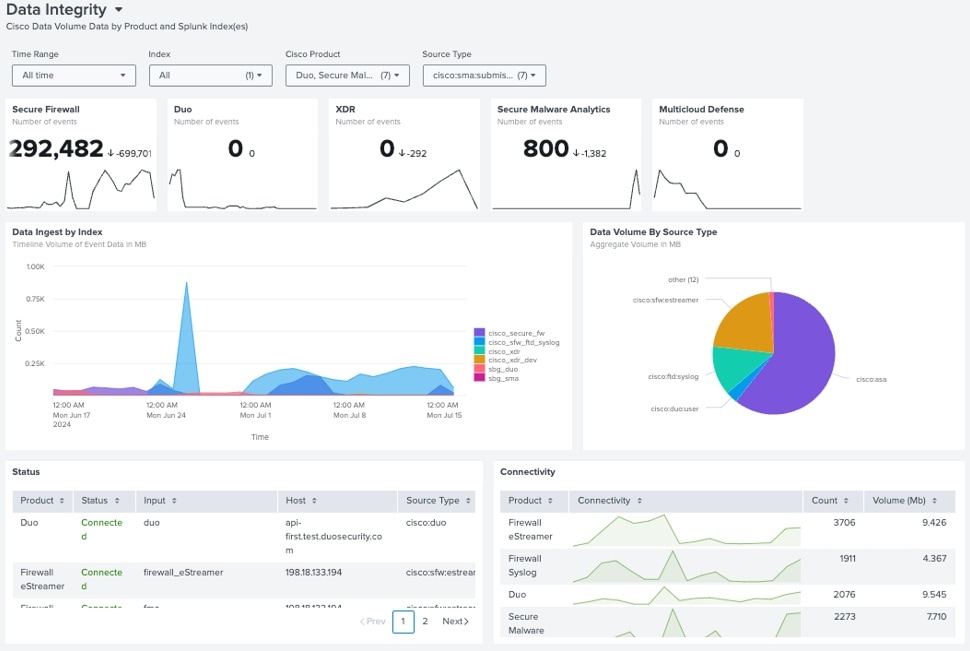
Data Integrity Dashboard
The Data Integrity dashboard serves as a centralized hub for monitoring the health and flow of data from the inputs that you have created. The dashboard provides you with a comprehensive view of the statistics and status of each application's data, ensuring that you have the insights that are needed to maintain the integrity and reliability of your security environment.
Data Integrity Dashboard Specifics
-
You can filter data using the Time Range, Index, Cisco Product, or Source Type filters:
-
Time Range: defines the time for which you would like to see data. Works with all tiles on the dashboard.
-
Index: indexes that you’ve used while creating inputs on the Configuration Application pages. The filter works only with the Event count cards located at the top of the page. It shows “0” on all other cards.
-
Cisco Product: allows to filter data by Product Name. Works with all tiles on the dashboard, except Event count cards.
-
Source Type: source types that were used while creating inputs on the Configuration Application pages. Works with all tiles on the dashboard, except Event count cards.
-
-
The Data Integrity dashboard is XML-based.
To edit the dashboard, click the Edit button.
 Note |
This action will only affect the existing user.
|
 Feedback