Troubleshoot Issues in Cisco Security Cloud App

If you encounter issues with the Cisco Security Cloud App, follow these steps to identify and address the problem:

  1. Check logs – Review system and app-specific logs for error patterns related to configuration, API connectivity, data ingestion, or access control.

  2. Apply fixes – Use the guidance in this section to resolve any identified issues.

  3. Seek further assistance – Gather diagnostic details and contact Cisco TAC for additional support.

Collect and Analyze Logs

Analyzing logs is essential for identifying root causes and resolving issues quickly. When troubleshooting, check for the following indicators:

  • Review system and app-specific logs for error messages related to configuration, API connectivity, data ingestion, or access control. Check the logs for entries marked with ERROR, WARN, or FATAL.

  • Input-specific issues such as “Failed to fetch inputs,”“Invalid credentials,” or “Timeout”.

  • Timestamp bookmarks where data ingestion pauses or stops.

The following log files are particularly useful during diagnostics:

  • Main Splunk Log

    Contains general system errors, including indexing issues, ingestion failures, and Splunk service restarts.

    
    $SPLUNK_HOME/var/log/splunk/splunkd.log
    
  • Cisco App-Specific Log

    Tracks input creation, connectivity to Cisco APIs, and error responses from connectors.

    
    $SPLUNK_HOME/var/log/splunk/CiscoSecurityCloud/CiscoSecurityCloud.log
    
  • Performance Metrics Log

    Provides metrics on data throughput, CPU usage, memory, and indexing delays.

    
    $SPLUNK_HOME/var/log/splunk/metrics.log
    

App Stability and Post-Upgrade Issues

If you encounter instability, crashes, or no visible changes after an upgrade, use the following steps to resolve the issue:

  • Check the health indicator at the top right side of your navigation tab.

  • Avoid multiple sessions: Do not run the app in multiple Splunk browser sessions simultaneously.

  • Restart Splunk from CLI: Restart Splunk using the command line ($SPLUNK_HOME/bin/splunk restart) instead of the user interface (UI).

  • Use a fresh session: Open Splunk in a new incognito window.

  • Clear cache and cookies: Flush your browser’s cache and cookies, then test again in another supported browser (latest versions of Chrome, Firefox, Edge, or Safari).

Failed to Create or Edit an Input

The system displays an error message when it fails to create or edit an SNA, ETD, or XDR input. This failure occurs under the following conditions:

Type

Issue

Workaround

Environment-related issue

The system triggers the error if you open two Splunk windows in parallel and create inputs simultaneously, or if the environment runs slowly.

Use a single Splunk window when creating inputs and avoid simultaneous input creation in multiple sessions.

Configuration error

During input creation, the CII application checks the provided credentials and HEC URL. If either value is invalid, the system fails to create the input.

Verify the credentials and HEC URL, and enter valid data.

Delayed Event Updates

In high-volume environments or on slower systems, performance lag during input creation can cause delayed updates. To address this issue:

  • Verify that the input was not created multiple times in parallel from different browser windows.

  • Use the Resource Utilization dashboard to review input lag and monitor system metrics.

Failed to Fetch Input Data for Applications

If dashboards or indexes show no data after you create an input or perform an upgrade:

  • Check if the input is configured correctly.

  • Check the status of your input on the Error Handling, Cisco API ThroughPut widgets of the Resource Utilization dashboard.

  • Verify that the user role has the required permissions. See User Roles and Permissions in Cisco Security Cloud App.

For eStreamer inputs, you will not see an immediate status display after creation. The high volume of initial data and the short query interval (3 seconds) prevent the system from capturing ingestion status on the first run.

Syslog or ASA Input Deletion Issues

You cannot delete the Syslog or ASA input with the following details:

  • Input Type: TCP, any available port

  • Multiple host values separated by commas (for example: "host1, host2, host3")

As a workaround, delete or edit the restricted host for the input in /opt/splunk/etc/apps/CiscoSecurityCloud/local/inputs.conf.

Cisco Security Cloud App UI loads infinitely

When the UI fails to load or becomes unresponsive:

  • Use an incognito browser window.

  • Clear your browser cache and perform a hard reload.

  • Try another supported browser.

  • If you're upgrading, always clear the cache after the upgrade.

KV Store process issues

Error message

The KV Store process terminated abnormally (exit code 6, status exited with code 6.)

Possible Cause

This error message is observed only in Single Node configurations with an excessive data volume.

Recommended Action

  • Ensure that the Mongo key has the correct permissions or run the following command:
    chmod 400
            $SPLUNKHOME/var/lib/splunk/kvstore/mongo/splunk.key
  • Consider raising the maximum allowed memory for the KV Store cache.

    Add the following configuration to the server.conf file in your $SPLUNKHOME/etc/system/local directory:
    [kvstore]
    percRAMForCache = 15

Note


15% is the default value. Increase the percentage based on the current memory consumption of the instance.

You can check your current configuration in the $SPLUNKHOME/etc/system/default in server.conf file.

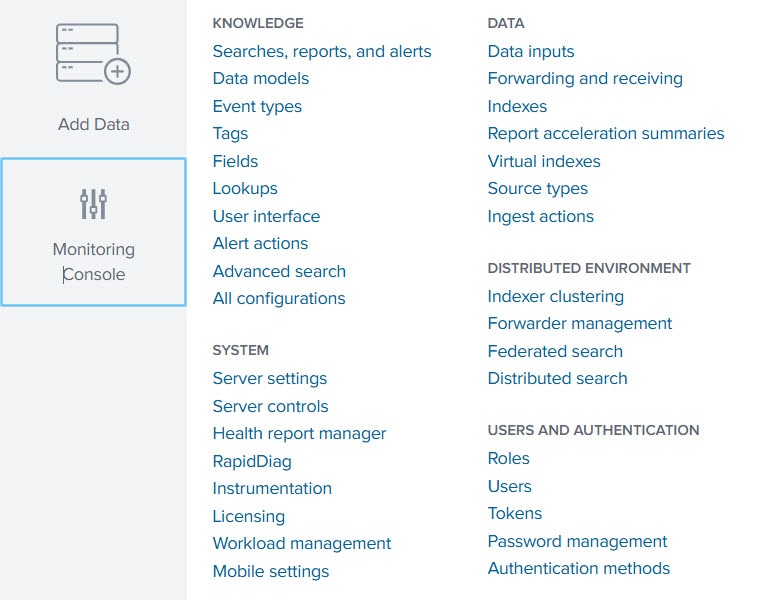
To check the current instance memory consumption, go to Resource Usage under Monitoring Console.

Troubleshoot Splunk HEC Connectivity

This section describes how to verify the Splunk HTTP Event Collector (HEC) setup and troubleshoot common issues such as connectivity failures or missing data ingestion from Cisco Identity Intelligence (CII).

Prerequisites

Ensure you have sc_admin or equivalent permissions in Splunk.

Verify HEC configuration in Splunk

  1. Go to Settings > Data Inputs > HTTP Event Collector.

  2. If HEC is disabled:

    • Select Global Settings.

    • Enable All Tokens, then click Save.

  3. Click New Token, provide a name (for example, test_token), and select Submit.

  4. Copy the Token Value displayed. This will be referred to as {Token Value}.

Identify the HEC URL

Identify the correct HEC endpoint based on your Splunk deployment type.

  • Splunk Enterprise

    https://<your-splunk-host>:8088/services/collector/raw
    
  • Splunk Cloud Platform

    https://http-inputs-<splunk-stack>.splunkcloud.com:443/services/collector/raw
    

Replace <your-splunk-host> with the Splunk server’s IP address or hostname. This will be referred to as {HEC URL}.

Send a Test Event

Use curl to send a sample event to Splunk and confirm that HEC is receiving data correctly.

  1. Open a terminal.

  2. Run the following command (replace placeholders with your values):

    curl -k -H "Authorization: Splunk {Token Value}" \
    -d '{"event": "Hello, Splunk HEC Test!"}' {HEC URL}
  3. Verify the result. A successful response returns:

    {"text":"Success","code":0}
  4. In Splunk, search for the event to confirm ingestion:

    index=<your_index> "Hello, Splunk HEC Test!"
    

    For more details, see the Cisco webhook integration documentation.

Troubleshoot external system integration

If the Splunk input and the Cisco Identity Intelligence (CII) webhook are both configured successfully, perform the following checks:

  1. Run a connectivity test

    • Verify whether data is being sent from CII to Splunk.

  2. Check IP allowlisting

    • If no data appears in Splunk after the test, confirm that the CII IP address is included in the Splunk allowlist.


      Note


      For testing purposes, you may temporarily add a broad range (for example, 0.0.0.0/0) to confirm connectivity.

      This configuration should never be used in production, as it introduces security risks.


  3. Apply a secure configuration

    • Obtain the specific CII cloud IP addresses or ranges from Cisco.

    • Add only those addresses to the Splunk allowlist to enable secure and reliable data ingestion.

Troubleshoot SSL Validation Errors

If you repeatedly encounter the following error while creating a new input in the Cisco Security Cloud add-on:

The provided API credentials cannot get the necessary logs.  
Please verify that the API settings are correctly configured
Argument validation for scheme=sbg_fw_estreamer_input: killing process, because executing it took too long (over 30000 msecs).
[sbg_fw_estreamer_input] stream_events():292 instance=New_Input, error_type=Connection, error_code=SSLError, error_detail=Unable to process sbg_fw_estreamer_input://New_Input due to SSLError, traceback=[SSL: TLSV1_ALERT_UNKNOWN_CA] tlsv1 alert unknown ca (_ssl.c:1143), filter_value=sbg_fw_estreamer_input.py  

This error indicates that the connection failed due to an SSL certificate trust issue. TLSV1_ALERT_UNKNOWN_CA means the SSL handshake failed because the Certificate Authority (CA) that issued the FMC certificate is not trusted.

To resolve this issue:

  1. Create a PEM file from the existing PKCS file.

    openssl pkcs12 -in certificate.pkcs12 -info -nodes
    openssl pkcs12 -in 10.x.x.x.pkcs12 -cacerts -nokeys -out ca_certs.pem
    
  2. Add the PEM file to the trusted store on the Heavy Forwarder (HF) instance by placing it in:

    /etc/pki/ca-trust/source/anchors/
    
  3. Refresh the CA trust on the HF instance:

    sudo update-ca-trust
    
  4. Restart the Splunk service.

Contact Cisco Support

If your issue remains unresolved after troubleshooting, contact Cisco Support in any of the following ways:

Ensure you include relevant logs and screenshots when opening a case.

Info to collect before opening a case

  • OS and platform (for example, Red Hat 8.10, Splunk Cloud, or Enterprise)

  • Deployment type (Single-instance, Distributed, or Clustered)

  • Connector or Cisco product that is impacted

  • Configuration details used during input creation

  • Region or tenant (US, EU, Asia)

  • Relevant log files:

    • splunkd.log

    • CiscoSecurityCloud.log

    • metrics.log

    See Collect and Analyze Logs for more information.

  • Console browser errors (attach screenshots)

  • API call details (if applicable)