About Security Analytics and Logging (SAL SaaS) for ASA devices
Security Analytics and Logging (SaaS) allows you to capture all syslog events and Netflow Secure Event Logging (NSEL) from your ASA and view them in one place in Security Cloud Control.
The events are stored in the Cisco cloud and viewable from the Event Logging page in Security Cloud Control where you can filter and review them to gain a clear understanding of what security rules are triggering in your network. The Logging and Troubleshooting package gives you these capabilities.
Licensing
To configure this solution you need the following accounts and licenses:
-
Security Cloud Control: You must have a Security Cloud Control tenant.
-
Secure Device Connector: There is no separate license for a Secure Device Connector.
-
Secure Event Connector: There is no separate license for a Secure Event Connector.
-
Secure Logging Analytics (SaaS): See Security Analytics and Logging licenses.
-
Adaptive Security Appliance (ASA): Base license or higher.
Next step
Go to Implementing Secure Logging Analytics (SaaS) for ASA Devices
How ASA Events are Displayed in Security Cloud Control
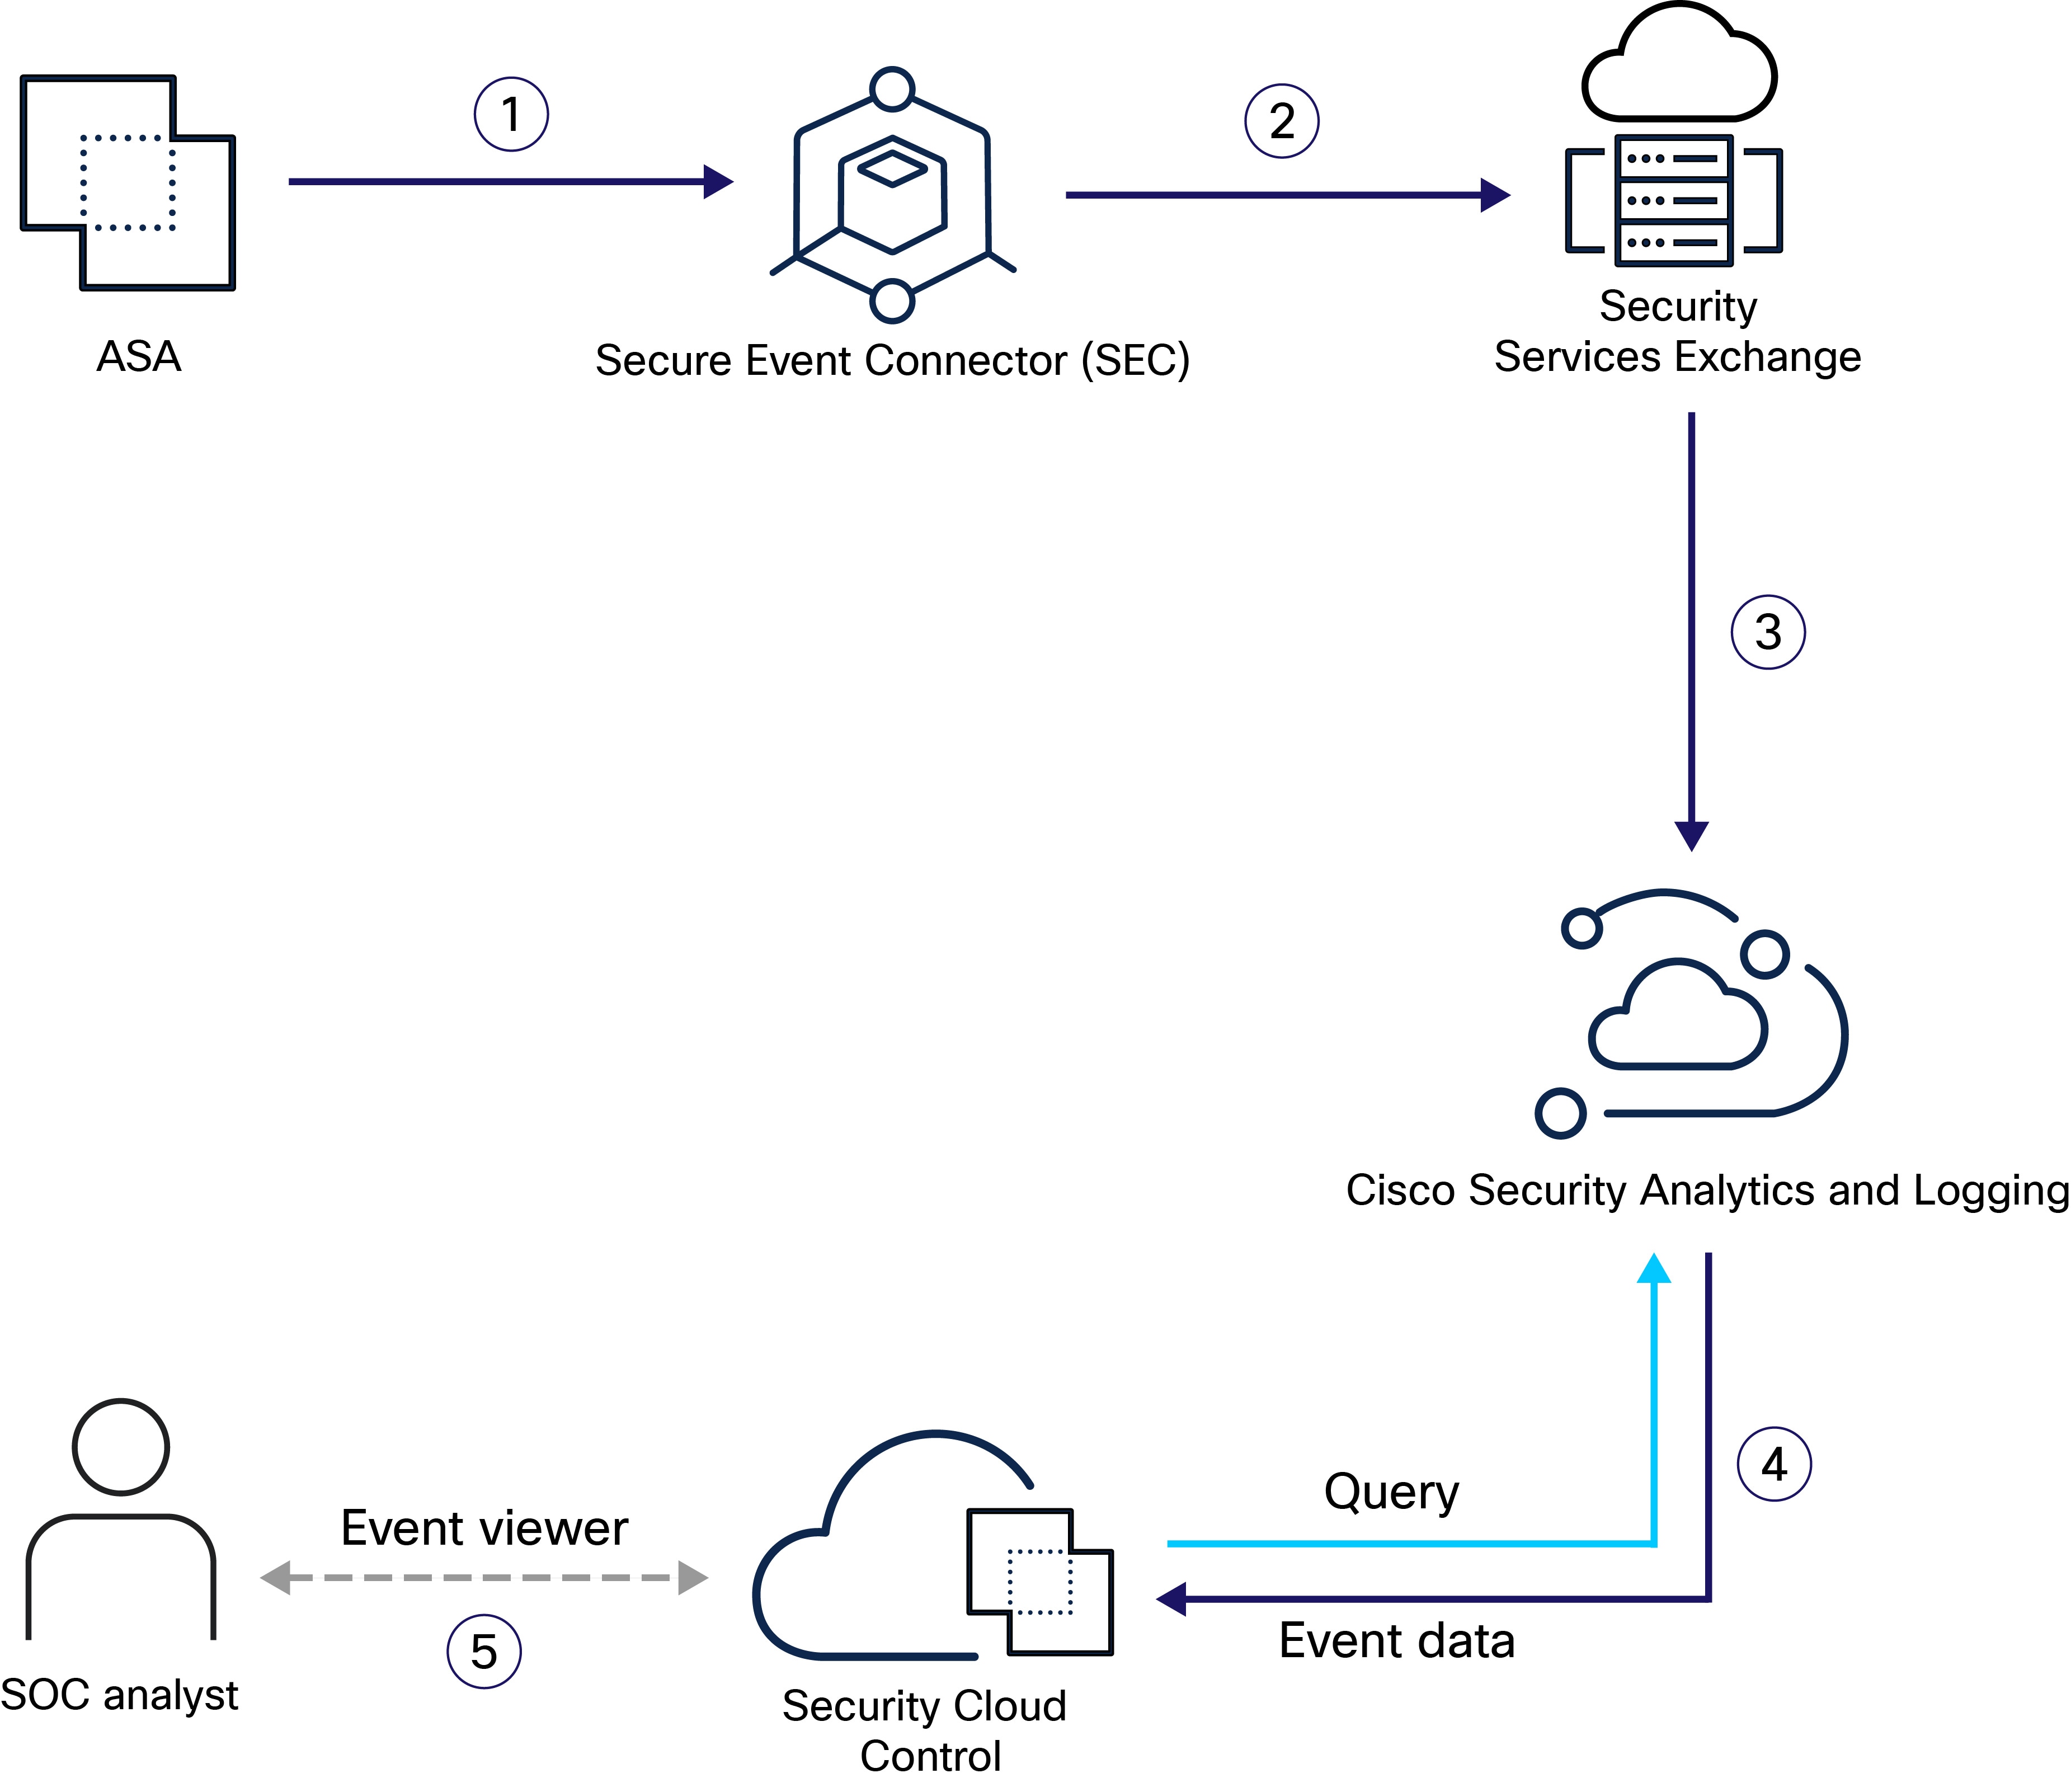
This diagram describes how ASA devices shares syslog and NSEL events with Security Cloud Control.
|
Step |
Description |
|---|---|
|
1 |
You configure the ASA to forward syslog and NSEL events to any one of your Secure Event Connectors as if they were syslog servers and enable logging on the device. Syslog events and NSEL events are generated when logging is enabled on the ASA, and network traffic matches access control rule criteria. The ASA device forwards the syslog and NSEL events to the configured Secure Event Connector. |
|
2 |
The Secure Event Connector forwards the events to Security Services Exchange. |
|
3 |
Security Services Exchange aggregates the event data from all the ASA devices, converts it to JSON format, and sends it to Security Analytics and Logging for storage. |
|
4 |
Security Analytics and Logging process the event data using various services to classify and enrich it for use by the Security Cloud Control. |
|
5 |
Security Cloud Control stores the event data in the cloud data store. Security Cloud Control queries the stored data to provide SOC analysts with the relevant information. |

 to show the list of available macros.

 Feedback