
New and changed information
The following table provides an overview of the significant changes up to this current release. The table does not provide an exhaustive list of all changes or of the new features up to this release.
| Release Version | Feature | Description |
|---|---|---|
|
Nexus Dashboard 4.3.1 |
Content moved out of Understanding Fabric Groups article. |
Content that was previously in a separate Understanding Fabric Groups article is now combined into this Editing Fabric Groups article. For more information, see Understanding fabric groups. |
|
Nexus Dashboard 4.3.1 |
New information in a fabric group’s Overview page |
The Overview page for a fabric group now provides Advisory level, Analytics summary, and Connectivity information, as well as Fabric bugs information. For more information, see Overview. |
|
Nexus Dashboard 4.3.1 |
Ability to run connectivity analysis at the fabric group level |
A Start connectivity analysis job option is now available under Overview > Actions page at the fabric group level. For more information, see Actions. |
|
Nexus Dashboard 4.3.1 |
Endpoints page now available for fabric groups |
The Connectivity > Endpoints page is now available for fabric groups, providing information on the endpoints across the different fabrics in a fabric group. For more information, see Endpoints. |
|
Nexus Dashboard 4.3.1 |
Inter-fabric page now available for fabric groups |
The Connectivity > Inter-fabric page is now available for fabric groups, which monitors and displays information about previously configured inter-fabric connections, providing visibility into the health and connectivity status of those connections. For more information, see Inter-fabric. |
|
Nexus Dashboard 4.3.1 |
Support for |
The For more information, see Support for |
|
Nexus Dashboard 4.3.1 |
Support for route servers |
The For more information, see Support for route servers for VXLAN-ACI fabric groups. |
|
Nexus Dashboard 4.3.1 |
Cisco Nexus 9000 Series name change |
Cisco Nexus 9000 Series is now the Cisco N9000 Series. |
Understanding fabric groups
You can use fabric groups to create a group of fabrics with common attributes for visualization purposes and simpler management.
Understanding LAN fabrics, ACI fabrics, and fabric groups
Before you begin working with fabrics and fabric groups, it’s helpful to understand more about each.
Understanding LAN and ACI fabrics
Fabrics are on-premises network regions that include a group of switches and other networking devices that provide connectivity to your applications and endpoints. They may be split in different availability zones (such as pods) that are analyzed and managed by Nexus Dashboard.
There are many types of fabrics:
-
LAN — This type of fabric contains either of these switch types:
-
NX-OS switches — These are a group of Nexus switches running NX-OS software. Nexus Dashboard manages and monitors NX-OS switches using best-practice templates. You can add a fresh set of NX-OS switches for greenfield deployments or onboard existing NX-OS switches to an existing fabric for incremental management and monitoring.
-
Non-Nexus switches and devices — Nexus Dashboard supports onboarding a variety of non-Nexus switches and service appliances such as IOS-XE, IOS-XR, firewalls, and load balancers. These devices support campus VXLAN EVPN fabrics, Layer 4 to Layer 7 (L4–L7) services, and external fabrics that enable east-west or north-south connectivity, such as an IP-based network (IPN), inter-site network (ISN), core, and edge.
-
-
ACI — ACI fabric consists of multiple Cisco N9000 switches running ACI software managed by an Application Policy Infrastructure Controller (APIC) cluster.
-
Monitoring and Analysis: Onboard existing ACI fabrics for continuous telemetry streaming. In environments with restricted connectivity, such as air-gapped networks, you can onboard ACI switches as offline snapshots to perform point-in-time analysis without a direct network connection.
-
You can also use Orchestration to manage and coordinate policies across multiple ACI sites.
-
In addition, you can group ACI fabrics with NX-OS fabrics using the VXLAN-ACI fabric group, where you can now import tenant policies from ACI fabrics into Nexus Dashboard using the EPG-to-ESG migration workflow. See Understanding the process for importing tenant policies from ACI fabrics into VXLAN-ACI fabric groups for more information.
-
Nexus Dashboard multi-cluster architecture categorizes fabrics as Local or Remote.
-
Local: A fabric that is present in the local Nexus Dashboard cluster.
-
Remote: A fabric that is not present in this cluster, but rather is present in another cluster that is part of Nexus Dashboard multi-cluster connectivity.
In addition, local fabrics can be broken down in the following manner:
-
Online fabrics: Fabrics that are connected to Nexus Dashboard over the network.
-
Snapshot fabrics: Fabrics that are referenced by a snapshot for use in one-time analysis or demonstrations. They may or may not be connected to Nexus Dashboard over the network.
And finally, you can either create new fabrics or onboard existing fabrics. Note that before Nexus Dashboard and the individual services were unified into a single product (as described in the section "Unified Nexus Dashboard deployment" in the Nexus Dashboard Deployment and Upgrade Guide), there were fabric types that were available previously but might not be available as a new fabric type with the unified product, such as the Legacy Classic LAN fabric type. You can still onboard those existing fabric types but you will not be able to create a new fabric with those pre-unification fabric types. See Mapping fabric types for more information.
Grouping fabrics and clusters
There are several ways to group fabrics and clusters together in Nexus Dashboard:
Grouping Nexus Dashboard clusters
Multi-cluster connectivity: You can establish connectivity between multiple Nexus Dashboard and APIC clusters. For more information, see Connecting Clusters.
Grouping fabrics
The method that you use to group fabrics together differs depending on the type of fabric:
-
NX-OS fabrics: You can group fabrics together using a fabric group, which is a collection of fabrics grouped for visualization or management. The available fabric group types include:
-
VXLAN: A fabric group that is used to interconnect multiple data center VXLAN EVPN fabrics and/or ACI fabrics using border gateways. It can also be used to interconnect Data Center and Campus VXLAN EVPN fabrics. This enables shared overlay deployments for security and segmentation using VXLAN EVPN multisite. The IPN/ISN interconnect network fabric may also be optionally part of this group.
These types of VXLAN fabric groups are available:
-
VXLAN: This subtype of fabric group can contain multiple NX-OS-based Data Center VXLAN EVPN fabrics and/or IOS-XE-based Campus VXLAN EVPN fabrics (which need NX-OS-based border gateways). The DCI network comprising of Multi-Site and External Connectivity or BGP routed fabrics can also be part of this group.
-
VXLAN-ACI: A group that includes a Cisco ACI fabric connected to one or more Cisco NX-OS fabrics using the Nexus One architecture for unified management and policy deployment. For more information, see Understanding the Nexus One architecture.
-
-
Classic: A Classic fabric group can contain Enhanced Classic LAN, Legacy Classic-LAN, Any VXLAN EVPN and External and Inter-fabric connectivity fabrics. This group allows for a combined visualization at a topology level. No group level deployments are available in this fabric group.
-
IP Fabric for Media: A logical group of LAN or IP Fabric for Media (IPFM) fabrics. This type of fabric group can contain individual IPFM/IPFM-Classic/Classic-LAN fabrics. This type of group allows shared host and flow definitions.
-
-
Cisco ACI fabric management models: You can manage ACI fabrics in Nexus Dashboard using one of two methods:
-
Using Cisco ACI in Nexus Dashboard Orchestration
-
Deploys tenants, networks, and policy configurations across multiple ACI sites.
-
Provides a central point for multisite policy consistency and scale.
For more information, see Connecting Multiple ACI Fabrics and Working with Orchestration.
-
-
Using Cisco ACI in a VXLAN-ACI fabric group
-
Enables management and interoperability between Cisco ACI and Cisco NX-OS VXLAN EVPN fabrics.
-
Automates the infrastructure configuration for inter-fabric underlay and overlay connectivity between ACI and NX-OS fabrics.
-
Centralizes the deployment of security and segmentation policies across Cisco ACI and Cisco NX-OS environments.
For more information, see Understanding the Nexus One architecture
-
Constraint: You cannot enable Orchestration on a Cisco ACI fabric that is a member of a VXLAN-ACI fabric group. Similarly, you cannot add a Cisco ACI fabric to a VXLAN-ACI fabric group if Orchestration is enabled. When adding fabrics to a VXLAN-ACI fabric group, any ACI fabrics with Orchestration enabled will not be available to choose.
-
-
Multi-cluster fabric groups: You can create a multi-cluster fabric group that spans multiple Nexus Dashboard clusters to manage VXLAN fabrics across different clusters in a multi-cluster fabric group. For more information, see Create multi-cluster fabric groups.
Guidelines and limitations for fabric groups
-
For fabric groups, the controller and telemetry functions must reside on the same Nexus Dashboard cluster, as co-location of these services across multiple clusters is not supported.
Understanding the Fabric Groups page
The Fabric groups page provides a centralized view of fabric group operations, inventory health, connectivity metrics, configuration, and operational status of the network monitoring infrastructure.
The Fabric groups page includes the following tabs.
Overview
The Overview tab provides a summary of the health and status of the fabric group. You can also view the anomaly level, general fabric details (such as software versions and license tier), inventory summaries, and real-time status of input ports, monitoring tools, and packet filters. It also tracks data throughput and recent administrative activity.
Follow these steps to navigate to the Overview tab.
-
Navigate to the Fabric groups page.
Go to Manage > Fabrics > Fabric groups.
-
From the Fabric groups table, click a fabric group.
The Overview page for that fabric group displays.
Actions
These are the actions that you can take at the fabric group level.
| Action | Description |
|---|---|
|
Edit fabric group settings |
Allows you to modify the configuration settings of the fabric group as needed. |
|
Add member fabric |
Allows you to add member fabrics to a fabric group. |
|
Recalculate and deploy |
Allows you to recalculate fabric policies and configurations, ensuring they are up-to-date and aligned with the desired state. Once recalculated, you can deploy these settings across the fabric group. |
|
Associate tenants |
Allows you to associate tenants with the fabric group. For more information, see Associate tenants with a fabric group. |
|
Start connectivity analysis job |
Allows you to start a connectivity analysis job scoped to the fabric group. Only endpoints within that fabric group are available for analysis. For more information, see Analyzing endpoint flows using Connectivity Analysis. |
|
Configuration |
Allows you to add links in a fabric group. |
|
Maintenance |
Provides options to backup and restore a fabric group. For more information, see Backing Up and Restoring Your Nexus Dashboard. |
Tiles
Review the information in the various tiles in the Overview tab.
Anomaly level
The anomaly data for a fabric group includes the anomalies of the fabric group and all its member fabrics. The aggregate score and level are reflected in the Overview page for the fabric group, as well as the Summary and Details widgets and pages.
Nexus Dashboard proactively detects different types of anomalies across the network, analyzes the anomalies, and identifies remediation methods. The Anomaly level tile provides a status of your anomaly levels and a list of your top anomaly categories.
Nexus Dashboard monitors different sets of data from all nodes in the fabrics in the fabric group and baselines the data to identify “normal” behavior. Any deviation is represented as an anomaly. Your time is better spent in resolving the issue instead of tracking the issue. Additionally, it can estimate the impact of the anomaly and generate a recommendation depending on the nature of the anomaly and thus reducing the Mean Time to Troubleshooting and Resolution (MTTR).
Click in the Anomaly level tile to navigate directly to the Anomalies tab in the Summary page. See Detecting Anomalies in Your Nexus Dashboard for more information.
Advisory level
The advisory data for a fabric group includes the advisories of the fabric group and all its member fabrics. The aggregate level is reflected in the Overview page for the fabric group, as well as in the Summary and Details widgets and pages. Nexus Dashboard identifies field notices, software and hardware end-of-life and end-of-sale announcements, as well as security advisories that can potentially impact the network fabrics that it is monitoring, and generate advisories. Advisories provide recommendations to keep your network under support and running in optimal conditions. The Advisory level tile provides a status of your advisory levels and a list of your top advisory categories.
Click in the Advisory level tile to navigate directly to the Advisories tab in the Summary page. See Identifying Advisories in Your Nexus Dashboard for more information.
Recent activity
The Recent activity tile provides a summary of the most recent changes that have occurred in the fabrics in the fabric group (for example, if you deleted an interface on a switch in a fabric in the fabric group). Click View all to navigate directly to the History tab in the Summary page. See History for more information.
General
The General tile provides a summary of this information for the fabric group. Click Settings to view more detailed information on the general settings for the fabric group.
| Field | Description |
|---|---|
|
Group name |
Provides the name of the fabric group. |
|
Type |
Provides the type of fabric group. |
|
CloudSec |
Shows if CloudSec is enabled or not for this fabric group. |
|
Multi-site overlay IFC deployment method |
Provides information on how the data centers connect through the border gateways: manually, directly to the border gateways or through a route server. |
|
Security group status |
Provides the security group status for the fabric group. |
|
Switches software version |
Provides the software versions on the switches in the fabrics in the fabric group. If there are more than two switch software versions in the fabrics in the fabric group, text is displayed that shows how many additional switch software versions are in the fabrics. |
|
Fabric bugs |
Displays bugs that are associated with the software running on the fabrics in the fabric group. Click Show more to view the active and known bugs for the fabrics in the fabric group. |
Inventory
In the Inventory tile, you can view the summary of this information in the fabric group.
-
Member fabrics: Displays the number of member fabrics in the fabric group. Click this box to navigate directly to Inventory > Member fabrics for this fabric group.
-
Controllers: Displays the number of switches in the fabrics in the fabric group. Click this box to navigate directly to Inventory > Controllers for this fabric group.
-
Switches: Displays the number of switches in the fabrics in the fabric group. Click this box to navigate directly to Inventory > Switches for this fabric group.
-
VPC pairs: Displays the number of vPC pairs in the fabrics in the fabric group. Click this box to navigate directly to Inventory > vPC pairs for this fabric group.
-
Other devices: Displays the number of other devices in the fabrics in the fabric group. Click this box to navigate directly to Inventory > Other devices for this fabric group.
Interfaces
In the Interfaces tile, you can see the summary of the interfaces for the fabrics in the fabric group, including the number of switches that are in the Up, Down, or Admin Down state.
-
Click Physical to show only physical interfaces, or click All to show physical and virtual interfaces.
-
Click the link for the total number of interfaces in the fabric group to navigate directly to Connectivity > Interfaces for this fabric group. This provides additional details such as Anomaly Level, Admin Status, Operational Status, and Interface Type. Click the interface name to view additional details.
Analytics summary
These topics provide information on the Analytics summary area for fabric groups.
Guidelines and limitations: Analytics summary for fabric groups
-
There is no navigation directly from a fabric group’s Analytics summary area to the Analytics Hub page. However, you can navigate directly to the Analytics Hub page from the Analytics summary area from any member fabric in the fabric group.
-
If a report is not available at the fabric level (such as for conformance or energy management), you cannot trigger that report from the fabric level. Instead, you must trigger the report from the Analytics Hub page or from the member fabric level.
Analytics summary for fabric groups
In the Analytics Summary tile, you can see an overview of the multiple analytics collected from across the fabric group. Click the appropriate area in the Analytics Summary tile to view summarized views, similar to those displayed in the Overview > Analytics summary for a fabric.
It displays the status for these areas related to the fabric group.
-
Conformance: Displays aggregated status for member fabrics in the fabric group. Enables you to visualize and understand the lifecycle of your hardware and software in the network. This assists you in planning upgrades and hardware refresh. Conformance Report is generated everyday for each fabric group for hardware and software conformance and weekly for each fabric group for scale conformance. In the report you can view the conformance status of software, hardware, a combination of both software and hardware, and scale conformance status for fabric groups.
Click the Conformance box to bring up a slide-in pane that provides conformance information in these areas.
-
Devices by hardware conformance status
-
Devices by software conformance status
-
Scale conformance status for fabrics or switches
-
-
Traffic analytics: Displays an aggregated summary of traffic analytics information for member fabrics in the fabric group. Enables you to monitor your network’s latency, congestion, and drops.
Traffic Analytics automatically discovers services running in your network by matching well-known Layer 4 ports to their corresponding service endpoint categories. Nexus Dashboard then assesses service performance based on thresholds for the following metrics:
-
Latency: Measures the overall time in microseconds it takes a packet to go from one place to another.
-
Congestion: Measures network bandwidth utilization and quality of service (QoS) activation mechanisms to determine if a service is experiencing network congestion.
-
Drops: Measures the score or number of dropped packets versus transmitted packets considering factors such as CRC errors, faulty cables, and other devices.
Click the Traffic analytics box to bring up a slide-in pane that provides the traffic analytics summary.
-
-
Energy management: Displays aggregated values from all member fabrics in the fabric group. Helps you monitor, predict, and improve your network’s energy usage, its related carbon emissions, and its total energy cost. The energy management report enables you to get insights on energy utilization, CO2 emissions, and energy cost for all the fabrics in the fabric group on a monthly basis.
The report is generated by calculating the monthly values for Power Consumption and by summing the usage data across all of your devices at each of your fabrics for every single day in the chosen month. This data is then combined with the Cisco Energy Manager to provide greater insight into what that usage means in terms of energy cost, estimated emissions, and estimated switch power consumption. For more information about the Cisco Energy Manager, see Cisco Energy Manager.
Click Energy management to bring up a page that provides the energy management report for your fabric group. In addition, if no report is displayed, then you will have to generate the report for all the member fabrics in the fabric group through the Analyze > Analysis Hub > Energy management page.
Connectivity
In the Connectivity tile, you can view details about these areas related to this fabric group.
-
Endpoints: Displays the total number of endpoints from all member fabrics in the fabric group. Click the number of endpoints shown to navigate directly to Connectivity > Endpoints for this fabric group. See Endpoints for more information.
-
Inter-fabric: Displays the total number of inter-fabric links between member fabrics in the fabric group. Click the number of inter-fabric connections shown to navigate directly to Connectivity > Inter-fabric for this fabric group. See Inter-fabric for more information.
Segmentation and security
In the Segmentation and security tile, you can view details about these areas related to this fabric.
-
Tenants: Click the number of tenants shown to navigate directly to Segmentation and security > tenants for this fabric group.
-
VRFs: Click the number of VRFs shown to navigate directly to Segmentation and security > VRFs for this fabric group.
-
Security groups: Click the number of security groups shown to navigate directly to Segmentation and security > Security groups for this fabric group.
-
Networks: Click the number of networks shown to navigate directly to Segmentation and security > Networks for this fabric group.
Inventory
The Inventory tab lists all hardware assets managed within the fabrics in the fabric group, including switches and controllers. It allows you to monitor hardware resources, view capacity, and verify the operational status of each device in the network.
Follow these steps to navigate to the Inventory tab.
-
Navigate to the Fabric groups page.
Go to Manage > Fabrics > Fabric groups.
-
From the Fabric groups table, click a fabric group.
-
In the fabric group page, click Inventory.
The Inventory page displays the following tabs.
Member fabrics
The Member fabrics area is an Inventory page that is specific to fabric groups. It provides this information on the member fabrics in this fabric group.
| Field | Description |
|---|---|
|
Fabric name |
Specifies the names of the member fabrics in this fabric group. |
|
Type |
Specifies the types of member fabrics in this fabric group. |
|
Anomaly level |
Displays the anomaly levels of the fabrics in this fabric group, classified as Healthy, Critical, Major, Minor, and Warning, based on operational issues. |
|
Advisory level |
Displays the advisory levels of the fabrics in this fabric group, classified as Healthy, Critical, Major, or Warning, based on operational issues. |
|
License tier |
Displays the license tiers for the fabrics in this fabric group. |
|
ASN |
Displays the ASNs for the fabrics in this fabric group. |
|
Connectivity status |
Indicates whether the connectivity for the fabrics in this fabric group is Up or Down. |
|
Software version |
Specifies the software versions for the fabrics in this fabric group. |
|
Security group status |
Displays the status of the security groups for the fabrics in this fabric group. |
Switches
The information provided in the Switches page for fabric groups is an aggregation of the information from the Switches pages from the member fabrics in the fabric group.
These articles describe the fabric-level information provided on the Switches page:
VPC Pairs
The information provided in the VPC pairs page for fabric groups is an aggregation of the information from the VPC pairs pages from the member fabrics in the fabric group.
These articles describe the fabric-level information provided on the VPC pairs page:
Other devices
The information provided in the Other devices page for fabric groups is an aggregation of the information from the Other devices pages from the member NX-OS fabrics in the fabric group.
This article describes the NX-OS fabric-level information provided on the Other devices page:
Controllers
The information provided in the Controllers page for fabric groups is an aggregation of the information from the Controllers pages from the member ACI fabrics in the fabric group.
This article describes the ACI fabric-level information provided on the Controllers page:
Connectivity
The Connectivity tab provides a centralized location to manage and monitor the physical and logical connections for the fabrics in your fabric group. It allows you to verify that interfaces function correctly and traffic follows your defined policies.
Follow these steps to navigate to the Connectivity tab.
-
Navigate to the Fabric groups page.
Go to Manage > Fabrics > Fabric groups.
-
From the Fabric groups table, click a fabric group.
-
In the fabric group page, click Connectivity.
The Connectivity page displays the following tabs.
Interfaces
Click Interfaces to view the interfaces for fabric group, then click the appropriate sub category, depending on the fabric type in your fabric group:
NX Interfaces
The information provided in the NX Interfaces page for fabric groups is an aggregation of the information from the Interfaces pages from the member NX-OS fabrics in the fabric group.
This article describes the NX-OS fabric-level information provided on the Interfaces page:
ACI Interfaces
The information provided in the ACI Interfaces page for fabric groups is an aggregation of the information from the Interfaces pages from the member ACI fabrics in the fabric group.
This article describes the ACI fabric-level information provided on the Interfaces page:
Endpoints
The Endpoints page provides information on the endpoints learnt in each fabric in this fabric group. You can filter the results based on MAC address, IP addresses, hostname, anomaly level, interface, status, VRF instance, Layer 3 switches, and Layer 3 interfaces.
The information provided in the Endpoints page for fabric groups is an aggregation of the information from the Endpoints pages from the member fabrics in the fabric group. While there might be differences between endpoint information that is displayed at the ACI fabric and NX-OS fabric levels, at the fabric group level, the endpoint information that is displayed is a subset of the endpoint information that is common between the two fabric types. The endpoint information that is provided at the fabric group level is similar to the endpoint information that is displayed when you click on Active Endpoints in the global Overview page.
These articles describe the endpoints information at the individual fabrics level:
Guidelines and limitations: Endpoints in fabric groups
-
Endpoints information is not supported for multi-cluster fabric groups, so endpoints are not displayed in the endpoints table in the Endpoints tab under Connectivity for multi-cluster fabric groups. See Grouping fabrics for more information on multi-cluster fabric groups.
-
For single-cluster fabric groups, endpoints are displayed in the endpoints table in the Endpoints tab under Connectivity; however, Real Time Event Visualization (RTEV) information is not displayed in the endpoints table for single-cluster fabric groups.
Links
You can add links between border switches of different fabrics (inter-fabric links) or between switches in the same fabric (intra-fabric links). You can only create an inter-fabric connection (IFC) for a switch that is managed by Nexus Dashboard.
The information provided in the Links page for fabric groups is an aggregation of the information from the Links pages from the member NX-OS fabrics in the fabric group.
This article describes the NX-OS fabric-level information provided on the Links page:
Inter-fabric
Click Inter-fabric to view inter-fabric connections for the fabrics in this fabric group.
For the most part, the information provided in the Inter-fabric page for fabric groups is an aggregation of the information from the Inter-fabric pages from the member fabrics in the fabric group.
This information in the fabric group’s Inter-fabric page is specific to fabric groups.
| Field | Description |
|---|---|
|
Source fabric |
The source fabric in the inter-fabric connection. |
|
Source fabric group name |
The name of the fabric group that contains the source fabric in the inter-fabric connection. |
|
Destination fabric |
The destination fabric in the inter-fabric connection. |
|
Destination fabric group name |
The name of the fabric group that contains the destination fabric in the inter-fabric connection. |
The remaining information that is provided in the fabric group’s Inter-fabric page is an aggregation of the information from the Inter-fabric pages from the member fabrics in the fabric group.
These articles describe the fabric-level information provided on the Inter-fabric page:
While there might be differences between inter-fabric information that is displayed at the ACI fabric and NX-OS fabric levels, at the fabric group level, the inter-fabric information that is displayed is similar to what is displayed when you click on Inter-fabric in the global Overview page.
Flows
Flows provides deep insights at a flow level giving details such as average latency and packet drop indicator. It also raises anomalies when the latency of the flows increase or when packets get dropped because of congestion or forwarding errors.
Each flow has a packet counter representing the number of packets entering the ASIC for that flow over a period of time. This period of time is called aggregation interval. There are several points where flow statistics for a given flow can be aggregated. Aggregation can happen in the ASIC, switch software, and server software.
The Flows page in Nexus Dashboard displays the telemetry information collected from various devices in the fabric that were added to the fabric.
The information provided in the Flows page for fabric groups is an aggregation of the information from the Flows pages from the member fabrics in the fabric group.
These articles describe the fabric-level information provided on the Flows page:
Segmentation and security
The Segmentation and security page allows you to configure these areas:
-
VRFs (Virtual Routing and Forwarding)
-
Networks
-
Security groups or Endpoint Security Groups (ESGs)
-
Security contracts and associations
-
Protocol definitions
-
Tenants in the fabric segmentation and security context
Follow these steps to navigate to the Segmentation and security tab.
-
Navigate to the Fabric groups page.
Go to Manage > Fabrics > Fabric groups.
-
From the Fabric groups table, click a fabric group.
-
In the fabric group page, click Segmentation and security.
The Segmentation and security page displays the following tabs.
Guidelines and limitations: Segmentation and security for VXLAN-ACI fabric groups
You cannot configure L4-L7 services at the VXLAN-ACI fabric group level as you would at an NX-OS fabric level.
Networks
The information provided in the Networks page for fabric groups is an aggregation of the information from the Networks pages from the member fabrics in the fabric group and any networks that were created at the fabric group level.
This article describes the NX-OS fabric-level information provided on the Networks page:
VRFs
The information provided in the VRFs page for fabric groups is an aggregation of the information from the VRFs pages from the member fabrics in the fabric group and any VRFs that were created at the fabric group level.
This article describes the NX-OS fabric-level information provided on the VRFs page:
Security groups
The information provided in the Security groups page for fabric groups is an aggregation of the information from the Security groups pages from the member fabrics in the fabric group and any security groups that were created at the fabric group level.
This article describes the NX-OS fabric-level information provided on the Security groups page:
Security groups information in NX-OS fabrics
Support for any in VXLAN-ACI fabric groups
The any logical construct, which represents all the security groups and non-classified resources for a given VRF, was previously available for VXLAN fabric groups. Beginning with Nexus Dashboard release 4.3.1, the any logical construct is now available for VXLAN-ACI fabric groups as well. With this feature, the any logical construct is supported when creating a new VXLAN-ACI fabric group, as well as when importing ACI vzAny policies from an ACI fabric as an any logical construct in Nexus Dashboard. For more information on importing ACI vzAny policies from an ACI fabric, see Understanding the process for importing tenant policies from ACI fabrics into VXLAN-ACI fabric groups.
The any logical construct offers a convenient way of associating any traffic within a Virtual Routing and Forwarding (VRF) instance to a contract, which allows for communication without creating separate contract relations for each security group.
These are the advantages of using the any logical construct:
-
TCAM space is saved
-
Simplified configuration and maintenance
The any logical construct is created automatically when you choose either strict or loose in the Enable Security Group field under Security when editing a fabric group. The any logical construct is then displayed under Segmentation and security > Security groups for that fabric group.
any logical construct
These are the use cases for the any logical construct:
-
Any-to-Any intra-VRF communication: When creating a security association for the fabric group, choose:
-
Anyin the Source group field -
Anyin the Destination group field -
The same VRF in both the Source group VRF and the Destination group VRF fields
-
-
Any-to-Security Group in the same VRF: When creating a security association for the fabric group, choose:
-
Anyin the Source group field -
The appropriate security group in the Destination group field
-
The appropriate VRF for the
anylogical construct in the Source group VRF field
-
-
Security Group-to-Any in same VRF: When creating a security association for the fabric group, choose:
-
Anyin the Source group field -
The appropriate security group in the Destination group field
-
The appropriate VRF for the
anylogical construct in the Destination group VRF field
-
any logical construct
-
If a VRF is defined in tenant
common, then you can perform the security association involvinganyonly in tenantcommon. -
The
anylogical construct, along with security groups in general, are not supported in inter-VRF scenarios for VXLAN-ACI fabric groups.
Security contracts
The information provided in the Security contracts page for fabric groups is an aggregation of the information from the Security contracts pages from the member fabrics in the fabric group and any security contracts that were created at the fabric group level.
This article describes the NX-OS fabric-level information provided on the Security contracts page:
Security associations
The information provided in the Security associations page for fabric groups is an aggregation of the information from the Security associations pages from the member fabrics in the fabric group and any security associations that were created at the fabric group level.
This article describes the NX-OS fabric-level information provided on the Security associations page:
Protocol definitions
The information provided in the Protocol definitions page for fabric groups is an aggregation of the information from the Protocol definitions pages from the member fabrics in the fabric group and any protocol definitions that were created at the fabric group level.
This article describes the NX-OS fabric-level information provided on the Protocol definitions page:
Tenants
The information provided in the Tenants page for fabric groups is an aggregation of the information from the Tenants pages from the member fabrics in the fabric group and any tenants that were created at the fabric group level.
This article describes the NX-OS fabric-level information provided on the Tenants page:
Configuration policies
The Configuration policies tab allows you to manage and deploy CLI-based configuration templates to the switches within the fabrics in the fabric group. It applies settings such as interface breakouts and system features directly to the hardware.
Follow these steps to navigate to the Configuration policies tab.
-
Navigate to the Fabric groups page.
Go to Manage > Fabrics > Fabric groups.
-
From the Fabric groups table, click a fabric group.
-
In the fabric group page, click the Configuration policies tab.
The Configuration policies page displays the following tabs.
Guidelines and limitations: Configuration policies for fabric groups
-
A fabric group’s Configuration policies page displays information only for NX-OS fabrics.
-
Beginning with Nexus Dashboard Release 4.3, users with only the Observer role have access restrictions that prevent access to most device configuration settings. Conversely, users with other roles, including users assigned the Observer role in addition to other roles across various security domains, retain some access to view device configurations.
Policies
The information provided in the Policies page for fabric groups is an aggregation of the information from the Policies pages from the member NX-OS fabrics in the fabric group.
This article describes the NX-OS fabric-level information provided on the Policies page:
Resources
The information provided in the Resources page for fabric groups is an aggregation of the information from the Resources pages from the member NX-OS fabrics in the fabric group.
This article describes the NX-OS fabric-level information provided on the Resources page:
Anomalies
The Anomalies tab displays all detected anomalies within the fabrics in the fabric group. It organizes the anomalies by severity level and category, allowing you to filter and group events to identify and troubleshoot specific problems like hardware health issues.
Follow these steps to navigate to the Anomalies tab.
-
Navigate to the Fabric groups page.
Go to Manage > Fabrics > Fabric groups.
-
From the Fabric groups table, click a fabric group.
-
In the fabric group page, click the Anomalies tab.
The information provided in the Anomalies page for fabric groups is an aggregation of the information from the Anomalies pages from the member fabrics in the fabric group.
This article describes the fabric-level information provided on the Anomalies page for both ACI fabrics and NX-OS fabrics:
Advisories
Nexus Dashboard identifies field notices, software and hardware end-of-life and end-of-sale announcements, as well as security advisories that can potentially impact the network fabrics that it is monitoring, and generate advisories. Advisories provides recommendations to keep your network under support and running in optimal conditions.
Advisories in Nexus Dashboard provide details of relevant impact from field notices, security advisories, EoL/EoS of hardware and software, and best practices. You can view the advisories by level and category for a particular fabric based on the selected time range.
When Advisories identifies field notices that can potentially impact the network fabrics that it is monitoring, Nexus Dashboard validates the serial number of the devices in the fabrics against a list of affected device serial numbers in each field notice. If a serial number is not included in a field notice, Nexus Dashboard excludes that field notice. For Advisories to validate the device serial numbers, Nexus Dashboard must have an Internet connection and be connected to and registered to Cisco Intersight. Without such connectivity, Advisories cannot validate the serial numbers, which can result in Advisories incorrectly including field notices that do not apply. Not all field notices include serial number validation.
Follow these steps to navigate to the Advisories tab.
-
Navigate to the Fabric groups page.
Go to Manage > Fabrics > Fabric groups.
-
From the Fabric groups table, click a fabric group.
-
In the fabric group page, click the Advisories tab.
The information provided in the Advisories page for fabric groups is an aggregation of the information from the Advisories pages from the member fabrics in the fabric group.
This article describes the fabric-level information provided on the Advisories page for both ACI fabrics and NX-OS fabrics:
History
The History tab provides a comprehensive activity log of all actions taken within the fabrics in the fabric group. It provides details about audit logs, deployment history, policy change history, and system events in chronological order, which is essential for compliance, auditing, and tracking the root cause of configuration changes.
Follow these steps to navigate to the History tab.
-
Navigate to the Fabric groups page.
Go to Manage > Fabrics > Fabric groups.
-
From the Fabric groups table, click a fabric group.
-
In the fabric group page, click the History tab.
The History page displays the following tabs.
Guidelines and limitations: History for fabric groups
The Audit logs tab provides information for both ACI and NX-OS fabrics, whereas the Deployment history, Policy change history, and Recent tasks tabs provide information only for NX-OS fabrics.
Audit logs
The information provided in the Audit logs page for fabric groups is an aggregation of the information from the Audit logs pages from the member fabrics in the fabric group.
This article describes the fabric-level information provided on the Audit logs page for both ACI fabrics and NX-OS fabrics:
Deployment history
The information provided in the Deployment history page for fabric groups is an aggregation of the information from the Deployment history pages from the member fabrics in the fabric group.
This article describes the fabric-level information provided on the Deployment history page for NX-OS fabrics:
Policy change history
The information provided in the Policy change history page for fabric groups is an aggregation of the information from the Policy change history pages from the member fabrics in the fabric group.
This article describes the fabric-level information provided on the Policy change history page for NX-OS fabrics:
Recent tasks
The information provided in the Recent tasks page for fabric groups is an aggregation of the information from the Recent tasks pages from the member fabrics in the fabric group.
This article describes the fabric-level information provided on the Recent tasks page for NX-OS fabrics:
Editing fabric settings for fabric groups
Fabric groups
A fabric group is a multifabric container that is created to manage multiple member fabrics. A fabric group is a single point of control for definition of overlay networks and VRFs that are shared across member fabrics. When you move fabrics that are designated to be a part of the multifabric overlay network domain under the fabric group as member fabrics, the member fabrics share the networks and VRFs created at the fabric group-level. This way, you can consistently provision network and VRFs for different fabrics, at one go. It significantly reduces the time and complexity involving multiple fabric provisioning.
You can add a Data Center VXLAN EVPN fabric, VXLAN Multi-Site External Network fabric, or Campus EVPN VXLAN fabric as member fabrics in a fabric group.
As server networks and VRFs are shared across the member fabrics as one stretched network, provisioning new networks and VRFs is provided at the fabric group level. You can create new networks and VRFs only for the fabric group. All the member fabrics inherit any new network and VRF created for the fabric group.
The topology view for the fabric group displays all member fabrics, and how they are connected to each other, in one view. You can deploy overlay networks and VRFs on member fabrics from a single topology deployment screen, instead of deploying each member fabric separately.
These sections provide more information in these areas:
Considerations
-
The VXLAN OAM feature in Nexus Dashboard is only supported on a single fabric or site.
-
After you unpair a BGW vPC, perform a Recalculate Config and Deploy Config on the member fabric followed by a Recalculate Config and Deploy Config of the fabric group.
A few fabric-specific terms:
-
Standalone fabric - A fabric that is not part of a fabric group is referred as a standalone fabric from the fabric group perspective. Before the fabric group concept, all fabrics were considered standalone, though two or more such fabrics can be connected with each other.
-
Member fabrics - Fabrics that are part of a fabric group are called member fabrics or members. Create a standalone fabric first and then move it within a fabric group as a member fabric.
When a standalone fabric is added to the fabric group, the following actions take place:
-
The standalone fabric’s relevant attributes, network and VRF definitions are evaluated with that of the fabric group. If there are no conflicts, then the standalone fabric becomes a member fabric of the fabric group. If there is conflict, then adding a standalone fabric to the fabric group fails and the conflicts are logged in the pending errors log for the fabric group. You can resolve the conflicts and then add the standalone fabric to the fabric group again.
-
All the VRFs and networks definitions from the standalone fabric that do not have presence in the fabric group are copied over to the fabric group and in turn inherited to each of its other existing member fabrics.
-
The VRFs and networks (and their definitions) from the fabric group (such as the VRF of the fabric group, and L2 and L3 VNI parameters that do not have presence in the standalone fabric) are inherited into the standalone fabric that just became a member.
-
Nexus Dashboard does not support deploying fabric connectivity if the BGW link on the ACI side is configured as an uplink (fabric port). You must convert the BGW link to a downlink (access port) before the system allows the connectivity deployment.
Fabric and switch instance variables
While the fabric group provisions a global range of network and VRF values, some parameters are fabric-specific and some parameters are switch-specific. The parameters are called fabric instance and switch instance variables.
Fabric instance values can only be edited or updated using the VRFs and Networks configuration page for the fabric. Double-click the appropriate fabric to view Fabric Overview and go to Networks or VRFs tab. Some of the examples of fabric instance variables are BGP ASN, Multicast group per network or VRF, etc. For information about editing multicast group address, see Creating and deploying networks and VRFs in a fabric group.
You can edit the switch instance values after deploying the network on the switch. For example, VLAN ID.
Support for route servers for VXLAN-ACI fabric groups
A route server is essentially an IP reachable hub in a hub-and-spoke logical topology, where each fabric is an additional spoke connected to that route server hub.
The routeServer inter-fabric connection (IFC) deployment option in the Multi-Site Overlay IFC Deployment Method field was previously available for VXLAN fabric groups. Beginning with Nexus Dashboard release 4.3.1, the routeServer IFC deployment option is now available for VXLAN-ACI fabric groups as well.
When creating or editing a VXLAN or VXLAN-ACI fabric group, these are the areas where the route server configurations come into play:
-
In the Multi-Site Overlay IFC Deployment Method field, you can now choose
routeServeras an additional IFC deployment option. -
In the Multi-site route server list field, click Actions > Add to add the Route server IP and Route server ASN.

If the route server is discovered and is already configured with the given IP addresses, Nexus Dashboard will configure peering automatically on both the route server and the border gateway devices. However, if the route server is not imported or if the IP addresses aren’t configured in interfaces (loopbacks), then Nexus Dashboard will not configure peering.
Fabric groups and member fabric process flow
A fabric group has multiple member fabrics under a fabric group. VRFs and networks are created for the fabric group and get inherited by the member fabrics.
A high-level flow chart of the fabric group and member fabric creation and fabric group-to-member fabric inheritance process is depicted in the following figures:
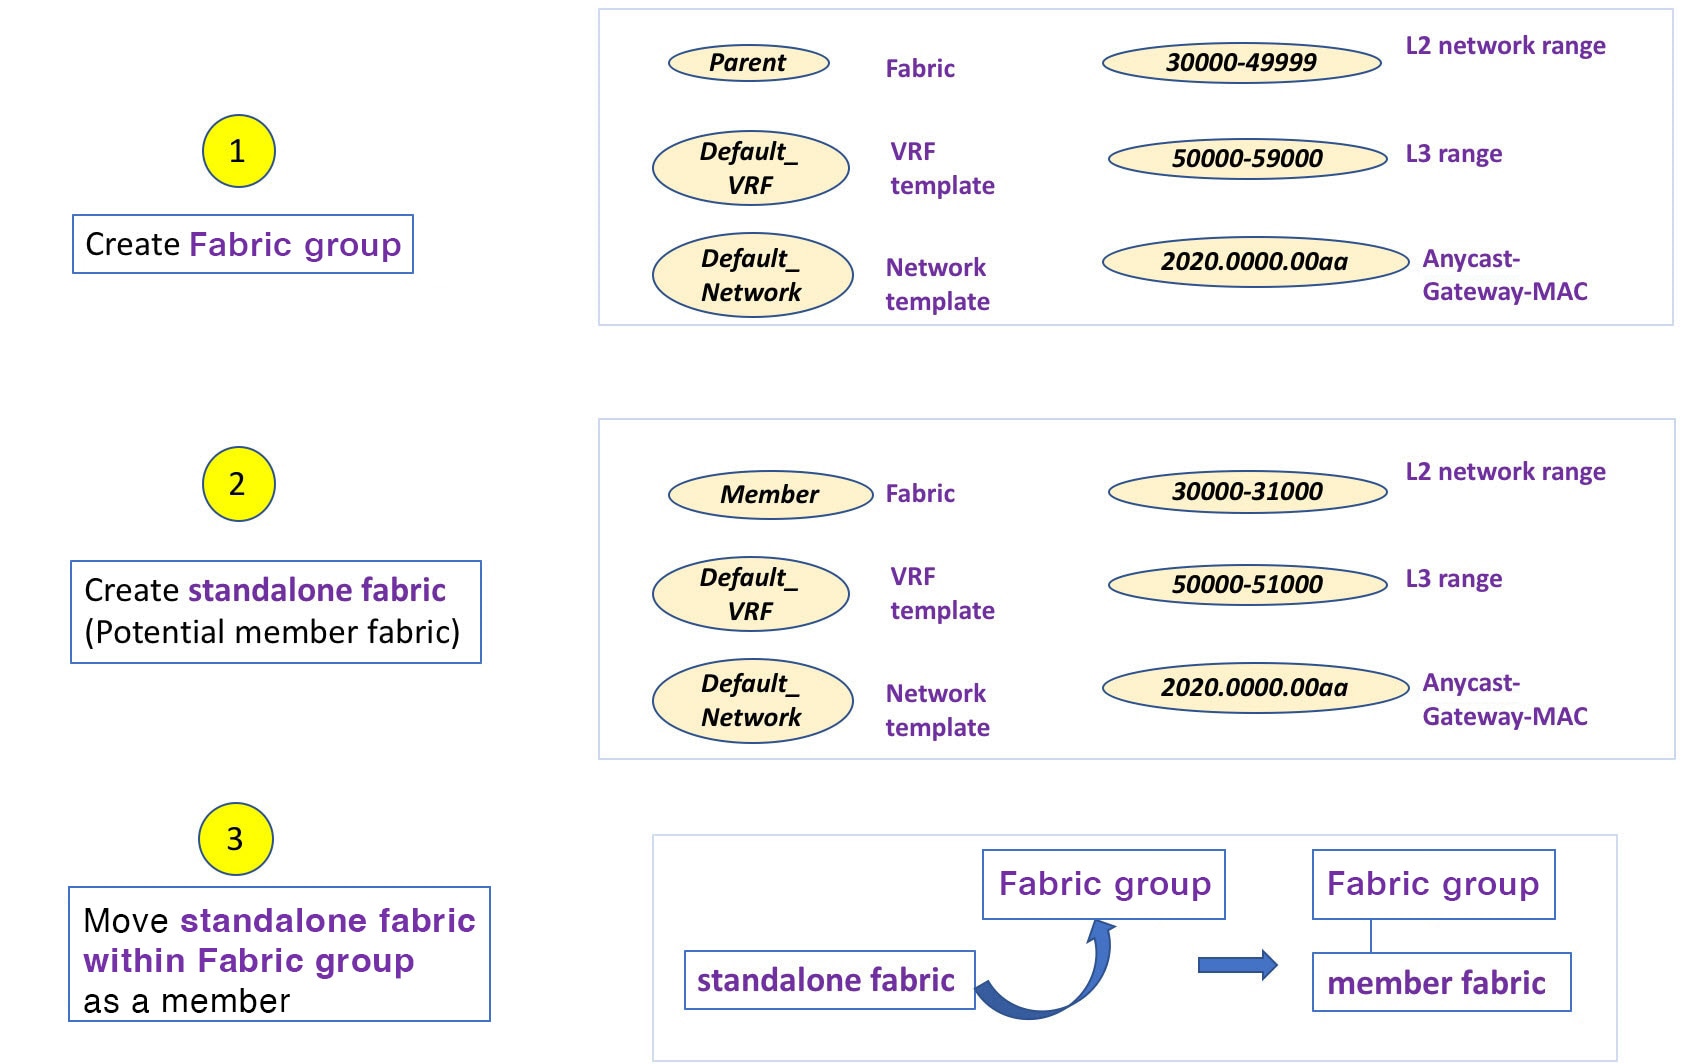
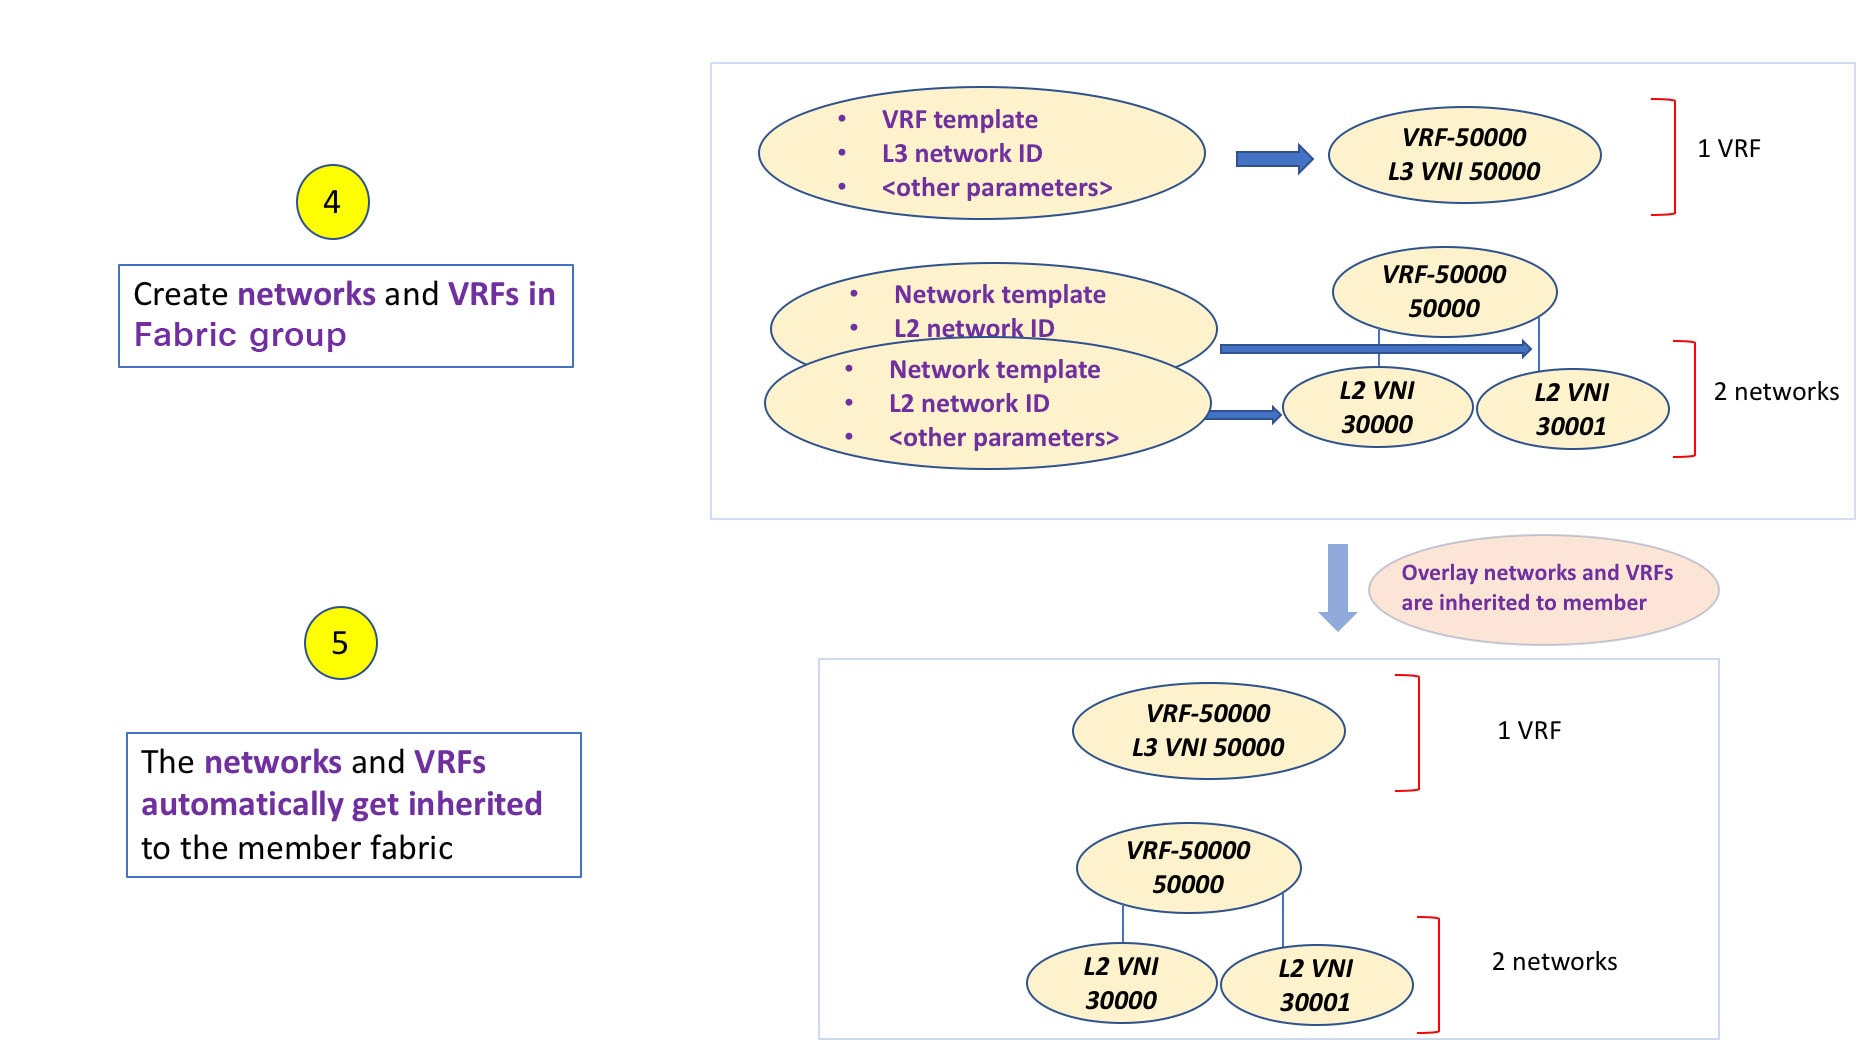
The sample flow explains the inheritance from the fabric group to one member. The following figure illustrates a sample flow from a fabric group to multiple members:
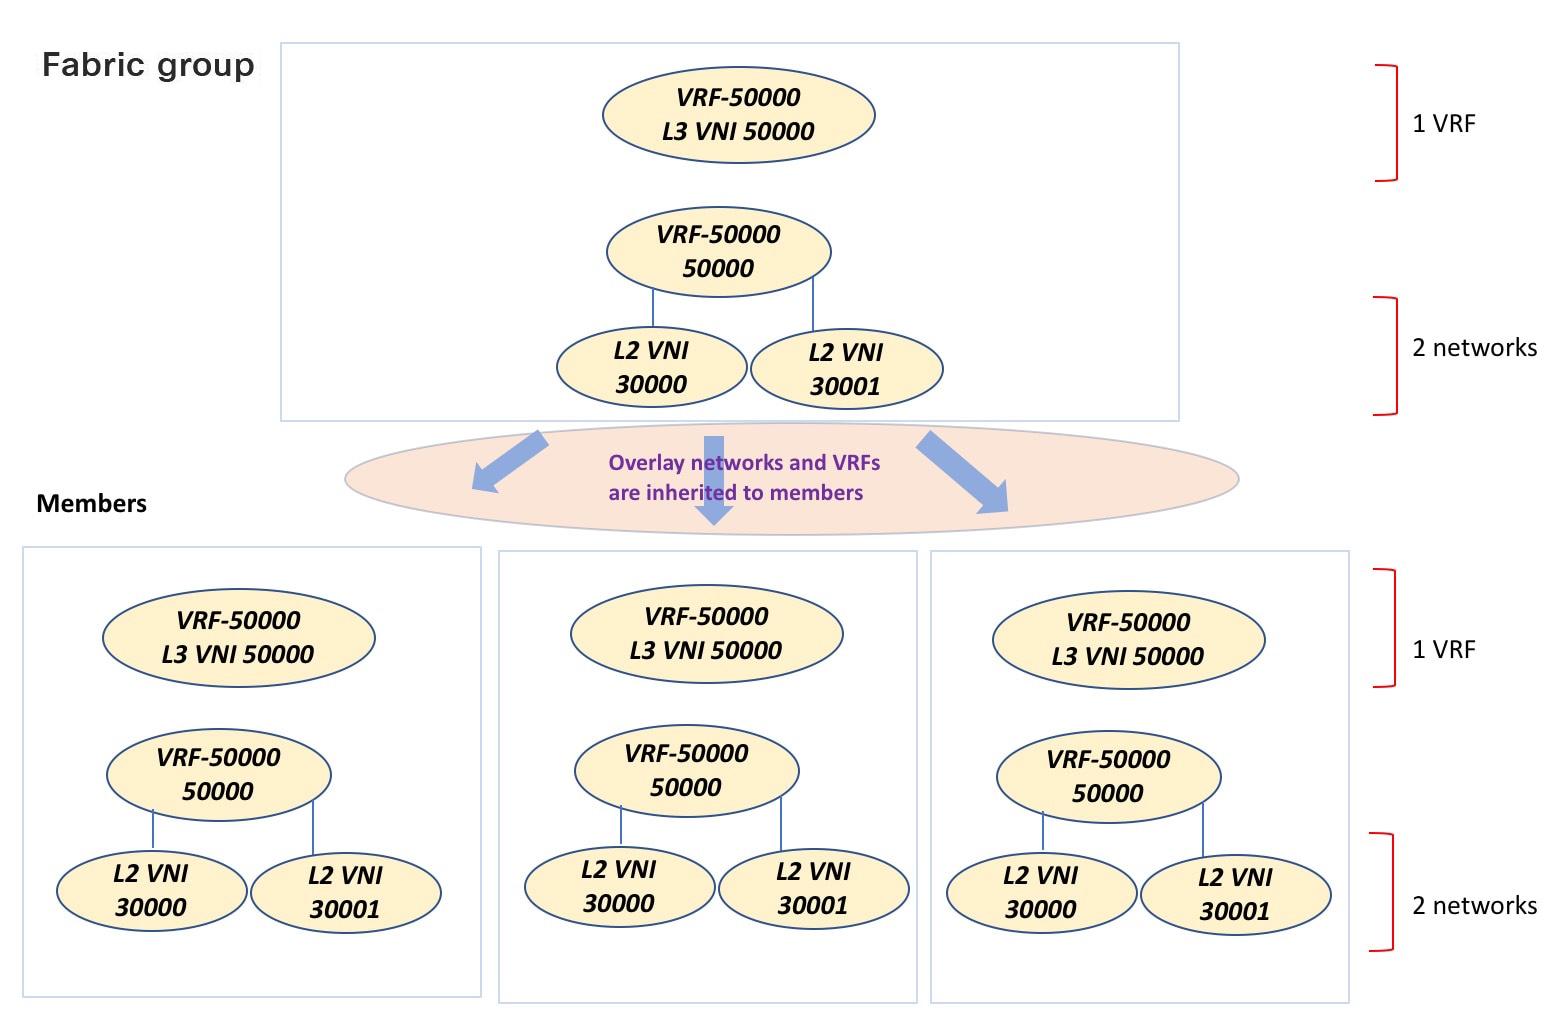
In this example, VRF-50000 (and L3 network with ID 50000), and L2 networks with IDs 30000 and 30001 are created in one go. Networks and VRFs are deployed on the member fabric switches, one after another, as depicted in the image.
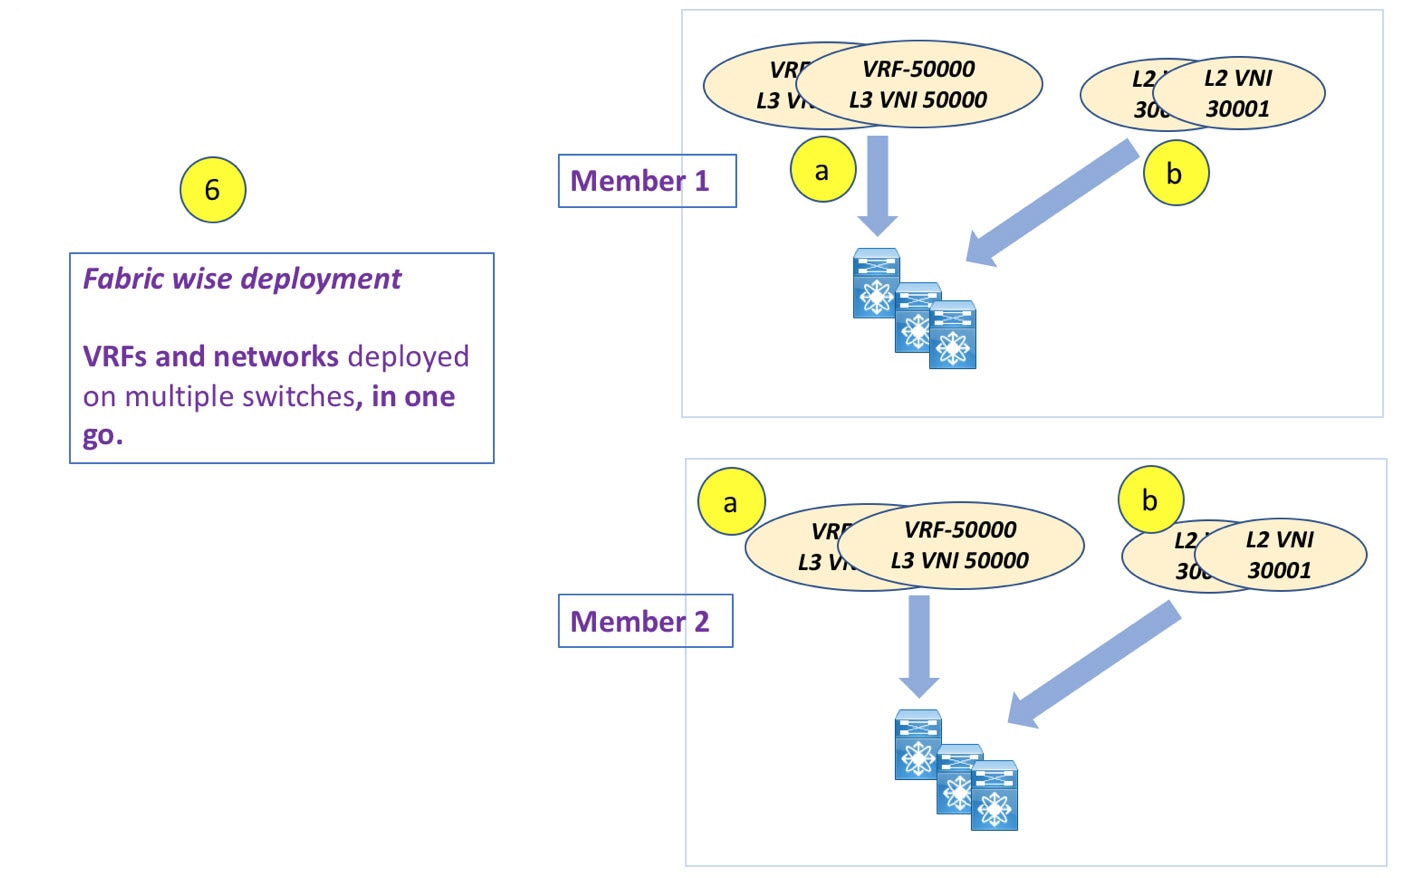
You can provision overlay networks through a single fabric group deployment screen.
If you move a standalone fabric with existing networks and VRFs to a fabric group, Nexus Dashboard validates for any conflicts. This is explained in detail in an upcoming section.
Upcoming sections in the document explain the following:
-
Creating a fabric group.
-
Creating a standalone fabric (as a potential member) and moving the fabric under the fabric group as a member.
-
Creating networks and VRFs in the fabric group and their inheritance to the member fabrics.
-
Deploying networks and VRFs from the fabric group and member fabric topology views.
-
Other scenarios when moving a fabric:
-
Standalone fabric with existing networks and VRFs to a fabric group.
-
Member fabric from one fabric group to another.
-
Editing fabric settings for fabric groups
Fabric groups allow you to create groups of fabrics to form a fabric group for simplified management.
When you first create a fabric group using the procedures provided in Creating Fabrics and Fabric Groups, the standard workflow allows you to create a fabric group using the bare minimum settings so that you are able to create a fabric group quickly and easily. Use the procedures in this article to make more detailed configurations for your fabric group.
-
Navigate to the main Fabrics page:
Manage > Fabrics
-
Click the Fabric Groups tab.
-
Locate the fabric group that you want to edit.
-
Click the circle next to the fabric group that you want to edit to select that fabric group, then click Actions > Edit Fabric Group Settings.
The Edit fabric_group_name Settings page appears.
The tabs and their fields on the page are explained in the subsequent sections. The overlay and underlay network parameters are included in these tabs.
General Parameters
All mandatory fields in the General Parameters tab are prefilled. Update the relevant fields as needed.
| Field | Description |
|---|---|
|
Layer 2 VXLAN VNI Range |
Specifies the Layer 2 VXLAN segment identifier range. |
|
Layer 3 VXLAN VNI Range |
Specifies the Layer 3 VXLAN segment identifier range. |
|
Enable Downstream VNI |
Allows member VXLAN fabrics to have a different VNI for the same VRF or network. For more information, see the section "Configuring downstream VNI" in Creating Fabrics and Fabric Groups. |
|
Layer 2 VXLAN VNI Global Range |
Specifies the overlay network VNI range for the fabric (min:1, max:16777214). |
|
Layer 3 VXLAN VNI Global Range |
Specifies the overlay VRF VNI range for the fabric (min:1, max:16777214). |
|
Enable IPv6 Underlay for VXLAN Fabric |
Enables using an IPv6 underlay when creating a VXLAN fabric group. By default, this field is not enabled. All VXLAN fabric groups use IPv4 addresses for underlay traffic if this field is not enabled. |
|
VRF Template |
Specifies the default VRF template for leaf devices. |
|
Network Template |
Specifies the default network template for leaf devices. |
|
VRF Extension Template |
Specifies the default VRF extension template for border devices. |
|
Network Extension Template |
Specifies the default network extension template for border devices. |
|
Enable Private VLAN (PVLAN) |
Enables private VLAN on a VXLAN fabric group and its child fabrics. |
|
PVLAN Secondary Network Template |
Specifies the default secondary PVLAN network template. |
|
Anycast-Gateway-MAC |
Specifies the anycast gateway MAC address. |
|
Multi-Site VTEP VIP Loopback Id |
Specifies the multisite routing loopback ID. |
|
Border Gateway IP TAG |
Routing tag associated with IP address of loopback and DCI interfaces |
What’s next: Complete the configurations in another tabs, if required, or click Save when you have completed the necessary configurations for this fabric.
DCI
| Field | Description |
|---|---|
|
Multi-Site Overlay IFC Deployment Method |
Defines how the data centers connect through the border gateways:
The The Multi-Site IFCs can be created between the border gateways in the VXLAN EVPN fabrics and router server in an external fabric, or back-to-back between border gateways in two VXLAN EVPN fabrics. If you configured the deployment method for Multi-Site Overlay IFC Deployment Method as
|
|
Multi-site route server list |
Specifies the IP addresses and Autonomous System Numbers (ASNs) of the route server. To add multi-site route servers to the list:
|
|
Enable 'redistribute direct' on route servers |
Enables auto-creation of multi-site overlay IFCs on route servers. This field is applicable only when you have configured the deployment method for Multi-Site Overlay as |
|
Route server IP tag |
Specifies the routing tag associated with the route server IP for redistribute direct. This is the IP used in eBGP EVPN peering. |
|
BGP neighbor description on multi-site overlay ifc |
Enables generation of BGP neighbor description for new auto-created multi-site overlay IFCs. Change in this field has no impact on existing IFCs. |
|
Multi-site underlay ifc auto deployment flag |
Enables auto configuration. Uncheck the check box for manual configuration.
|
|
Delay restore time |
Specifies the Multi-Site underlay and overlay control planes convergence time. The minimum value is 30 seconds and the maximum value is 1000 seconds. |
Click the Security tab.
Security
| Field | Description |
|---|---|
|
Enable Security Groups |
Choose the way that you want to enable security groups in this fabric group:
Check this check box to enable a security group with an IPv4-only underlay and using the CLI Overlay Mode. For more information on security groups, see Working with Segmentation and Security for Your Nexus Dashboard VXLAN Fabric. |
|
Security Group Name Prefix |
Specify the prefix to use when creating a new security group. |
|
Security Group Tag (SGT) ID Range (Optional) |
Specify a tag ID for the security group if necessary. |
|
Security Groups Pre-Provision |
Check this check box to generate a security groups configuration for non-enforced VRFs. |
|
Multi-Site CloudSec |
Enables CloudSec configurations on border gateways. If you enable this field, the remaining three fields for CloudSec are editable. For more information, see Support for CloudSec in fabric group deployment. |
|
CloudSec Key String |
Specifies the Cisco Type 7 encrypted octet key string. |
|
CloudSec Cryptographic Algorithm |
Choose AES_128_CMAC or AES_256_CMAC for the encryption type. |
|
CloudSec Enforcement |
Specifies whether the CloudSec enforcement should be strict or loose.
There should be at least two fabrics in a VXLAN fabric group with border gateways that support CloudSec. If there is only one fabric with a CloudSec capable device, then the following error message is generated: |
|
CloudSec Status Report Timer |
Specifies the CloudSec Operational Status periodic report timer in minutes. This value specifies how often the Nexus Dashboard polls the CloudSec status data from the switch. The default value is 5 minutes and the range is from 5 to 60 minutes. |
Click the Resources tab.
Resources
| Field | Description |
|---|---|
|
Multi-Site VTEP VIP Loopback IP Range |
Specifies the Multi-Site loopback IP address range used for the EVPN Multi-Site function. A unique loopback IP address is assigned from this range to each member fabric because each member site must have a Multi-site Routing Loopback IP address assigned for overlay network reachability. The per-fabric loopback IP address is assigned on all the BGWs in a specific member fabric. |
|
DCI Subnet IP Range |
Specifies the Data Center Interconnect (DCI) subnet IP address. |
|
Subnet Target Mask |
Specifies the DCI subnet mask. |
Configuration Backup
| Field | Description |
|---|---|
|
Scheduled Fabric Backup |
Enables daily backup. This backup tracks changes in the running configuration of the fabric devices that are not tracked by configuration compliance. |
|
Scheduled Time |
Specifies the scheduled backup time in 24-hour format. This field is enabled if you check the Scheduled Fabric Backup check box. Select both the check boxes to enable both back up processes. |
Associating member fabrics
Creating and moving a new fabric under the fabric group as a member
As a best practice, when you create a new fabric that is a potential member fabric of the fabric group, do not add networks and VRFs to the fabric. Move the fabric under the fabric group and then add networks and VRFs for the fabric group. This eliminates the need for validation or conflict resolution between the member and fabric group network and VRF parameters.
The following are some points to consider while creating a standalone member fabric:
The parameter values in the Resources tab are automatically generated. The VXLAN VNI ID ranges in the L2 Segment ID Range and L3 Partition ID Range fields allocated for new network and VRF creation are values from the fabric group segment ID range. If you want to update the VXLAN VNI ranges or the VRF and Network VLAN ranges, consider the following:
-
Ensure that the new range does not overlap with the other range of values.
-
Update one range of values at a time. If you want to update more than one range of values, do it as separate instances. For example, if you want to update L2 and L3 ranges, you should do the following:
-
Update the L2 range and click Save.
-
Click Edit Fabric again, update the L3 range and click Save.
-
-
Ensure that Anycast Gateway MAC, Network Template and VRF Template field values are the same as the fabric group. Else, moving the member fabric to the fabric group fails.
Other pointers to consider:
-
The member fabric should have a Site ID configured and the Site ID must be unique among the members.
-
The BGP AS number should be unique for a member fabric.
-
The underlay subnet range for loopback0 should be unique.
-
The underlay subnet range for loopback1 should be unique.
Moving the Member1 fabric under fabric group-parent-fabric
Go to the fabric group Overview to associate a member fabric under it.
-
Click on the fabric group to view the Overview page.
-
Choose Inventory > Child Fabrics.
-
In the Child Fabrics page, choose Actions > Move fabric in to fabric group.
You can also associate a member fabric to a fabric group by navigating to the Overview page for that fabric group and clicking Actions > Add child fabric.
A list of child fabrics that are not part of any fabric group appears. Member fabrics of other fabric group container fabrics are not displayed here.
-
As Member1 fabric is to be associated with the fabric group, select the Member1 fabric and click Select.
-
Select the Fabric and click Select.
You can see that Member1 is now added to fabric group and is displayed in the Child Fabrics in the Fabrics list table.
Fabric group topology view pointers
The Topology tab displays the configured fabric groups and their child fabrics.
-
Fabric group topology view — Fabric group and their member fabrics displayed. A boundary defines each member fabric. All fabric devices of the fabric are confined to the boundary.
Double click on the member fabric to view further elements.
-
Member fabric topology view - A member fabric and its switches are displayed. In addition, the connected external fabric is displayed.
-
A boundary defines a standalone VXLAN fabric, and each member fabric in the fabric group. A fabric’s devices are confined to the fabric boundary. You can move a switch icon by dragging it. For a better user experience, in addition to switches, Nexus Dashboard allows you to move an entire fabric. To move a fabric, place the cursor within the fabric boundary (but not on a switch icon), and drag it in the desired direction.
Adding and editing links
To add a link, choose Actions > More > Add Link. To edit a link, choose Actions > More > Edit Link.
To know how to add links between border switches of different fabrics (inter-fabric links) or between switches in the same fabric (intra-fabric links), refer to the Fabric Links topic.
Additional settings
The following sections provide information for additional settings that might be necessary when editing the settings for a fabric group.
Creating and deploying networks and VRFs in a fabric group
In standalone fabrics, networks and VRFs are created for each fabric. In a fabric group, networks and VRFs should be created at the fabric group level. The networks and VRFs are inherited by all the member networks. You cannot create or delete networks and VRFs at the individual member fabric level; however, you can edit them.
For example, consider a fabric group with two member fabrics. If you create three networks in the fabric group, then all three networks will automatically be available for deployment in both the member fabrics.
Though member fabrics inherit the fabric group’s networks and VRFs, you have to deploy the networks and VRFs distinctly, for each fabric.
A deployment view is introduced for the fabric group, in addition to the per-fabric deployment view. In this view, you can view and provision overlay networks for all member fabrics within the fabric group, at once. However, you still have to apply and save network and VRF configurations distinctly, for each fabric.
Networks and VRFs are the common identifiers (represented across member fabrics) that servers (or end hosts) are grouped under so that traffic can be sent between the end hosts based on the network and VRF IDs, whether they reside in the same or different fabrics. Since they have common representation across member fabrics, networks and VRFs can be provisioned at one go. As the switches in different fabrics are physically and logically distinct, you have to deploy the same networks and VRFs separately for each fabric.
For example, if you create networks 30000 and 30001 for a fabric group that contains two member fabrics, the networks are automatically created for the member fabrics and are available for deployment.
You can deploy 30000 and 30001 on the border devices of all member fabrics through a single (fabric group) deployment screen. Prior to this, you had to access the first member fabric deployment screen, deploy 30000 and 300001 on the fabric’s border devices, and then access the second member fabric deployment screen and deploy again.
Networks and VRFs are created in the fabric group and deployed in the member fabrics. The steps are explained below:
-
Create networks and VRFs in the fabric group.
-
Deploy the networks and VRFs in the member fabric devices.
Creating networks in the fabric group
Some guidelines and pointers:
-
You can edit the Network Profile part (General and Advanced tabs) of the fabric group network.
-
A fabric group can contain multiple fabrics. These fabrics forward BUM traffic via Multicast or Ingress replication. Even if all the fabrics use multicast for BUM traffic, the multicast groups within these fabrics need not be the same.
-
When you create a network in fabric group, it is inherited by all the member fabrics. However, the multicast group address is a fabric instance variable. To edit the multicast group address, you need to navigate to the member fabric and edit the network. For more information about the Multicast Group Address field, see Creating Networks for the Standalone Fabric.
-
You can only delete networks from the fabric group, and not member fabrics. You must undeploy the networks on the respective fabric devices before deletion.
-
When you delete networks from the fabric group, the networks are automatically removed from the member fabrics too.
Creating VRFs in the fabric group
You cannot delete VRFs at the member fabric level. Delete VRFs in the fabric group. The deleted VRFs are automatically removed from all member fabrics.
See Creating VRF.
Deleting networks and VRFs in the fabric group and member fabrics
You can only delete networks from the fabric group, and not member fabrics. To delete networks and corresponding VRFs in the fabric group, follow this order:
-
Undeploy the networks on the respective fabric devices before deletion.
-
Delete the networks from the fabric group.
-
Undeploy the VRFs on the respective fabric devices before deletion.
-
Delete the VRFs from the fabric group. You can delete multiple VRF instances at once.
When you delete VRFs from the fabric group, they are automatically removed from the member fabrics too.
Moving a standalone fabric with existing networks and VRFs to a fabric group
If you move a standalone fabric with existing networks and VRFs to a fabric group as a member, ensure that common networks (L2 VNI and L3 VNI), anycast gateway MAC, and VRF and network templates are the same across the fabric and the fabric group. Nexus Dashboard validates the standalone fabric with the network and VRF information of the fabric group to avoid conflict entries. An example of conflict entries is two common network names with a different network ID. After validation, the standalone fabric is moved to the fabric group as a member fabric only if there are no conflicts.
The following are the different points to consider while moving a fabric under a fabric group:
-
A fabric group inherits the networks and VRFs of the standalone fabric that do not exist in the fabric group. These networks and VRFs are in turn inherited by the member fabrics.
-
A newly created member fabric inherits the networks and VRFs of the fabric group that do not exist in the newly created member fabric.
-
If there are conflicts between the standalone and fabric groups, validation ensures that an error message is displayed. You can move the standalone fabric to the fabric group again after updating the fabric configuration. If the move is successful, a message appears at the top of the page indicating that the move is successful.
-
If you move a member fabric from a fabric group to a standalone fabric, the networks and VRFs remain as they are.
Support for CloudSec in fabric group deployment
CloudSec feature allows secured data center interconnect in a fabric group deployment by supporting source-to-destination packet encryption between border gateway devices in different fabrics.
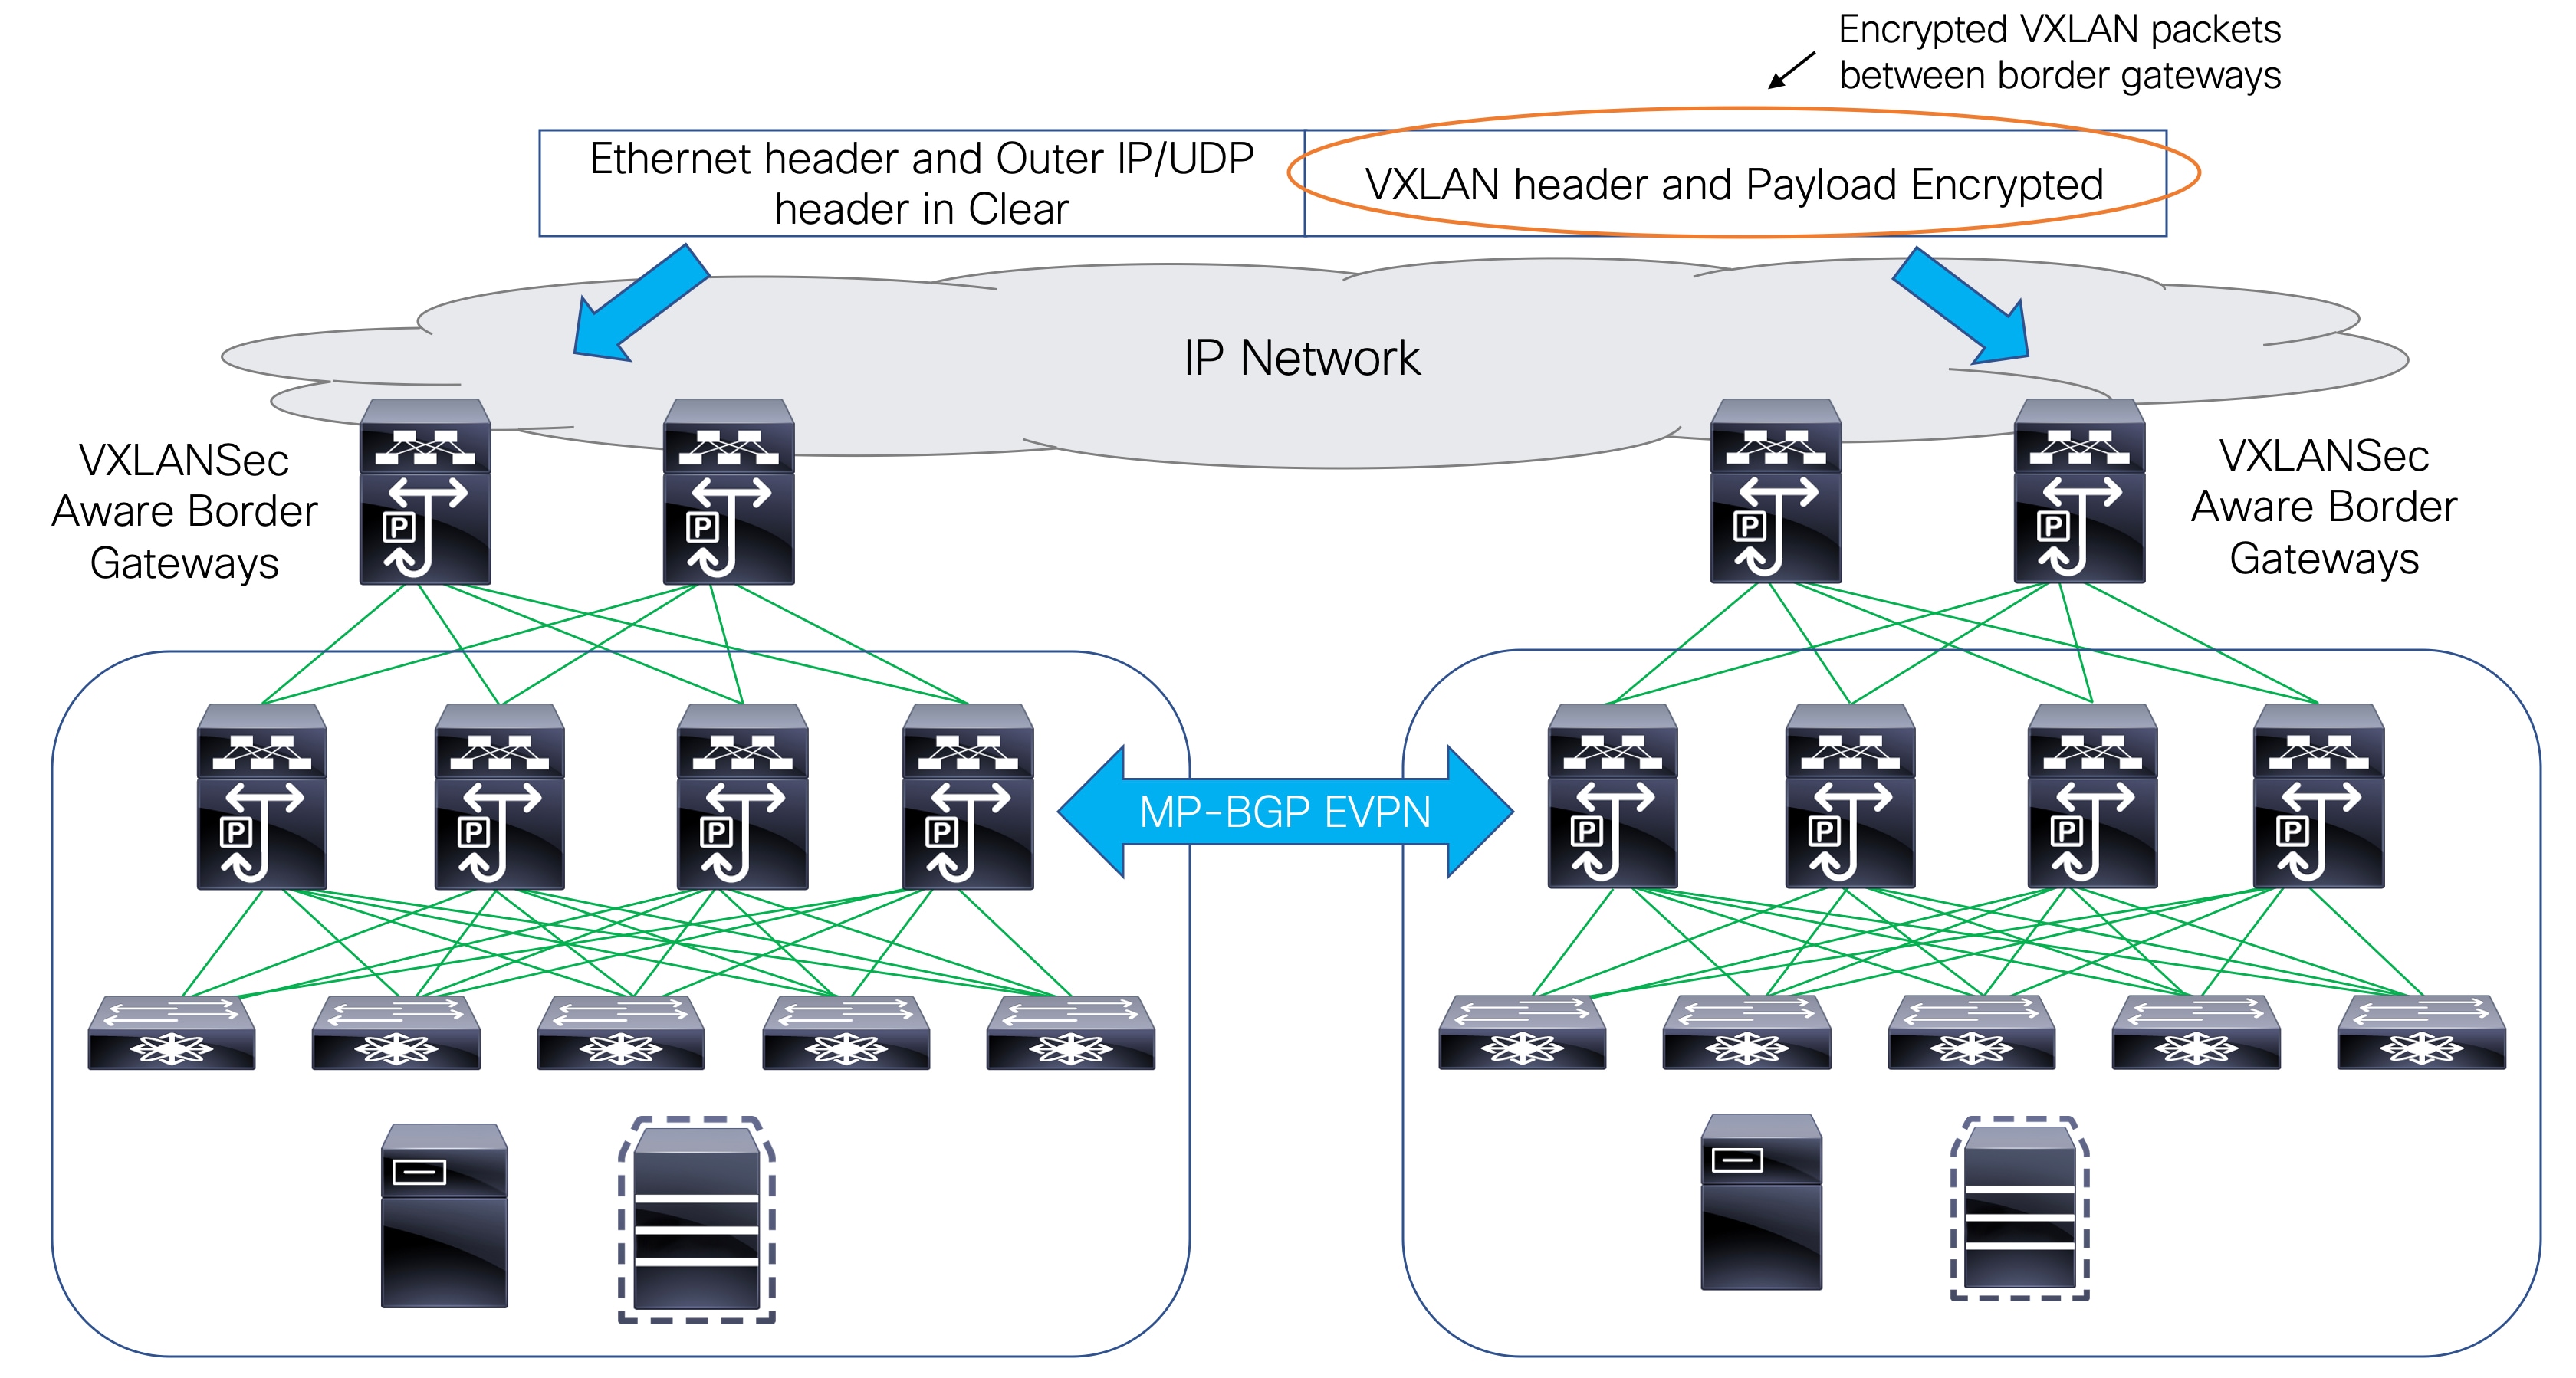
The CloudSec feature is supported on these platforms:
-
Cisco N9000 Series FX2 platform with Cisco NX-OS Release 9.3(5) or later
-
Cisco N9000 Series FX3 platform with Cisco NX-OS Release 10.1(1) or later
The border gateways, border gateway spines, and border gateway super spines that are FX2 platforms, and run Cisco NX-OS Release 9.3(5) or later are referred as CloudSec capable switches.
You can enable CloudSec while creating a fabric group.
The CloudSec session is point to point over DCI between border gateways (BGWs) on two different sites. All communication between sites uses fabric group PIP instead of VIP. Enabling CloudSec requires a switch to move from VIP to PIP, which could cause traffic disruption for data flowing between sites. Therefore, it is recommended to enable or disable CloudSec during a maintenance window.
Refer to the "Guidelines and Limitations for Secure VXLAN EVPN Multi-Site Using CloudSec" section in the latest Cisco N9000 Series NX-OS VXLAN Configuration Guide for the guidelines and limitations for Secure VXLAN EVPN fabric group using CloudSec.
Enabling CloudSec in a fabric group
When you add or remove CloudSec configuration from the switch, the DCI uplinks flaps and triggers multisite BGP session flapping. For multisite with existing cross-site traffic, there will be traffic disruption during this transition. Therefore, it is recommended to make the transition during a maintenance window.
-
In Cisco Nexus Dashboard Fabric Controller, choose Manage > Fabrics > Fabric Groups.
-
Create a new fabric group by choosing Actions > Create Fabric Group or edit an existing fabric group by choosing Actions > Edit Fabric.
-
In the DCI tab, configure the following CloudSec configuration parameters and click Save.
Field Description Multi-Site CloudSec
Enables CloudSec configurations on border gateways.
When Cloudsec is enabled at fabric group level, Nexus Dashboard also enables dci-advertise-pip under evpn multisite border-gateway and tunnel-encryption on the uplinks for all Cloudsec capable gateways.
When you perform Recalculate & Deploy, you can verify these configs in the Preview Config window for the border gateway switches.
CloudSec is not supported if the border gateway has TRM enabled on it (that is, if TRM is enabled on the multisite overlay IFC). If CloudSec is enabled in this scenario, appropriate warning or error messages are generated.
CloudSec Key String
Specifies the hex key string. Enter a 66 hexadecimal string if you choose AES_128_CMAC or enter a 130 hexadecimal string if you choose AES_256_CMAC.
CloudSec Cryptographic Algorithm
Choose AES_128_CMAC or AES_256_CMAC.
CloudSec Enforcement
Specifies whether the CloudSec enforcement should be strict or loose.
-
strict - Deploys the CloudSec configuration to all the border gateways in fabrics in fabric group. If there are any border gateways that don’t support CloudSec, then an error message is generated, and the configuration isn’t pushed to any switch.
If you select strict, the tunnel-encryption must-secure CLI is pushed to the CloudSec enabled gateways within fabric group.
-
loose - Deploys the CloudSec configuration to all the border gateways in fabrics in fabric group. If there are any border gateways that do not support CloudSec, then a warning message is generated. In this case, the CloudSec config is only deployed to the switches that support CloudSec. If you select loose, the tunnel-encryption must-secure CLI is removed, if it exists.
There should be at least two fabrics in fabric group with border gateways that support CloudSec. If there is only one fabric with a CloudSec capable device, then the following error message is generated: "CloudSec needs to have at least 2 sites that can support CloudSec." To remove this error, make sure you have at least two sites that can support CloudSec or disable CloudSec.
CloudSec Status Report Timer
Specifies the CloudSec Operational Status periodic report timer in minutes. This value specifies how often the Nexus Dashboard polls the CloudSec status data from the switch. The default value is 5 minutes and the range is from 5 to 60 minutes.
-
Using the CloudSec feature in Nexus Dashboard, you can have all the gateways within the fabric group to use the same keychain (and have only one key string) and policy. You can provide one key chain string for Nexus Dashboard to form the key chain policy. Nexus Dashboard forms the encryption-policy by taking all the default values. Nexus Dashboard pushes the same key chain policy, the same encryption-policy, and encryption-peer policies to each CloudSec capable gateways. On each gateway, there is one encryption-peer policy for each remote gateway that is CloudSec capable, using the same keychain and same key policy.
If you don’t want to use the same key for the whole fabric group or want to enable CloudSec on a subset of all sites, you can use switch_freeform to manually push the CloudSec config to the switches.
Capture all the CloudSec config in switch_freeform.
For example, the below config is included in the switch_freeform policy:
feature tunnel-encryption
evpn multisite border-gateway 600
  dci-advertise-pip
tunnel-encryption must-secure-policy
tunnel-encryption policy CloudSec_Policy1
tunnel-encryption source-interface loopback20
key chain CloudSec_Key_Chain1 tunnel-encryption
  key 1000
    key-octet-string 7 075e731f1a5c4f524f43595f507f7d73706267714752405459070b0b0701585440
    cryptographic-algorithm AES_128_CMA
tunnel-encryption peer-ip 192.168.0.6
  keychain CloudSec_Key_Chain1 policy CloudSec_Policy1
Add tunnel-encryption in the Freeform Config of the uplink interface policy which will generate config similar to the following:
interface ethernet1/13
  no switchport
  ip address 192.168.1.14/24 tag 54321
  evpn multisite dci-tracking
  tunnel-encryption
  mtu 9216
  no shutdown
For more information, see Enabling Freeform Configurations on Fabric Switches.
If you’re migrating a fabric group with the CloudSec configuration into Nexus Dashboard, the Cloudsec related configuration is captured in switch_freeform and interface freeform config. You do not need to turn on Multi-Site Cloudsec in the fabric group setting. If you want to add more fabrics and establish CloudSec tunnels which share the same CloudSec policy including key as the existing one, then you can enable the CloudSec config in the fabric group settings. The CloudSec parameters in the fabric group setting need to match the existing CloudSec configuration on the switch. The CloudSec configuration is already captured in the freeform config, and enabling CloudSec in fabric group also generates config intents resulting in two intents. For example, if you want to change the CloudSec key in the fabric group settings, you need to remove the CloudSec freeform config because Nexus Dashboard does not modify config in the switch_freeform. Otherwise, the key in the fabric group settings is a conflict with the key in the freeform config.
Viewing CloudSec Operational State
You can use CloudSec Operational View to check the operational status of CloudSec sessions, if CloudSec is enabled on the fabric group.
-
Choose a fabric group.
The fabric topology window appears.
-
Select Actions > Detailed View.
-
On the Link tab, click the CloudSec Operational View tab.
If CloudSec is disabled, the CloudSec Operational View tab does not appear.
The following table describes the fields that appear on the Operational View tab.
Fields Description Fabric Name
Specifies the fabrics that have a CloudSec session.
Session
Specifies the fabrics and border gateway switches involved in the CloudSec session.
Link State
Specifies the status of the CloudSec session. It can be in one of the following states:
-
Up: Indicates that the CloudSec session is successfully established between the switches.
-
Down: Indicates that the CloudSec session isn’t operational.
Uptime
Specifies the duration of uptime for the CloudSec session. Specifically, it’s the uptime since the last Rx and Tx sessions flapped, and the smaller value among the 2 sessions is displayed.
Oper Reason
Specifies the reason for the CloudSec session down state.
After CloudSec is enabled on a fabric, the operational status may not be available until after sessions are created, and the next status poll occurs.
-
Troubleshooting a CloudSec session
If a CloudSec session is down, you can find more information about it using Programmable Reports.
-
Cisco Nexus Dashboard Fabric Controller, choose Analyze > Reports.
-
Click Create Report.
-
Specify a unique name for the report in the Report Name field.
-
From the Select Template drop-down list, select fabric_cloudsec_oper_status and click Select.
-
Click Next to view the Source & Recurrence tab.
-
In the Recurrence field, choose the frequency at which the report job should run.
-
In the Email Report To field, enter an email ID or mailer ID if you want the report in an email.
You must configure SMTP settings in Admin > System Settings > Server Settings > SMTP tab. If the Data service IP address is in a private subnet, the static management route for SMTP server must be added in Cisco Nexus Dashboard cluster configuration.
-
In the Select fabric(s) table, select the fabric group on which the report job should run.
-
Click Save.
The report job will be executed at the configured interval.
Troubleshoot fabric group deployment
A deployment failure occurs when Nexus Dashboard identifies overlapping IPv4 addresses during the Recalculate & Deploy process.
For example, Delivery failed with message: overlapping network for ipv4 address: 10.30.1.1/30 on eth1/1, 10.30.1.1/30 already configured on eth1/9.
This error occurs when you remove an external fabric from a fabric group but do not perform a Recalculate & Deploy on that external fabric to clear its settings. Nexus Dashboard retains the underlay IP configurations on the switches. If you re-add the fabric to the group and the system does not detect the Inter-Site Network (ISN) to ACI links using telemetry, the fabric group fails to reserve or clear these IP addresses, resulting in a configuration conflict.
Follow these steps to resolve the conflict and deploy the fabric group.
-
Remove the external fabric — If the fabric is currently a member of the fabric group, remove it.
-
Clear stale configurations — Navigate to the external fabric and perform a Recalculate & Deploy. This ensures that Nexus Dashboard clears the previous underlay IP intents.
-
Manual cleanup (if required) — If the error persists after the deployment, manually remove the conflicting IP addresses from the specific switch interfaces identified in the error message.
-
Re-associate the fabric — Add the external fabric back into the fabric group.
-
Deploy the fabric group — Perform a Recalculate & Deploy at the fabric group level to re-establish the links and IP reservations.
Copyright
THE SPECIFICATIONS AND INFORMATION REGARDING THE PRODUCTS IN THIS MANUAL ARE SUBJECT TO CHANGE WITHOUT NOTICE. ALL STATEMENTS, INFORMATION, AND RECOMMENDATIONS IN THIS MANUAL ARE BELIEVED TO BE ACCURATE BUT ARE PRESENTED WITHOUT WARRANTY OF ANY KIND, EXPRESS OR IMPLIED. USERS MUST TAKE FULL RESPONSIBILITY FOR THEIR APPLICATION OF ANY PRODUCTS.
THE SOFTWARE LICENSE AND LIMITED WARRANTY FOR THE ACCOMPANYING PRODUCT ARE SET FORTH IN THE INFORMATION PACKET THAT SHIPPED WITH THE PRODUCT AND ARE INCORPORATED HEREIN BY THIS REFERENCE. IF YOU ARE UNABLE TO LOCATE THE SOFTWARE LICENSE OR LIMITED WARRANTY, CONTACT YOUR CISCO REPRESENTATIVE FOR A COPY.
The Cisco implementation of TCP header compression is an adaptation of a program developed by the University of California, Berkeley (UCB) as part of UCB’s public domain version of the UNIX operating system. All rights reserved. Copyright © 1981, Regents of the University of California.
NOTWITHSTANDING ANY OTHER WARRANTY HEREIN, ALL DOCUMENT FILES AND SOFTWARE OF THESE SUPPLIERS ARE PROVIDED “AS IS" WITH ALL FAULTS. CISCO AND THE ABOVE-NAMED SUPPLIERS DISCLAIM ALL WARRANTIES, EXPRESSED OR IMPLIED, INCLUDING, WITHOUT LIMITATION, THOSE OF MERCHANTABILITY, FITNESS FOR A PARTICULAR PURPOSE AND NONINFRINGEMENT OR ARISING FROM A COURSE OF DEALING, USAGE, OR TRADE PRACTICE.
IN NO EVENT SHALL CISCO OR ITS SUPPLIERS BE LIABLE FOR ANY INDIRECT, SPECIAL, CONSEQUENTIAL, OR INCIDENTAL DAMAGES, INCLUDING, WITHOUT LIMITATION, LOST PROFITS OR LOSS OR DAMAGE TO DATA ARISING OUT OF THE USE OR INABILITY TO USE THIS MANUAL, EVEN IF CISCO OR ITS SUPPLIERS HAVE BEEN ADVISED OF THE POSSIBILITY OF SUCH DAMAGES.
Any Internet Protocol (IP) addresses and phone numbers used in this document are not intended to be actual addresses and phone numbers. Any examples, command display output, network topology diagrams, and other figures included in the document are shown for illustrative purposes only. Any use of actual IP addresses or phone numbers in illustrative content is unintentional and coincidental.
The documentation set for this product strives to use bias-free language. For the purposes of this documentation set, bias-free is defined as language that does not imply discrimination based on age, disability, gender, racial identity, ethnic identity, sexual orientation, socioeconomic status, and intersectionality. Exceptions may be present in the documentation due to language that is hardcoded in the user interfaces of the product software, language used based on RFP documentation, or language that is used by a referenced third-party product.
Cisco and the Cisco logo are trademarks or registered trademarks of Cisco and/or its affiliates in the U.S. and other countries. To view a list of Cisco trademarks, go to this URL: https://www.cisco.com/go/trademarks. Third-party trademarks mentioned are the property of their respective owners. The use of the word partner does not imply a partnership relationship between Cisco and any other company. (1110R)
© 2017-2026 Cisco Systems, Inc. All rights reserved.
Americas Headquarters
Cisco Systems, Inc.
170 West Tasman Drive
San Jose, CA 95134-1706
USA
https://www.cisco.com
Tel: 408 526-4000
800 553-NETS (6387)
Fax: 408 527-0883