
New and changed information
The following table provides an overview of the significant changes up to this current release. The table does not provide an exhaustive list of all changes or of the new features up to this release.
| Release Version | Feature | Description |
|---|---|---|
|
Nexus Dashboard 4.3.1 |
Detecting Anomalies and Identifying Advisories in Your Nexus Dashboard article now split into two articles |
Prior to this release, a single Detecting Anomalies and Identifying Advisories in Your Nexus Dashboard article provided information on both anomalies and advisories. Beginning with this release, that information is now split into two separate articles:
|
|
Nexus Dashboard 4.3.1 |
Fabric group support |
Beginning with Nexus Dashboard release 4.3.1, you can now view anomaly information at the fabric group level. For more information, see View anomalies for a fabric group. |
|
Nexus Dashboard 4.3.1 |
Anomaly enhancements and suppression |
Beginning with Nexus Dashboard release 4.3.1, Nexus Dashboard includes anomaly enhancements that help you:
|
Anomalies
Nexus Dashboard proactively detects different types of anomalies across the network, analyzes the anomalies, and identifies remediation methods.
Nexus Dashboard collects and analyzes data from all nodes within the fabric, establishing a baseline to define "normal" behavior. Deviations from this baseline are flagged as anomalies. This allows you to focus on resolving issues rather than tracking them. Furthermore, Nexus Dashboard can assess the anomaly’s impact and provide tailored recommendations based on its nature, thereby reducing the mean time to troubleshooting and resolution (MTTR). This helps in accelerated troubleshooting, enhanced operational efficiency, and effective remediation.
The Anomalies page displays the anomalies by level and category for your fabrics, based on the chosen time range.
-
The Anomaly level donut chart displays the total number of anomalies of Critical, Major, Minor, and Warning severities.
-
The Category list displays the number of anomalies grouped by various categories, such as Hardware, Capacity, Compliance, Connectivity, Configuration, GPU, Integrations, Active bugs, Telemetry configuration, and System.
About CRC Anomalies
Cyclic redundancy check (CRC) anomalies are raised when the CRC error count exceeds the configured percentage of total packets received within a 60-minute interval. If the CRC error count reaches 5% of total packets received, the anomaly severity is set to Warning. If the CRC error rate exceeds 7%, the severity becomes Major. If the CRC error rate exceeds 10%, the severity becomes Critical.
Understand anomaly correlation
The anomaly correlation functionality identifies cause-and-effect relationships between various anomalies within a specific time frame. It examines attributes such as device, interface, and protocols to pinpoint the root cause anomaly. This root cause anomaly acts as the primary issue that triggers the secondary anomalies, known as correlated anomalies. This approach helps in pinpointing the root cause, enabling efficient resolution of related issues.
Root cause anomalies
A root cause anomaly is an anomaly that causes other anomalies, which are referred to as correlated anomalies. Resolving the root cause anomaly should resolve the correlated anomalies.
Correlated anomalies
When a root cause anomaly occurs, it can trigger additional issues in Nexus Dashboard, known as correlated anomalies. These correlated anomalies arise because of the effects or disruptions that the root cause anomaly creates. To prevent or resolve the correlated anomalies that follow, you must identify and address the root cause anomaly.
With Nexus Dashboard 4.2.1, anomaly correlation supports route events for both NX-OS switches and ACI fabrics, providing more comprehensive root cause analysis across your network. For each correlated anomaly, Nexus Dashboard assigns a confidence score between 50% and 100% to indicate the certainty of the root cause relationship. Higher scores reflect stronger evidence of correlation.
When you investigate correlated anomalies, you can use the new analysis filters to focus on specific event types. Nexus Dashboard also displays the last seen time for each anomaly, which provides context about how long an issue has persisted.
Beginning with Nexus Dashboard 4.3.1, for ACI fabric software updates, Nexus Dashboard can correlate anomalies that occur during the update window with the related software update events. When at least one related anomaly is generated and correlated, a software update event can appear in the Root Events table and in the correlation graph as the root event for anomalies generated during the update window.
Software update correlation does not include software update events for Tier-2 leaf switches. If a Tier-2 leaf switch is upgraded, Nexus Dashboard does not correlate the related anomalies with the software update event. Similarly, if upgrading a parent leaf switch causes a Node Inactive anomaly for a connected Tier-2 leaf switch, Nexus Dashboard does not correlate that anomaly with the parent leaf switch software update event. In these cases, the software update event or the related anomaly might not appear in the Root Events table or in the correlation graph. Use the software update details and the anomaly details page to investigate the update and anomaly.
For controller updates, Nexus Dashboard creates a software update event for each controller in the cluster and attaches the related impacts, such as controller unreachable or APIC collection failure, to the corresponding controller event. For spine or leaf update groups, Nexus Dashboard creates a group-level event and node-level events for the updated switches, and displays related node impacts under the corresponding node-level event.
When you open a related anomaly, the overview panel displays the related software update event and associated anomalies. To view more details about the software update event, the affected controller or switch, and the related anomalies, open the full correlation graph. Use the software update workflow to monitor update progress, and use anomaly correlation to investigate anomalies related to the update.
The following are common examples of root cause and correlated anomaly relationships:
-
Admin shut event (root cause) and AM Route Delete event (correlated)
-
Interface Down (root cause) and AM Route Delete event (correlated)
-
OSPF Neighbor Lost (root cause) and OSPF Route Delete event (correlated)
-
AM/OSPF Route Delete event (root cause) and BGP Neighbor Down (correlated)
-
BGP Neighbor Down (root cause) and BGP Route Delete event (correlated)
-
Route Delete event (root cause) to Service Endpoint Traffic Score Unhealthy (Forward drop)
-
Route Delete event (root cause) to Endpoint Traffic Score Unhealthy (Forward drop)
-
Controller Unreachable (root cause) and Node Inactive events (correlated)

When the controller becomes unreachable, the fabric nodes continue to operate normally. However, because Nexus Dashboard depends on the controller for node state information, it may raise Node Inactive anomalies for nodes that are still active. In this scenario, the Controller Unreachable anomaly is the root cause, and the Node Inactive anomalies are correlated anomalies. Resolving the controller reachability issue clears the correlated Node Inactive anomalies.
-
AM route refers to a route learned through the Adjacency Manager.
-
In ACI fabrics, the auto-state feature controls the Switch Virtual Interface (SVI) down behavior and is disabled by default. When Nexus Dashboard disables auto-state, the SVI stays up even if the underlying interface goes down. This behavior can impact anomaly correlation and root cause analysis because the SVI status may not accurately reflect the actual state of the underlying interfaces. To improve accuracy in anomaly correlation and root cause analysis, enable the auto-state feature on the L3Out SVIs.
Software update correlation window
For anomalies and events generated during a software update on a leaf switch, spine switch, or APIC, the correlation window starts two minutes before the update begins, remains active while the upgrade is in progress, and ends two minutes after the update completes. Anomalies and events outside this window are not associated with the software update event, reducing unrelated correlations.
Uncorrelated anomalies
An uncorrelated anomaly neither causes correlated anomalies nor results from a root cause anomaly. Therefore, it does not affect any other anomalies. You must resolve each uncorrelated anomaly individually.
An uncorrelated anomaly can also be an anomaly that Nexus Dashboard does not yet evaluate for correlated anomalies. Nexus Dashboard will be able to evaluate these anomalies for correlated anomalies in a future release.
Anomaly levels
Anomalies are classified into the following levels based on their severity and impact.
-
Critical — Anomalies are shown as critical when the network is down. Some of the examples include:
-
When connectivity to a given prefix or endpoint is lost
-
When a fabric or switch is not operational.
-
-
Major — Anomalies are shown as major when connectivity to a given prefix or endpoint could be compromised. An example includes:
-
Overlapping IP addresses or subnets
-
-
Minor — Anomalies are classified as minor when they represent less severe issues that do not immediately impact network connectivity but may require attention. Examples include:
-
Interface errors or packet drops below threshold
-
Non-critical hardware component warnings
-
-
Warning — Anomalies are shown as warnings when there are best practice violations or when components such as power supply units (PSUs) are non-redundant.
Anomaly properties
You can configure these properties on an anomaly:
-
Assign a user
-
Add tags
-
Add a comment
-
Set verification status
-
Acknowledge an anomaly so that the acknowledged anomalies are not displayed in the Anomalies table
-
Suppress anomalies that are not relevant to your environment
For more information, see Configure anomaly properties.
You can acknowledge anomalies in these ways.
-
Manually acknowledge an anomaly. See Configure anomaly properties.
-
Manually acknowledge multiple anomalies. See Analyze anomalies.
-
Use anomaly rules to automatically acknowledge anomalies matching anomaly rules. See Create anomaly rules.
Navigate to Anomalies
You can efficiently monitor and investigate anomalies in Nexus Dashboard at different levels such as across all fabrics, for a specific fabric, for a specific switch, or for system-wide anomalies. Use the following methods to access anomaly details.
View all anomalies across all fabrics
Follow these steps to view all anomalies across all fabrics.
-
Navigate to Analyze > Anomalies.
This displays all anomalies detected across all fabrics in your environment.
View anomalies for a single fabric
Follow these steps to view the anomalies for a single fabric.
-
Navigate to Home > Overview.
-
Choose online fabrics or snapshots fabrics from the drop-down list.
-
Click the Anomaly level card.
-
In the Anomalies page, click Analyze Anomalies to view detailed information for the selected fabric.
-
You can also view the anomalies for a single fabric in the Fabrics Overview page.
-
Navigate to Manage > Fabrics.
-
Choose an appropriate fabric.
The Fabric Overview page displays.
-
Click the Anomalies tab to view anomalies specific to that fabric.
-
View anomalies for a fabric group
Follow these steps to view the anomalies for a fabric group.
-
Navigate to Manage > Fabrics > Fabric groups.
-
Click the appropriate fabric group from the list of fabric groups.
The Overview page for that fabric group appears.
The anomaly summary value displayed in the Overview page is an aggregation of the anomaly value of the fabric group and its member fabrics.
-
Click the Anomalies tab to view anomalies specific to that fabric group.
-
Fabric group-level anomalies list the fabric group name in the Fabric column.
-
Anomalies belonging to member fabrics list the member fabric name in the Fabric column.
-
Sort and search by fabric name is supported.
-
View anomalies for a single switch
Follow these steps to view the anomalies for a single switch in the Inventory page.
-
Navigate to Manage > Inventory.
-
Choose online fabrics or snapshot fabrics from the drop-down list.
-
Choose a switch.
The Switch Overview page displays.
-
Click the Anomalies tab.
View system anomalies
Follow these steps to view the system anomalies.
-
Navigate to Admin > System Status.
-
Click the Anomalies tab.
See Reviewing System Status for Your Nexus Dashboard for more information.
Analyze anomalies
Follow these steps to analyze anomalies.
-
From the drop-down list, choose Grouped, Ungrouped, or Root events.
-
The Ungrouped view displays the individual anomalies raised for your fabrics.
-
The Grouped view displays the aggregated view of the anomalies based on the anomaly type.
-
The Root events table displays root events that cause dependent anomalies. You can view root events until Nexus Dashboard deletes them, which happens only after it deletes all the associated dependent anomalies.
-
-
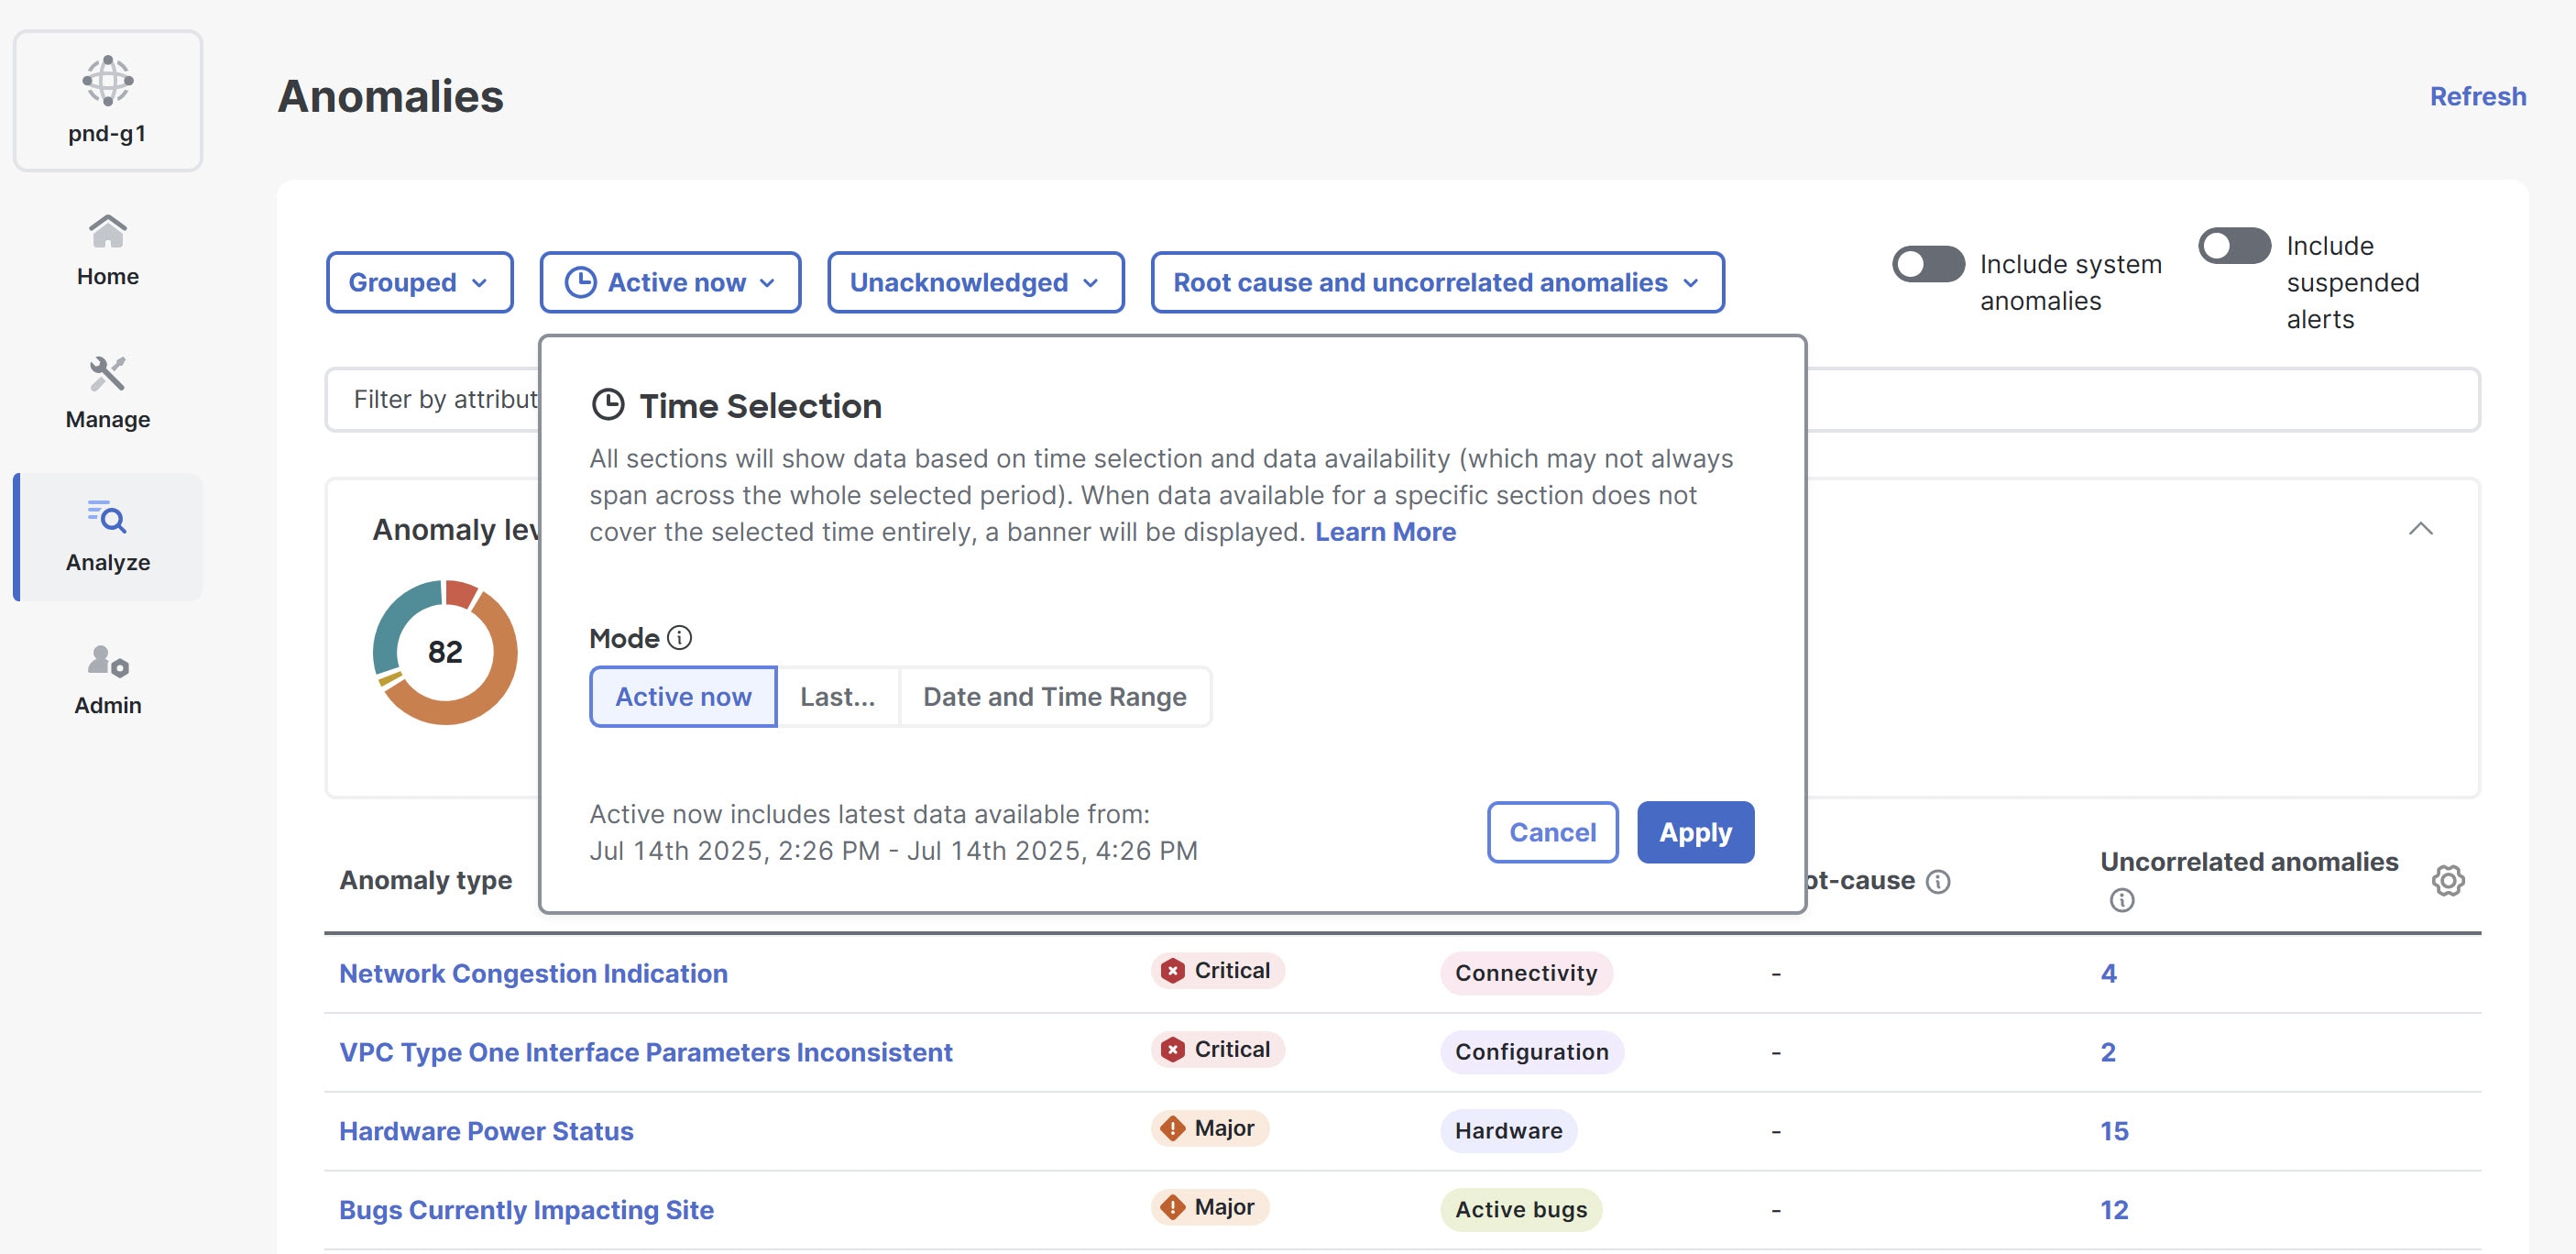
Go to Active now > Time Selection to choose the date and time range. By default, Active now is chosen. You can customize the date and time range to determine the data displayed in the Anomalies table.
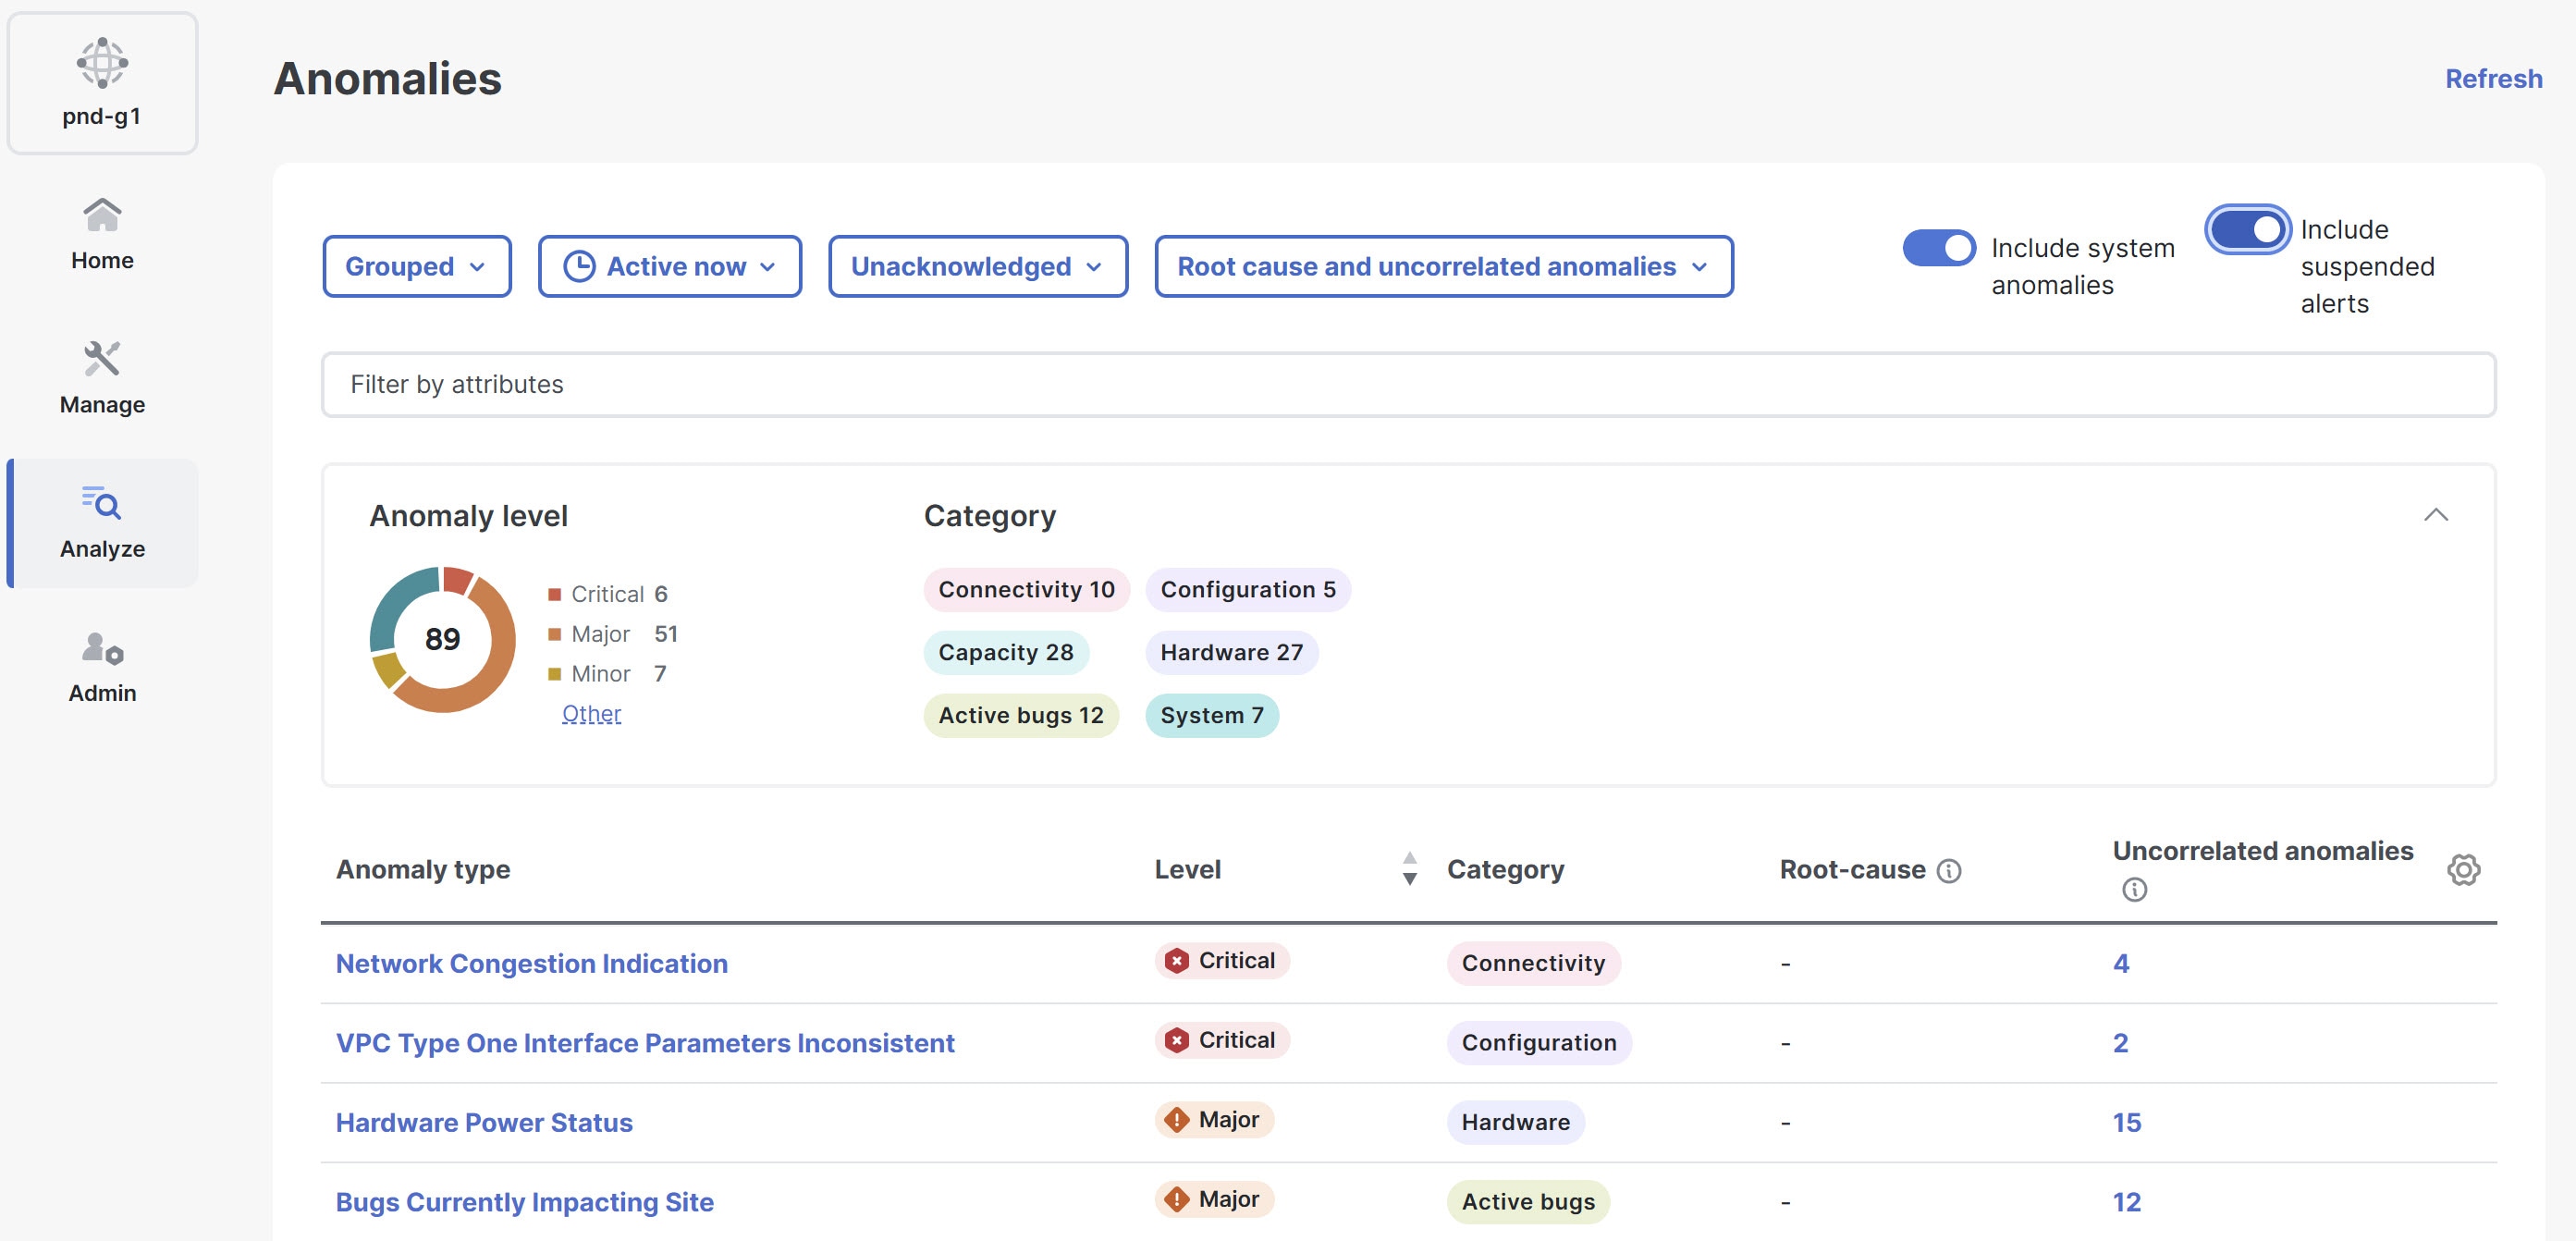
The Anomalies page displays the anomalies by level and category for your fabrics, based on the chosen time range.
-
The Anomaly level donut chart displays the total number of anomalies of Critical, Major, Minor, and Warning severities.
-
The Category list displays the number of anomalies grouped by various categories, like Hardware, Capacity, Compliance, Connectivity, Configuration, GPU, Integrations, Active bugs, Telemetry configuration, and System.

-
For snapshot fabrics, the anomalies shown represent all detected anomalies across all snapshots, not just those from the latest snapshot.
-
-
If you want to include system anomalies in the Anomalies table, click the Include system anomalies toggle button. Note that the System category appears in the Category list only when you enable the Include system anomalies toggle button.
For more information, see View platform and system alerts in global anomalies table.
-
If you want to include suspended alerts, click the Include suspended alerts toggle button.
For more information, see Alerts suspend mode for anomalies and advisories.
-
Use the filter field to filter the anomalies. You can filter affected objects like interface, VRF instance, EPG, or BD and view the associated anomalies.
-
When you view the ungrouped anomalies, you can use the drop-down list next to the filter field to filter for unacknowledged or acknowledged anomalies. The default is Unacknowledged.
-
You can use the drop-down list next to the unacknowledged and acknowledged anomalies drop-down list to filter by root cause and uncorrelated anomalies, root cause anomalies only, uncorrelated anomalies only, or all anomaly types. The default is All anomaly types.
For more information about the filters, see Anomaly filters.
-
-
The Anomalies table displays the filtered anomalies. By default, the anomalies are sorted by level. Click the column heading to sort the anomalies in the table.
When you view the ungrouped anomalies and configure the table to display the Status column, the status appears as either Active or Cleared. An Active status means the anomaly is present in your network, while a Cleared status means the anomaly is no longer present.
-
Click the gear icon to configure which columns display in the Anomalies table.
By default, the columns Anomaly type, Level, Category, Root-cause, and Uncorrelated anomalies are displayed for grouped anomalies. The Root-cause column shows how many anomalies in that group are root cause anomalies.
By default, the columns What’s wrong, Level, Category, Fabric, Detection time, and Correlated anomalies/events are displayed for ungrouped anomalies.
-
Click an anomaly to view more information.
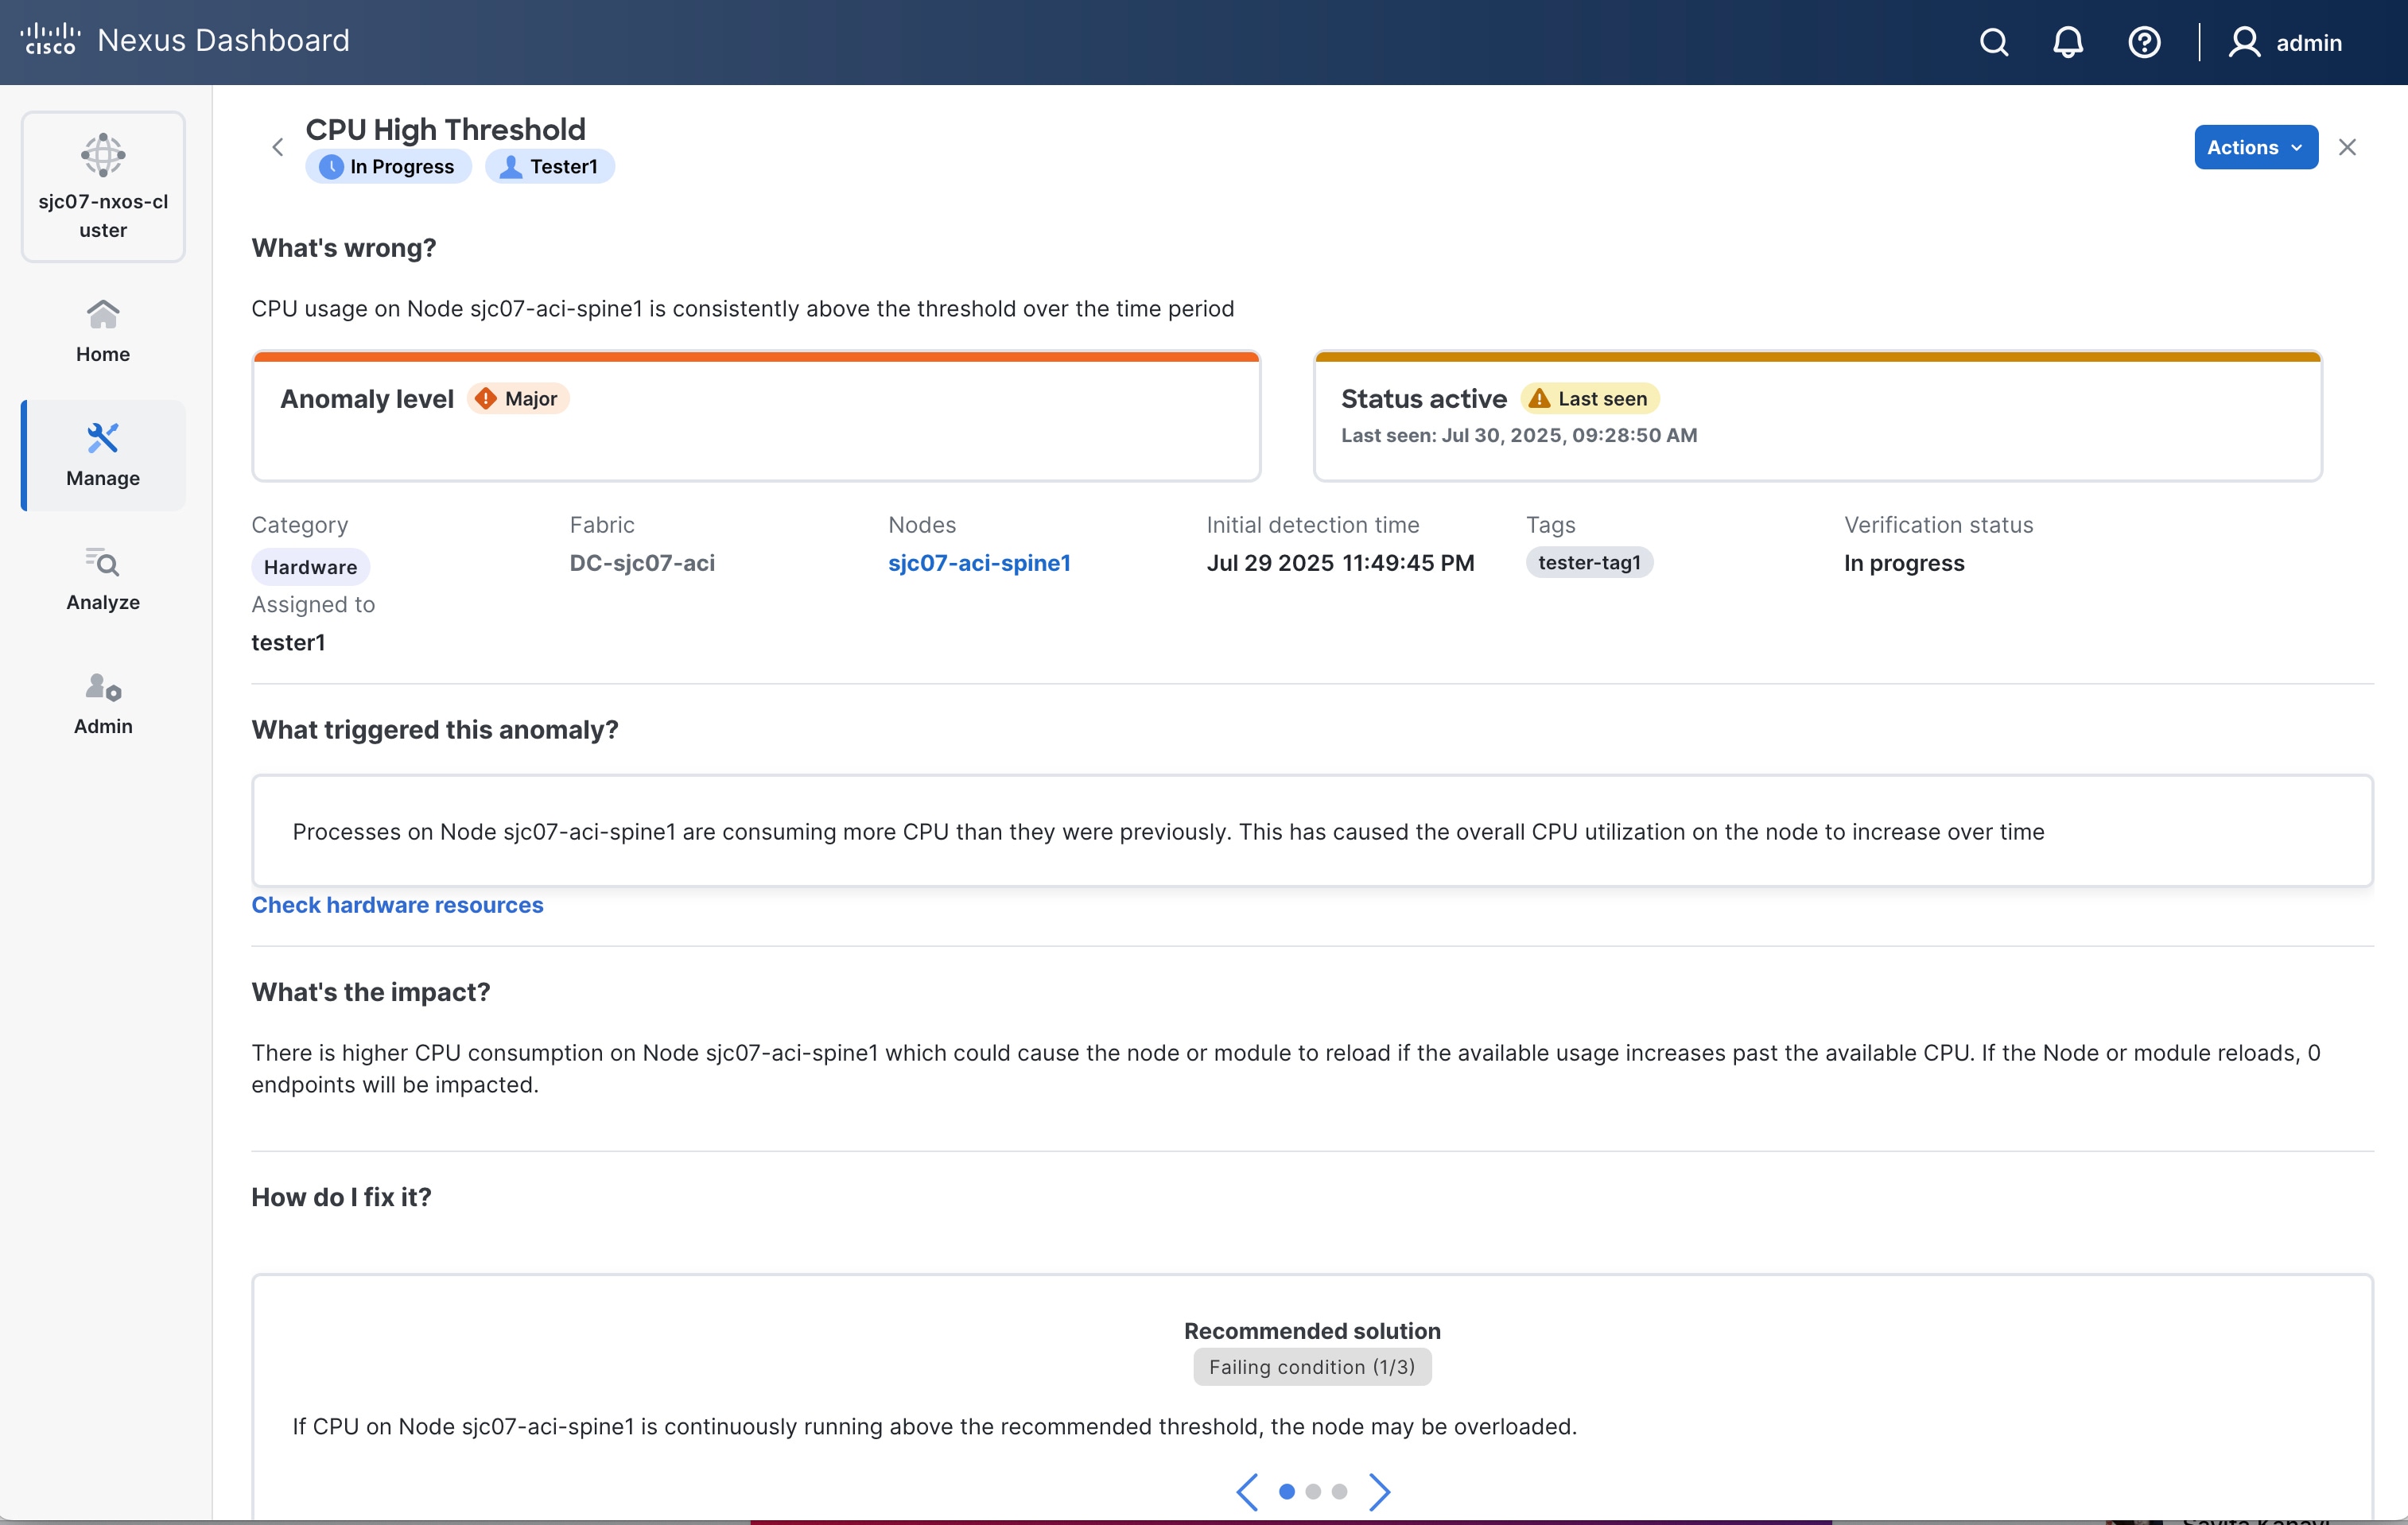
The Anomaly Name page displays these details.
-
What’s wrong? — provides a problem description with the specific affected objects.
-
What triggered this anomaly? — provides the primary source of the anomaly, including a link that you can click to see information about it. This area includes a graph that shows the root cause anomaly and all correlated anomalies. You can click an anomaly in the graph to get more information about that anomaly. The controls at the lower right of the area enable you to zoom the graph in or out and view the topology legend. This area appears only for correlated anomalies.
-
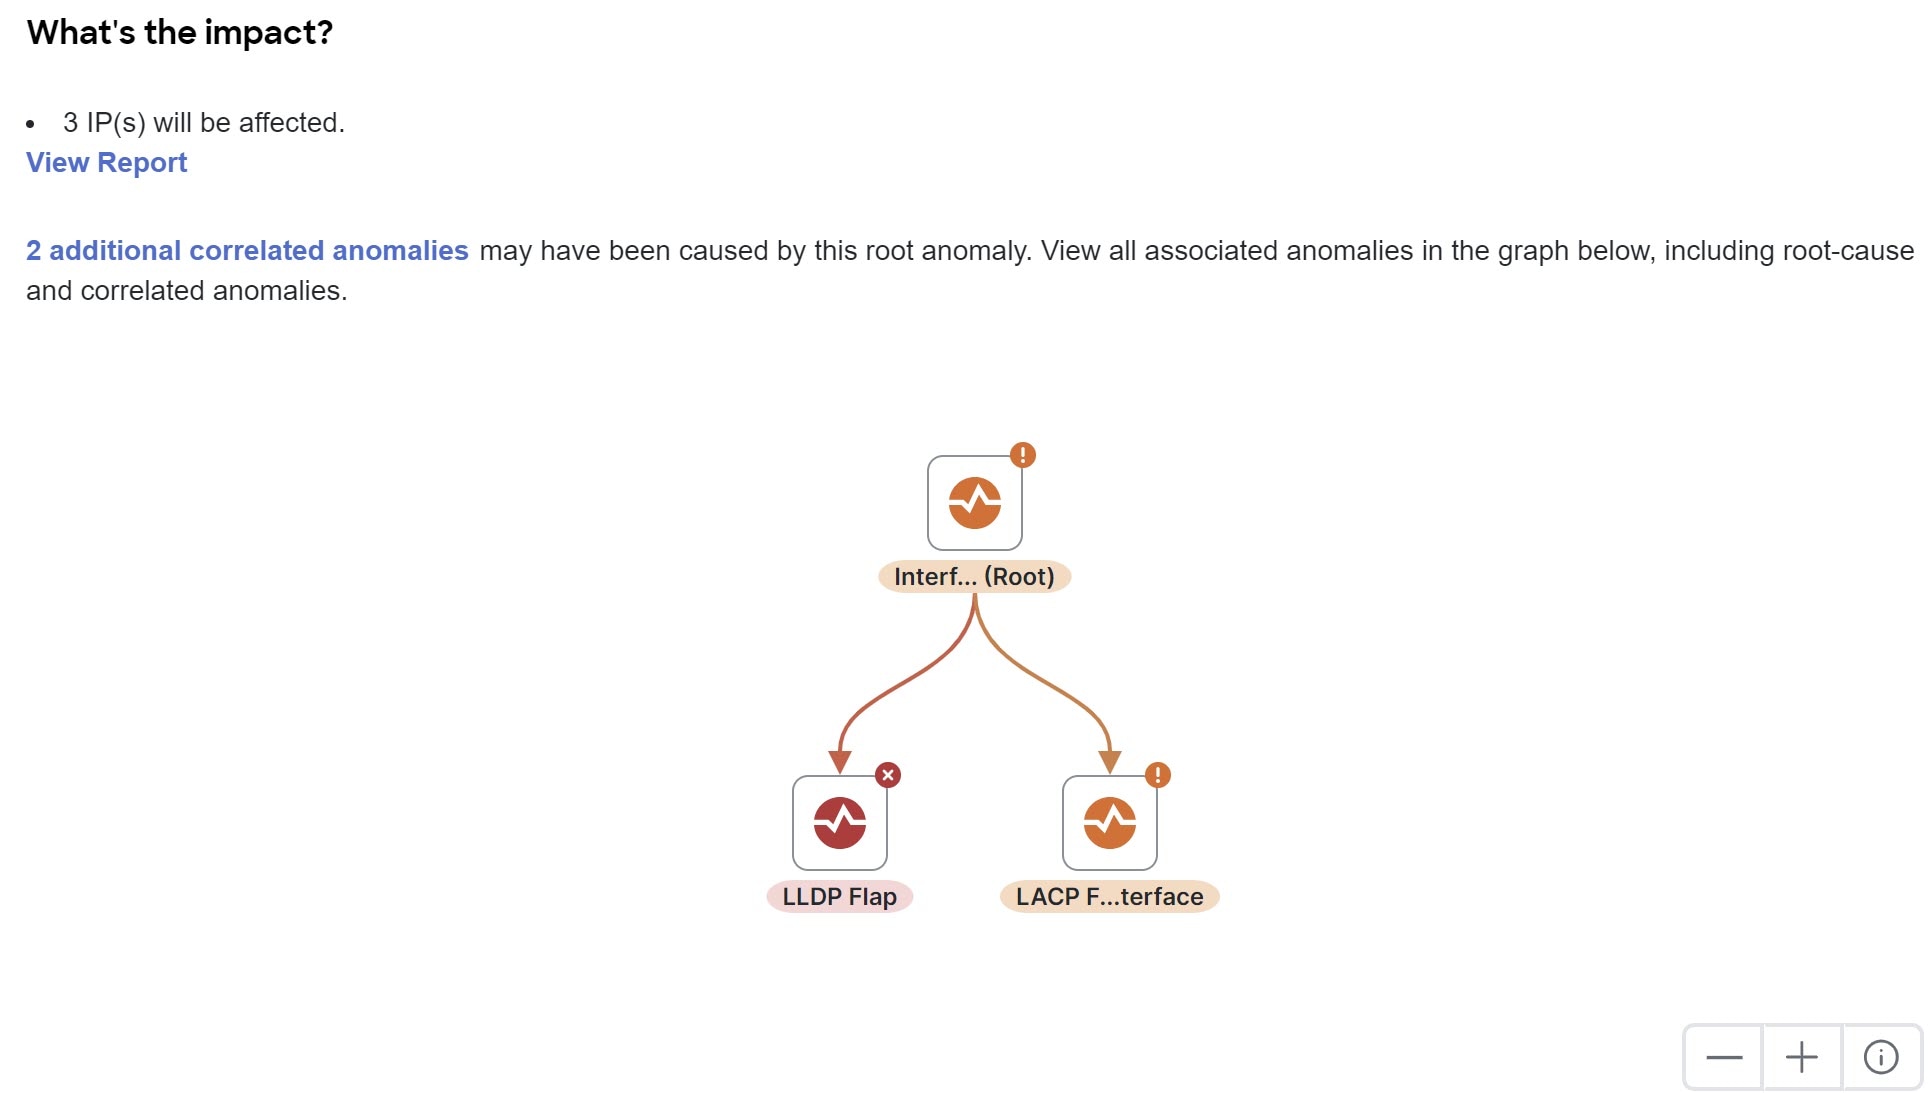
What’s the impact? — explains the potential impact if the problem is not fixed. If the anomaly is a root cause, it also shows the number of correlated anomalies. You can click this number to view a table listing those correlated anomalies.
For root cause anomalies, this area includes a graph that shows the root cause anomaly and all correlated anomalies. You can click an anomaly in the graph to get more information about that anomaly. The controls at the lower right of the area enable you to zoom the graph in or out and view the topology legend.
Suppressed anomalies do not appear in the Anomalies table. However, they can appear in the overview panel and the correlation graph when they are part of a root-cause relationship. Nexus Dashboard identifies suppressed anomalies with a Suppressed tag or visual fill, similar to the Active and Cleared indicators. Suppressed anomalies that appear in the overview panel or the correlation graph are not clickable; you cannot open the anomaly details page from those entries.
When you view the correlated anomalies page and you configure the table to display the Status column, the status can be Active, Cleared, or Deleted. The Active status indicates that the anomaly is present in your network. The Cleared status indicates that the anomaly is not present in your network anymore. The Deleted status indicates that the system deleted the anomaly from the anomalies database due to being aged out, but the anomaly is not yet deleted from this page because some of its correlated anomalies still exist.
-
How do I fix it? — provides prescriptive recommendations.
-
-
From the drop-down list in the Anomalies page, choose Ungrouped.
-
Choose anomalies from the Anomalies table and click Acknowledge anomalies to acknowledge the anomalies.
-
You can also click an anomaly, then click the ellipses (…) next to each anomaly, and choose Acknowledge anomaly from the drop-down list.
By default, all the unacknowledged anomalies are displayed in the Anomalies table. After you acknowledge an anomaly, choose Acknowledged from the drop-down list to view all the acknowledged anomalies.
-
Resolve streaming anomalies on switches
When telemetry streaming from switches stops for more than five minutes, you can use Nexus Dashboard to identify the root cause and restore telemetry data flow. Restoring telemetry enables you to regain critical visibility into switch health and performance metrics for both ACI and NX-OS switches.
Switch anomaly for ACI
In ACI fabrics, streaming telemetry anomalies occur when Nexus Dashboard does not receive telemetry data from a switch for more than five minutes. This interruption causes a loss of visibility into the switch’s operational status, interfaces, capacity, hardware resources, and endpoints.
Some symptoms include:
-
The switch does not send telemetry data for over five minutes.
-
Nexus Dashboard loses visibility of the affected switch.
-
Telemetry data, like interface status, capacity, and hardware resources are not updated.
Follow these steps to resolve streaming anomalies on ACI switches.
-
Verify that telemetry is enabled on the fabric and not paused. Use the management interface or relevant configuration settings to confirm.
-
Use CLI or management tools to ensure the switch is operating without errors and all necessary processes are running.
-
Check connectivity between the switch inband or out-of-band (OOB) interfaces and the data interfaces. If a firewall exists in the network path, verify that all required ports are open and accessible.
-
Confirm that all services within the Nexus Dashboard cluster are operational and that no system anomalies or errors affect telemetry data collection.
-
Determine whether other switches in the fabric are experiencing similar issues to help identify common causes or patterns.
-
Briefly pause telemetry streaming, wait a few seconds, and then re-enable it to reset data flow and resolve transient issues using Nexus Dashboard.
-
If the issue persists after completing these steps, contact Cisco Technical Assistance Center (TAC) for further troubleshooting and support.
Switch anomaly for NX-OS
Streaming telemetry anomalies on standalone NX-OS switches occur when Nexus Dashboard does not receive telemetry data for more than five minutes, similar to ACI fabrics. As a result, Nexus Dashboard loses visibility into the switch status and telemetry information. Some symptoms include:
-
The switch does not send telemetry data for over five minutes
-
Nexus Dashboard loses visibility of the affected switch
-
Telemetry data, like interface status, capacity, and hardware resources, does not update
Follow these steps to resolve streaming anomalies on NX-OS switches.
-
On the affected NX-OS switch, run the show telemetry transport command to identify the receiver IP address.
-
Confirm that the receiver IP address is reachable from the switch.
-
Check network connectivity between the switch and Nexus Dashboard cluster nodes.
-
Verify that telemetry is enabled and active on the switch using the command 'show running-config telemetry'.
-
In the Nexus Dashboard, navigate to Admin > System Status > Telemetry > Switches and confirm the telemetry configuration status.
-
On the switch CLI, use the show running telemetry and show telemetry transport commands to verify the configuration.
-
Use CLI or management tools to ensure the switch is operating without errors and all necessary processes are running.
-
Confirm connectivity between the switch inband or out-of-band (OOB) interfaces and Nexus Dashboard data interfaces. Ensure firewall rules allow required ports as per Cisco guidelines.
-
Confirm that all Nexus Dashboard cluster services are operational and that no system anomalies or errors affect telemetry data collection.
-
Check whether other NX-OS switches in the fabric are experiencing the same issue to identify common causes or patterns.
-
Briefly pause telemetry streaming, wait a few seconds, and then re-enable it to reset data flow and resolve transient issues.
-
If the issue persists after completing these steps, contact Cisco Technical Assistance Center (TAC) for further troubleshooting and support.
Resolve telemetry configuration anomalies on switches
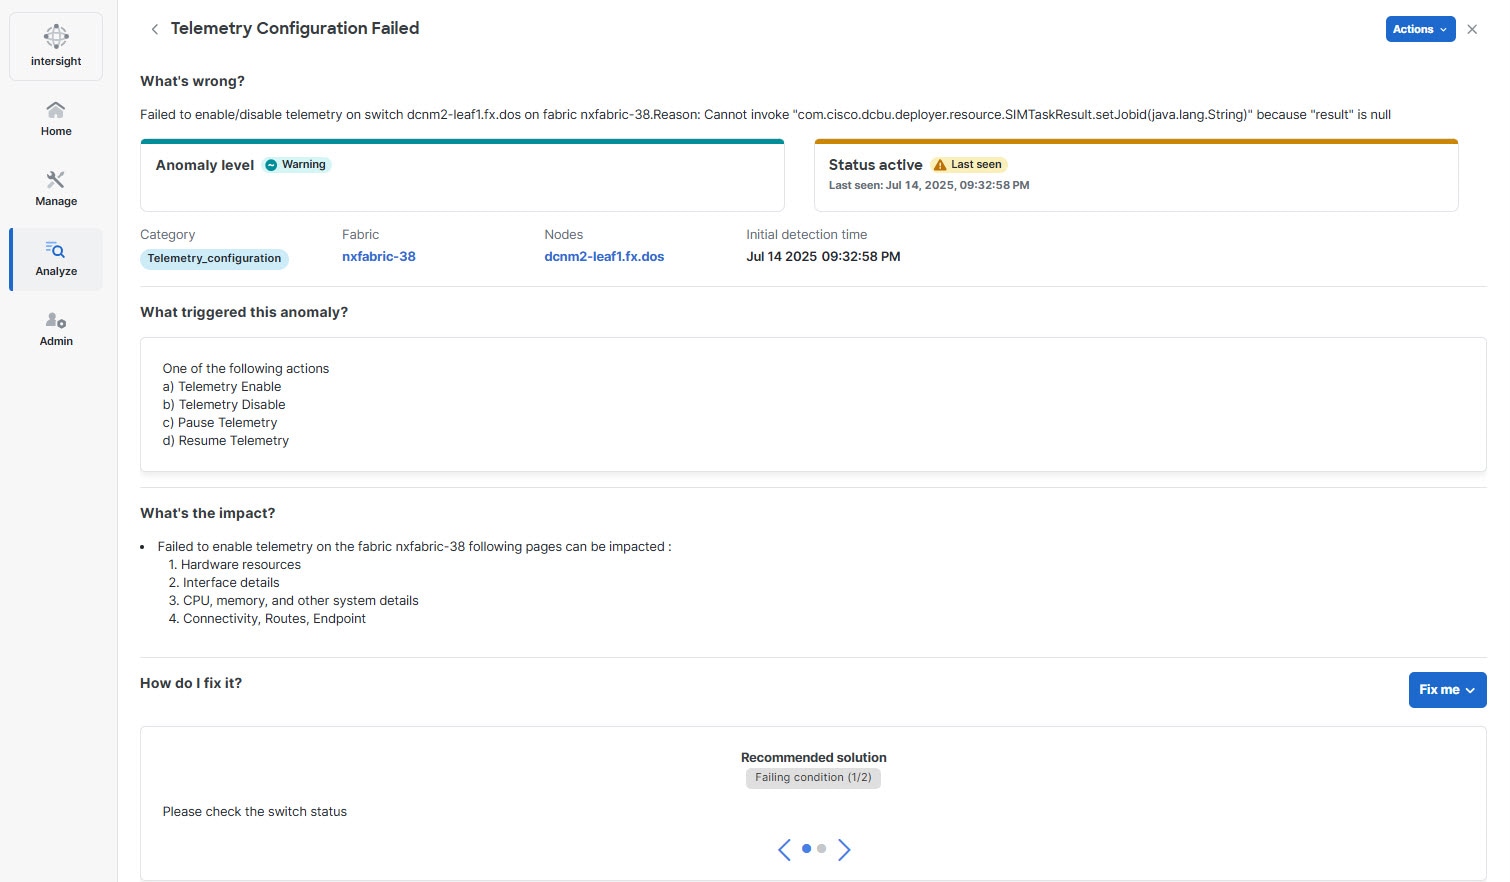
Policy gateway anomalies are categorized under Telemetry configuration. If telemetry configuration fails on a switch, you can resolve the issue using the Fix me option available in the How do I fix it? section in the Telemetry Configuration Failed page. This option helps to systematically resolve telemetry configuration anomalies and restore normal telemetry operations on affected switches.
Follow these steps to resolve the telemetry configuration anomalies.
-
In the Anomalies table, click a Telemetry configuration anomaly.
The Telemetry Configuration Failed page displays.
-
In the How do I fix it? section, click the Fix me drop-down list.
You can view these options.
Field Description Retry failed switch configuration
Attempts to re-apply the configuration only on the switch associated with the anomaly that the user is interacting with.
Retry all failed switch configuration
Attempts to re-apply the configuration on all switches that have failed telemetry configuration. This option does not remove any stale or failed configurations on the affected switches, it only attempts to reconfigure the telemetry configurations on the failed switches.
Resync failed switch configuration
Synchronizes and re-applies the configuration exclusively on the switch associated with the anomaly that the user is interacting with.
Resync all failed switch configuration
Synchronizes and re-applies telemetry configurations on all switches with any failed telemetry configuration.
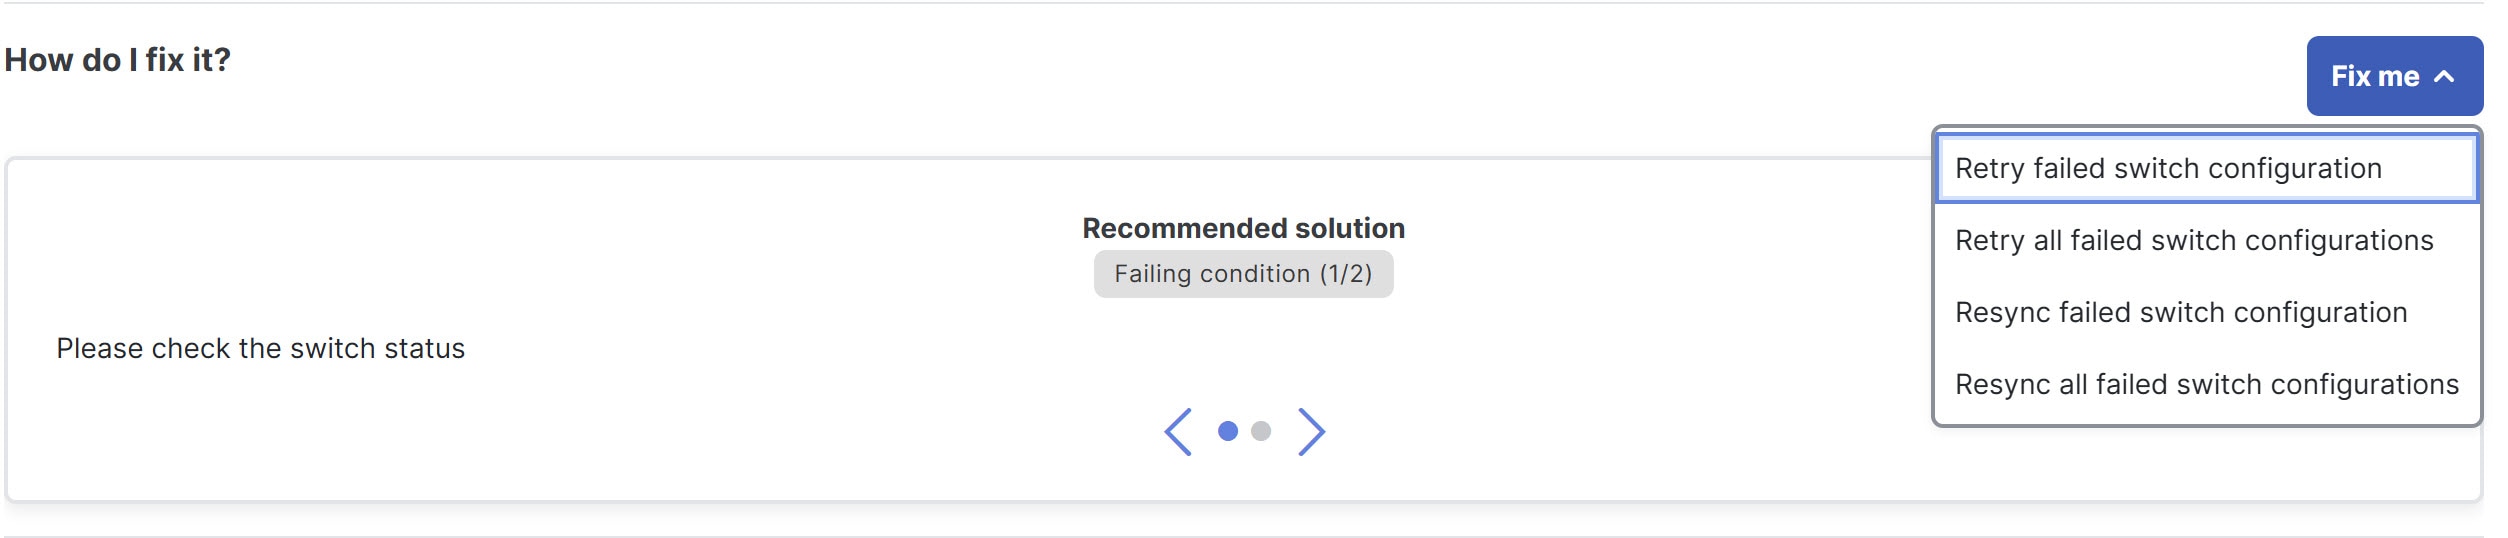
-
Choose one of these options from the Fix me drop-down list to resolve telemetry configuration anomalies.
View platform and system alerts in global anomalies table
Anomalies that affect a Nexus Dashboard cluster but are not necessarily associated with a fabric are referred to as system anomalies. These anomalies can include issues such as hardware malfunctions, capacity constraints, compliance violations, connectivity disruptions, configuration errors, and active bugs. Enabling system anomalies allows you to identify the root cause, improve network health, and enhance operational efficiency.
Follow these steps to view platform and system alerts in global anomalies table.
-
Navigate to Analyze > Anomalies.
The Anomalies page displays.
-
Click the Include system anomalies toggle button in the top-right corner, to include system-related anomalies in the Anomalies table.
Once enabled, the System category appears under anomalies by category in the Anomalies page.
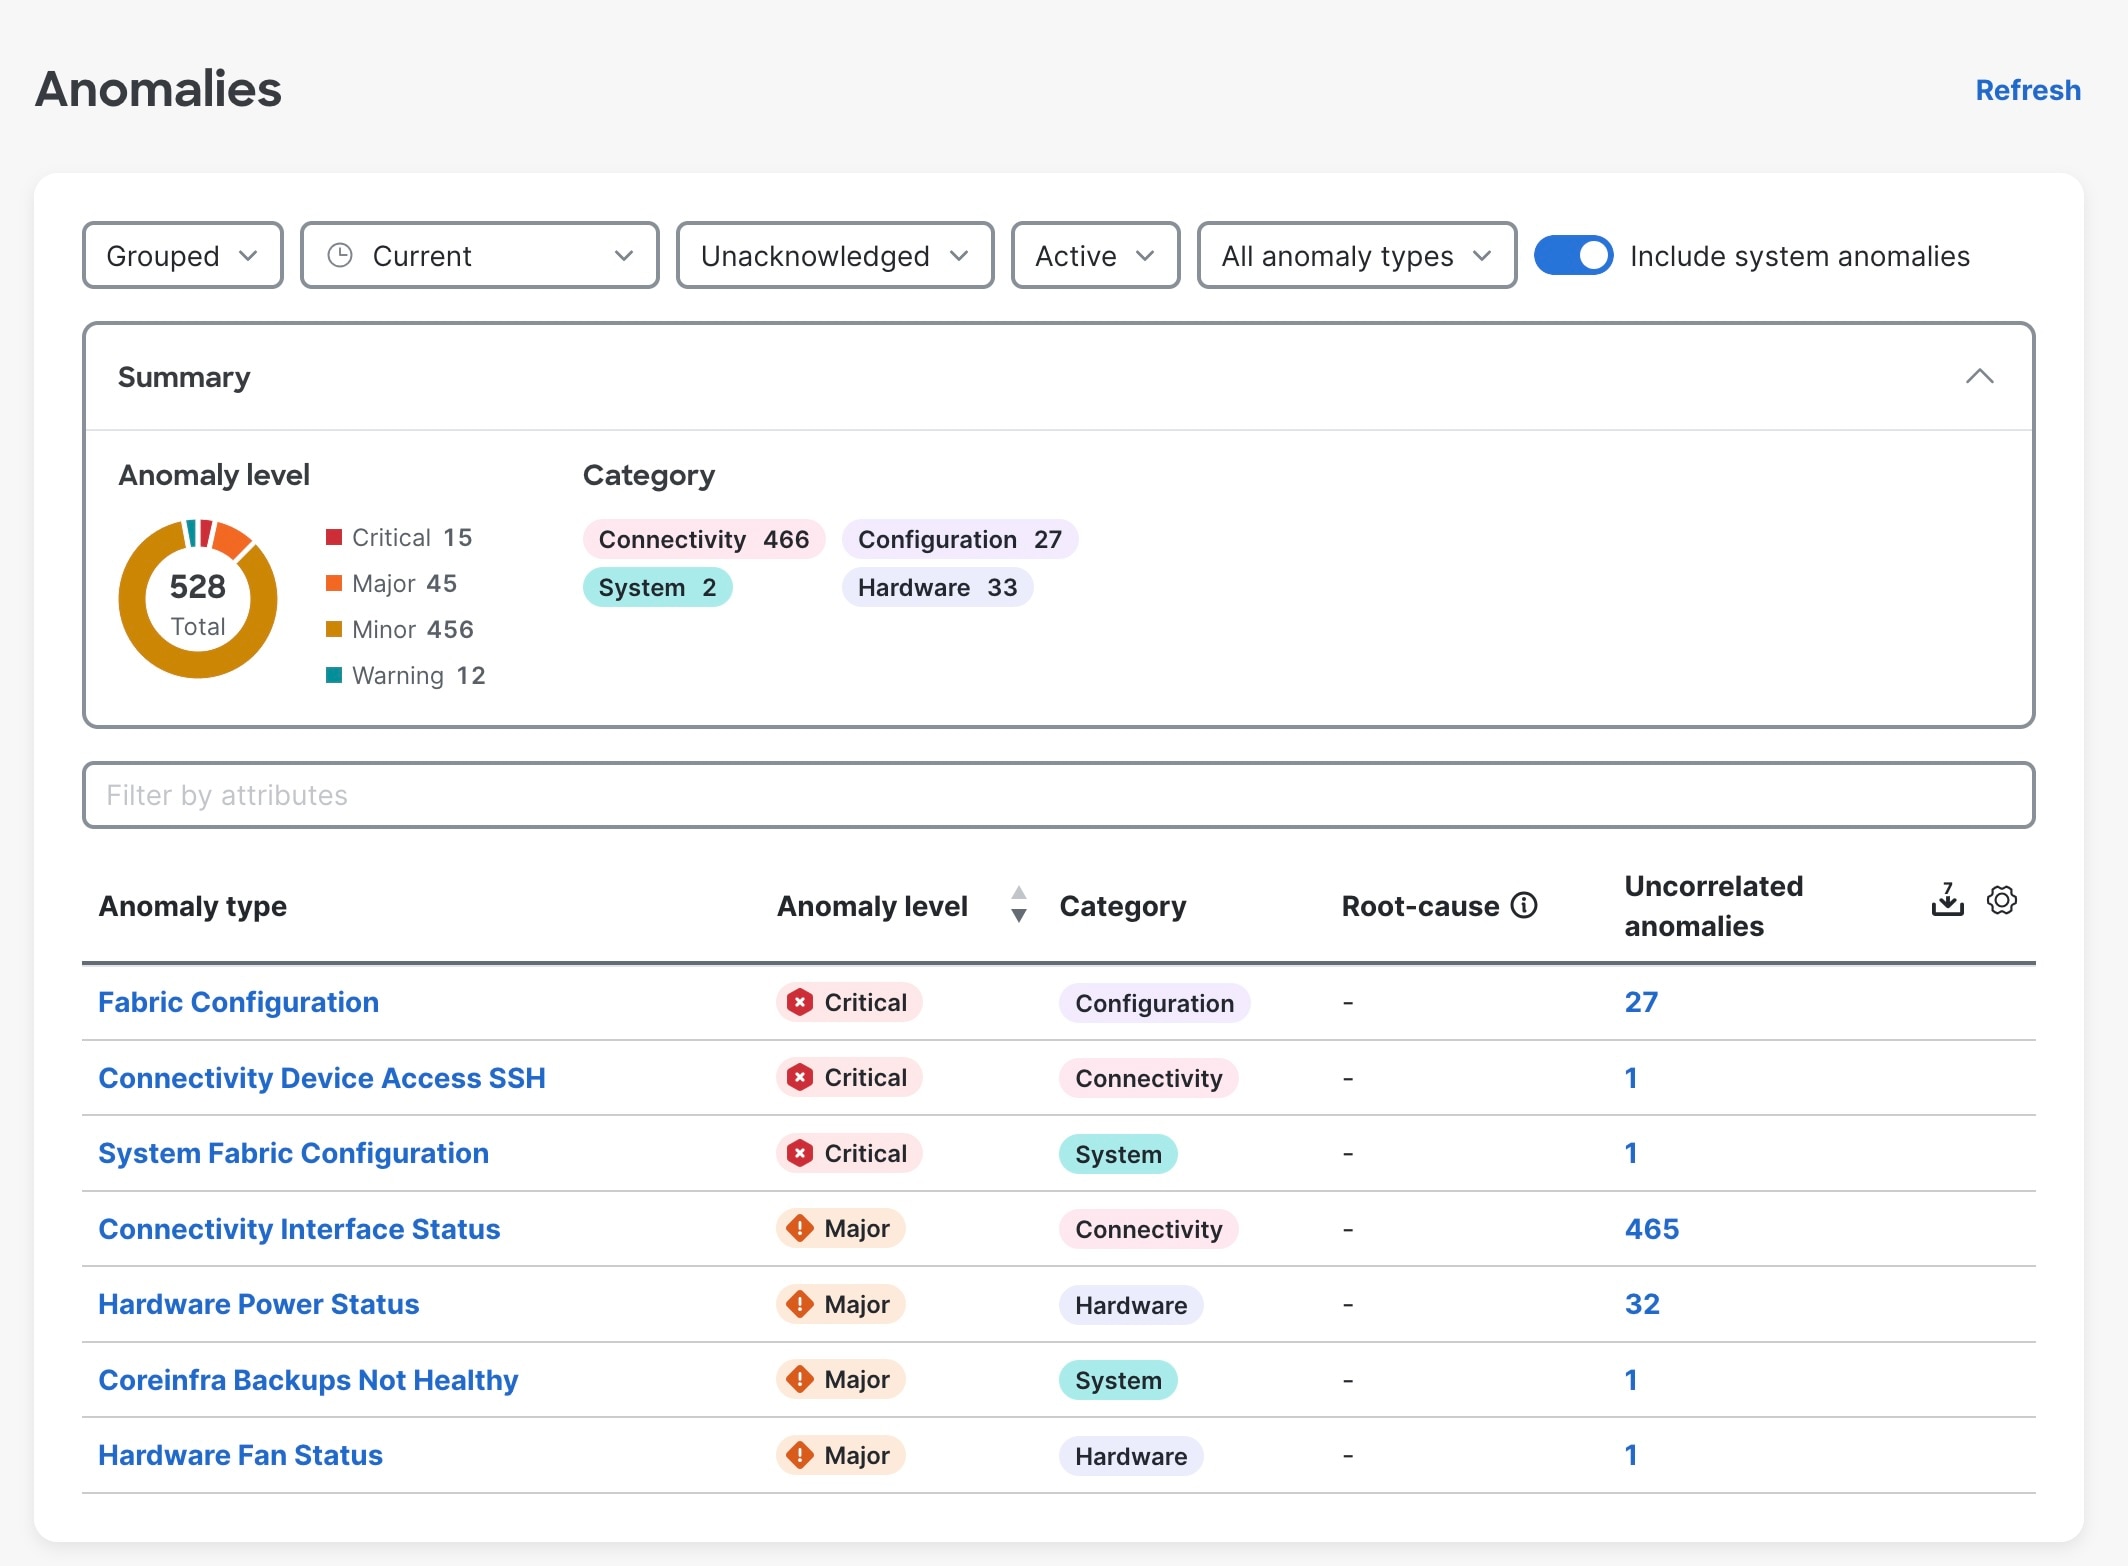
Follow these steps to include system-related anomalies at fabric level.
-
Navigate to Manage > Fabrics.
-
In the Fabrics page, choose the appropriate fabric.
The Fabric Overview page displays.
-
In the Fabric Overview page, click the Anomalies tab.
-
Click the Include system anomalies toggle button in the top-right corner, to include system-related anomalies in the Anomalies table.
Once enabled, the System category appears in the anomalies by category card in the Anomalies page.
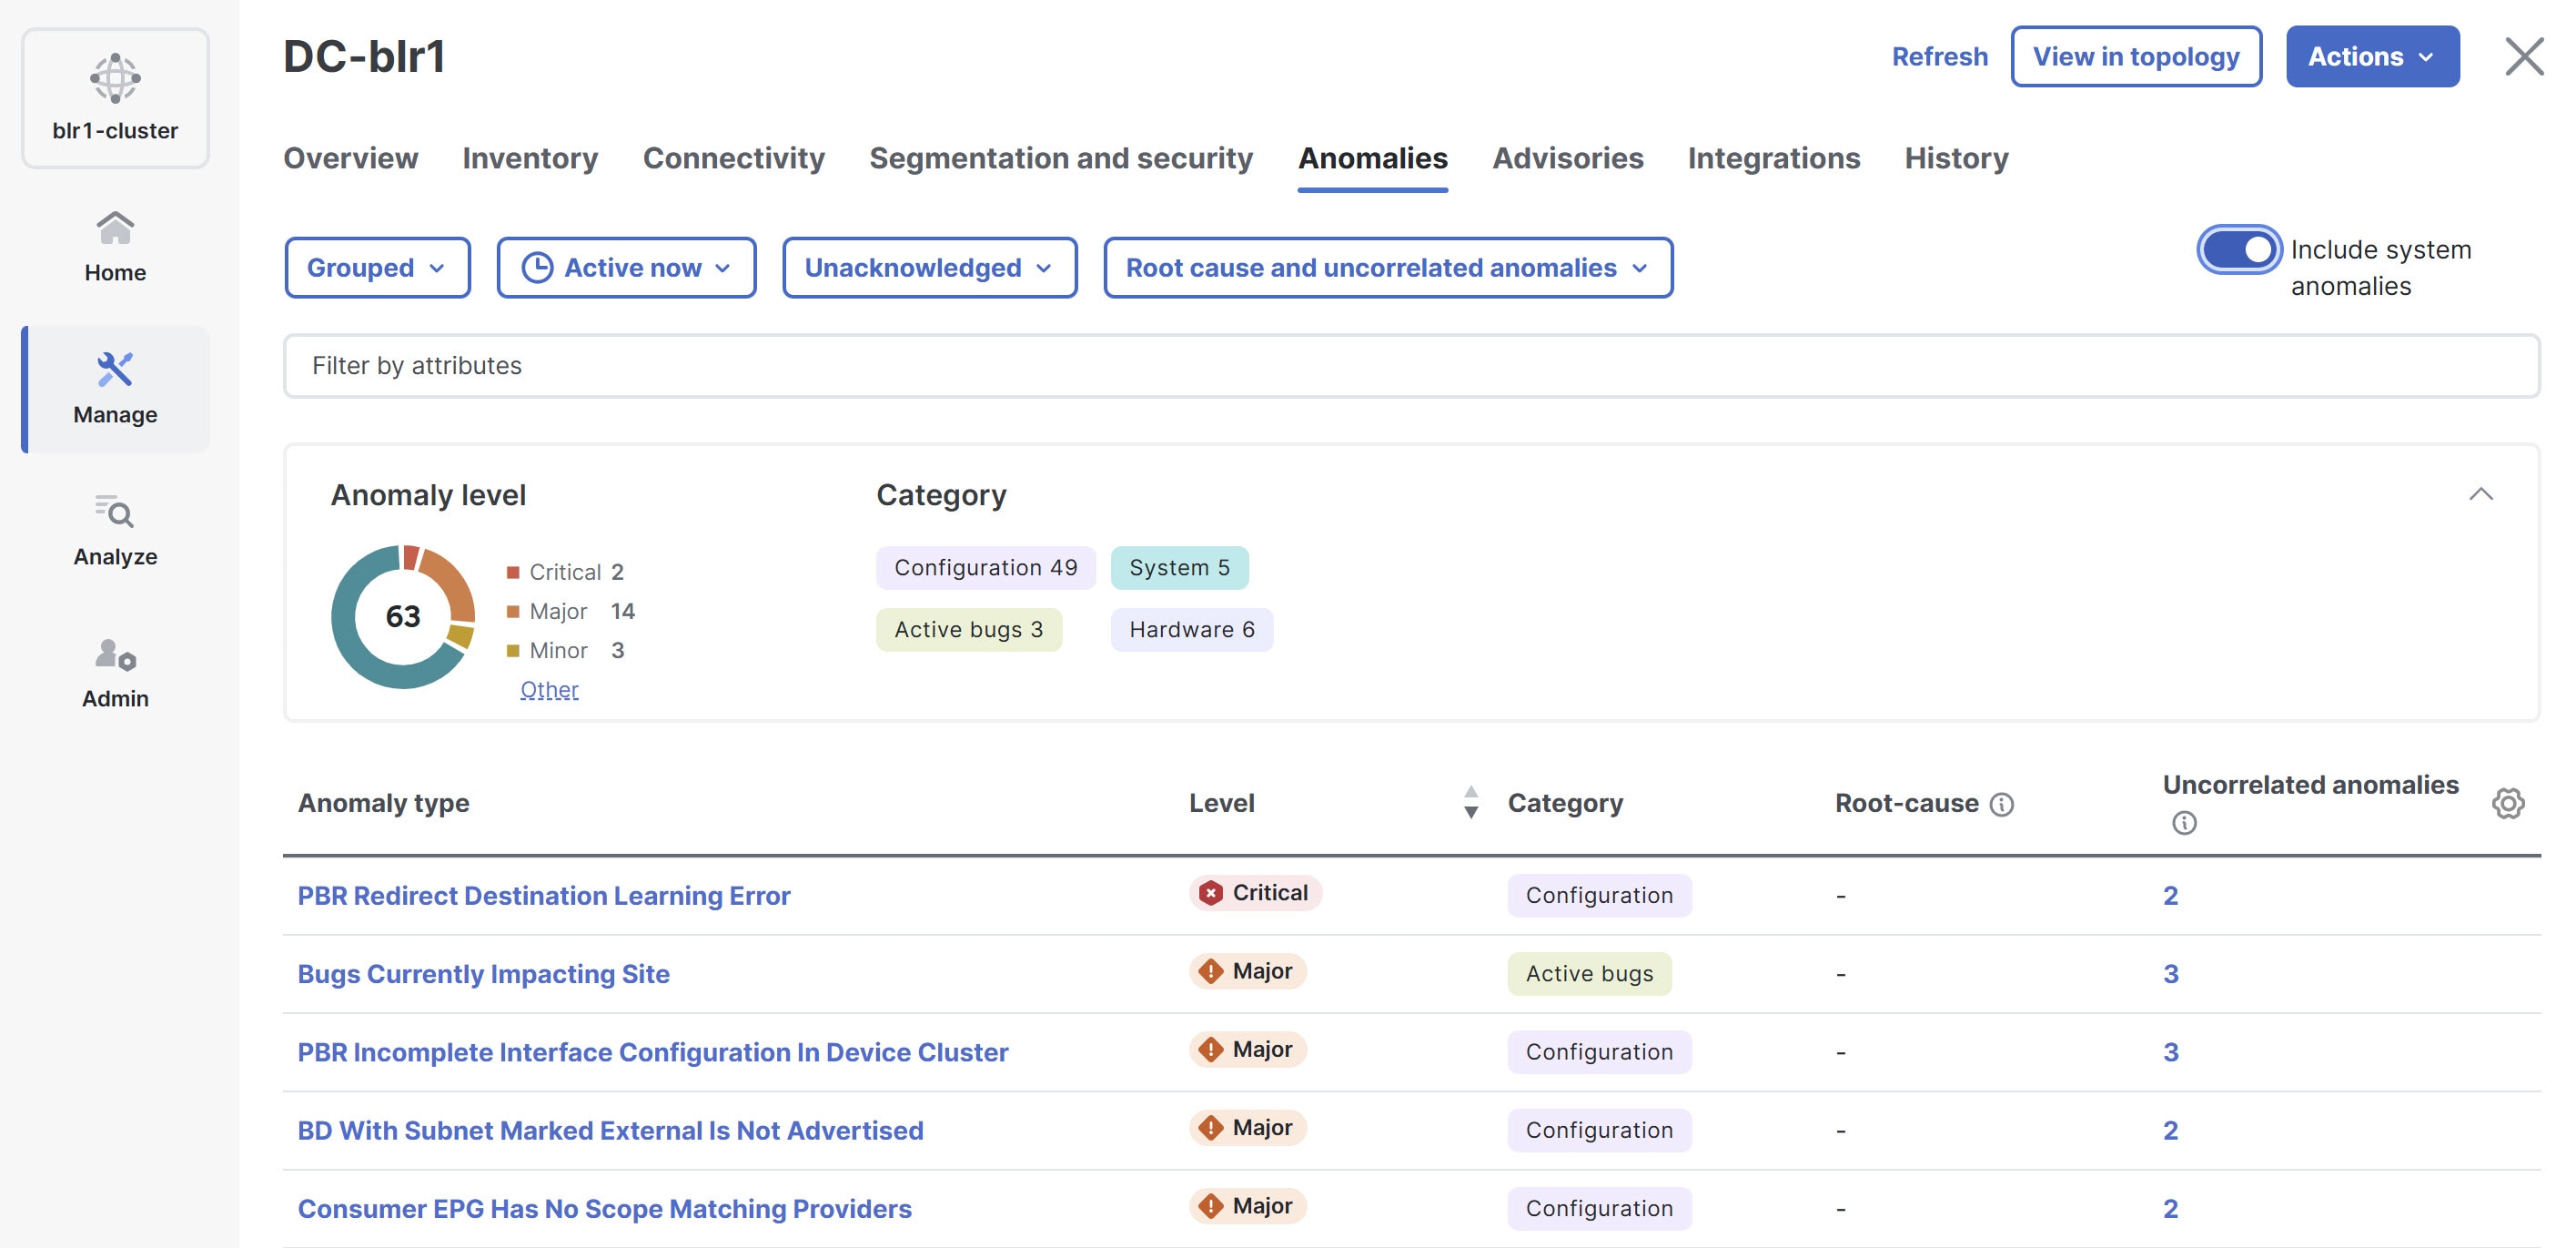
System anomaly notification
When an active system anomaly impacts the cluster health, a notification alert appears on the Notifications bell icon located in the common navigation bar at the top of the page. Click the notification bell icon to open the Notifications pane. In the Notifications pane, click View system anomalies. Nexus Dashboard redirects you to the System Status page, where you can review the full list of current and past system anomalies in the Anomalies table.
Nexus Dashboard will not display a notification alert if the cluster health is not affected.
Guidelines and limitations for anomalies
-
Nexus Dashboard does not display anomalies that belong to the System category in the Anomalies page by default.
Follow these steps to view system anomalies.
-
Navigate to Analyze > Anomalies.
-
Choose Ungrouped from the drop-down list.
-
Click the Include system anomalies toggle button. Note that the System category appears in the Category list only when you enable the Include system anomalies toggle button.
-
-
Nexus Dashboard purges fabric data in either of the following scenarios:
-
After the 30-day retention period
-
When the storage threshold is reached
When data is purged, Nexus Dashboard no longer displays the anomalies and advisories for that fabric. To view them again, rerun the analysis on the fabric.
-
-
In Nexus Dashboard, invalid and stale alarms are periodically cleared every 24 hours.
-
When you upgrade a device, there may be instances where traps are not sent or received by the Nexus Dashboard, resulting in anomalies not being raised or cleared.
-
When the controller is unreachable, the fabric nodes remain operational, but Nexus Dashboard cannot retrieve their state. As a result, Nexus Dashboard may raise Node Inactive anomalies for nodes that are actually active. In this scenario, the Controller Unreachable anomaly is the root cause, and the Node Inactive anomalies are correlated anomalies.
-
In large fabrics, a single controller unreachable condition can generate many correlated Node Inactive anomalies. To focus on the underlying issue, use the Root Cause Anomalies Only filter to display only the Controller Unreachable anomaly. For more information, see Filtering for root cause and uncorrelated anomalies.
-
When there are three or more controllers in a cluster, not all controller update events are shown during an upgrade.
-
During Nexus Dashboard cluster upgrade, individual Node Inactive anomalies are not raised. Instead, Nexus Dashboard raises a single Controller Unreachable anomaly to avoid generating unnecessary anomalies for nodes that are still operational.
-
In Nexus Dashboard release 4.3.1, if the fabric has a single APIC controller and that controller is upgraded, Nexus Dashboard generates Node Inactive anomalies for all nodes in the fabric. This occurs because Nexus Dashboard temporarily loses connectivity to the only controller available to report node state. The anomalies clear automatically after the controller upgrade completes and connectivity is restored.
-
Resolving the controller reachability issue automatically clears the correlated Node Inactive anomalies.
-
The Anomaly level in the endpoint summary table (Manage > Fabrics > Connectivity > Endpoints) may not always match the Anomaly level shown on the Endpoint details page. This happens because the table is updated periodically and can briefly show an older value. To see the most accurate anomaly level for an endpoint, click the endpoint to view the Endpoint details page.
Configure anomaly properties
Follow these steps to configure properties for an anomaly.
-
Navigate to Analyze > Anomalies.
-
Choose Online fabrics or Snapshot fabrics from the drop-down list.
-
From the Anomalies drop-down list, choose Ungrouped.
The Ungrouped view displays the individual anomalies raised for your fabrics.
-
From the Time Selection dialog, choose the desired mode, then click Apply. The default is Active Now.
-
For Last…, you must also choose a period.
-
For Date and Time Range, you must also choose the range.
-
-
Click an anomaly from the table and then choose a property from the Actions drop-down list.
-
Choose Acknowledge Anomaly to acknowledge an anomaly. By default all the unacknowledged anomalies are displayed in the anomalies table. After you acknowledge an anomaly, choose Acknowledged from the drop-down list to view all the acknowledged anomalies.
-
Choose Verification Status to set a user defined status such a New, In Progress, or Closed to an anomaly. Choose a status from the drop-down list and click Save.
-
Choose Assigned To to assign an anomaly to an user. Enter the username and click Save.
-
Choose Comment to assign a comment to an anomaly. Enter a comment and click Save.
-
Choose Manage Tags to add user-defined tags to an anomaly. Enter the tag name and click Save. You can enter multiple tags. After entering the tag name, press Enter.
-
-
To acknowledge multiple anomalies, select the anomalies. Click Acknowledge anomalies.
-
To view the the properties assigned to an anomaly, click an anomaly to view the Anomaly page. In the Anomaly page, properties such as Verification Status, Acknowledge, and Assigned To are displayed. To view comments and tags assigned to an anomaly, from the Actions menu, choose Comment or Manage Tags.
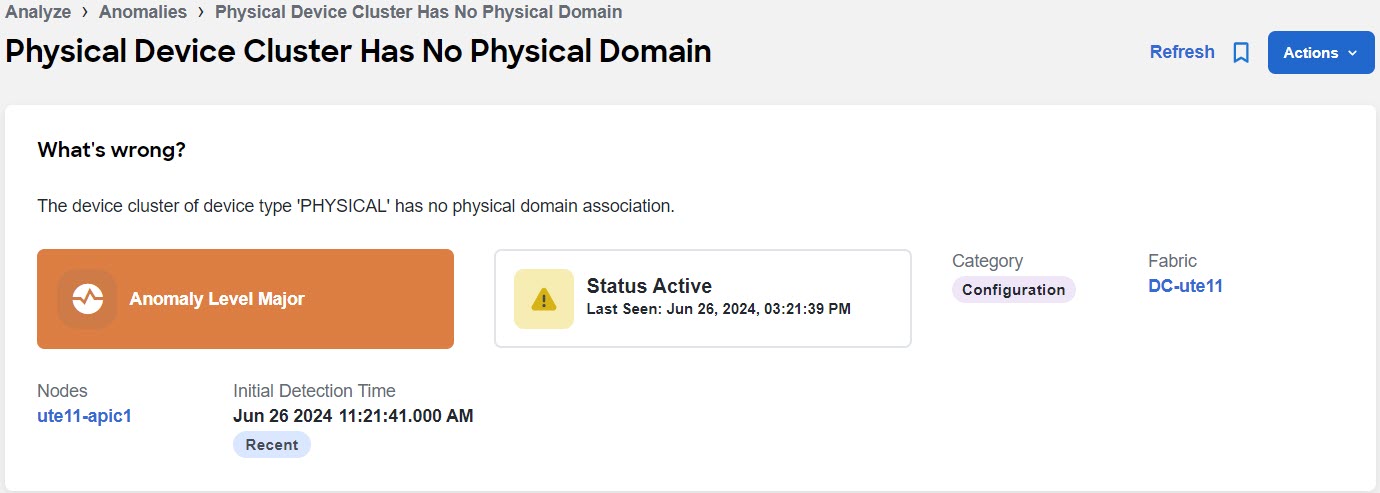
Anomaly filters
The filter field allows you to filter the table of anomalies when viewing the ungrouped anomalies, or filter the table of anomaly types when viewing the grouped anomalies.
In the Anomalies page, you can use the following filters to refine entries in the table:
-
Anomaly Type - Display anomalies with a specific type.
-
Assigned To - (Ungrouped, only) Display anomalies assigned to a specific user.
-
BD - Display anomalies with a specific bridge domain.
-
Category - Display anomalies from a specific category.
-
Check code - (Ungrouped, only) Display anomalies with a specific check code.
-
Cleared Time - (Ungrouped, only) Display anomalies with a specific cleared time.
-
Comment - (Ungrouped, only) Display anomalies with a specific comment.
-
Detection Time - (Ungrouped, only) Display anomalies with a specific detection time.
-
EPG - Display anomalies with a specific EPG.
-
Fabric - (Ungrouped, only) Display anomalies for a specific fabric.
-
Interface - Display anomalies with a specific interface.
-
IP address - (Ungrouped, only) Display anomalies with a specific IP address.
-
Last Seen Time - (Ungrouped, only) Display anomalies with a specific last seen time. Last Seen Time indicates the time the anomaly was updated while under active status. If the status of the anomaly is not cleared, then the anomaly is active.
-
Level - Display anomalies of a specific level.
-
MAC address - Display anomalies with a MAC address.
-
Nodes - Display anomalies for specific nodes.
-
Status - Displays anomalies that have the specified status.
-
Tags - (Ungrouped, only) Display anomalies with a specific tag.
-
VPC - Display anomalies with a specific virtual port channel (vPC).
-
VRF - (Ungrouped, only) Display anomalies with a specific virtual routing and forwarding (VRF) instance.
-
Verification Status - (Ungrouped, only) Display anomalies with a specific verification status.
-
What’s Wrong - (Ungrouped, only) Displays anomalies of a specific affected object.
As a secondary filter refinement, use the following operators:
-
== - With the initial filter type, this operator, and a subsequent value, returns an exact match. This operator is available for all filters.
-
!= - With the initial filter type, this operator, and a subsequent value, returns all that do not have the same value. This operator is available for most filters.
-
contains - With the initial filter type, this operator, and a subsequent value, returns all that contain the value. This operator is available for some filters.
-
!contains - With the initial filter type, this operator, and a subsequent value, returns all that do not contain the value. This operator is available for some filters.
Filter for acknowledged or unacknowledged anomalies
This drop-down menu next to the filter field enables you to filter the anomalies the unacknowledged or acknowledged status. Choose Acknowledged to filter out unacknowledged anomalies. Choose Unacknowledged to filter out acknowledged anomalies.
Filter for root cause and uncorrelated anomalies
This drop-down menu near to the filter field enables you to filter for root cause and uncorrelated anomalies, which filters the table of anomalies accordingly.
You can choose the following filters:
-
Root Cause and Uncorrelated Anomalies - The table displays root cause anomalies and uncorrelated anomalies, but not correlated anomalies. This is the default value because it shows only the anomalies that you must manually resolve. If you resolve the root cause anomalies, then the correlated anomalies also get resolved. Because of this, it is not as important for you to see the correlated anomalies.
-
Root Cause Anomalies Only - The table displays only root cause anomalies.
-
Uncorrelated Anomalies - The table displays only uncorrelated anomalies.
-
All Anomaly Types - The table displays all anomalies.
Determine the primary affected object for an anomaly
To filter for anomalies using a combination of affected object filters, such as IP address, MAC address, interface, VPC, EPG, and VRF, all the provided filter objects should be a primary affected object for any given anomaly. The filter will not return results if the query contains non-primary affected objects.
Follow these steps to determine the primary affected object for a particular anomaly.
-
To determine the primary affected object for a particular anomaly, navigate to Analyze > Anomalies.
-
To determine the object from the ungrouped anomalies, choose Ungrouped from the drop-down menu.
-
To determine the object from the grouped anomalies, choose Grouped from the drop-down menu, then click the desired anomaly type in the table.
-
-
Choose an anomaly from the Anomalies table.
-
In the What’s the impact? area, the primary affected objects are highlighted in bold.
Global rules
Global rules page enables you to see which anomaly levels are enabled for the different anomaly categories. You can also customize the thresholds that determine whether an anomaly is assigned the warning, major, or critical level.
Customize anomaly level thresholds
Follow these steps to customize anomaly level thresholds.
-
Navigate to Manage > Anomaly and Compliance Rules > Global Rules.
-
Locate the row with the anomaly category that you want to customize, then click the entry in the Status column on that row.
These are the anomaly categories that you can customize in Global Rules - the threshold customizations that are available differ for each of the anomaly categories:
Capacity
This information applies if Capacity is the entry in the Anomaly Category column and you click the entry in the Status column on that row.
-
In the Customize thresholds for capacity anomalies table, find the anomaly whose thresholds you want to customize and click the edit (pencil) icon.
The Customize thresholds for capacity anomalies table can have multiple pages. If necessary, use the page controls at the bottom of the table to find the desired anomaly.
-
Enter the desired percent for each anomaly level, then click the green check mark.
After you customize the thresholds, Nexus Dashboard recalculates the anomaly levels of existing anomalies, which takes approximately 30 minutes to complete.
You can click Reset to reset the values to their default or X to cancel the edit.
-
The values can be from 0 to 100. A value of 0 indicates Nexus Dashboard will not raise any anomalies for that severity. If you enter 0 for all of the severities, Nexus Dashboard suppresses the anomaly completely.
-
The value for Warning must be lower than the value for Major, and the value for Major must be lower than the value for Critical.
-
The value defined for Major sets the upper end limit of the range defined for Warning, and the value defined for Critical sets the upper end limit of the range defined for Major.
-
Hardware
This information applies if Hardware is the entry in the Anomaly Category column and you click the entry in the Status column on that row.
In the Customize Hardware page, choose the appropriate category:
Fabric Management
The Fabric Management Anomaly Thresholds option under Hardware is available for NX-OS fabrics only.
-
In the Fabric Management Anomaly Thresholds table, find the anomaly whose thresholds you want to customize and click the edit (pencil) icon.
The Fabric Management Anomaly Thresholds table can have multiple pages. If necessary, use the page controls at the bottom of the table to find the desired anomaly.
-
In the Warning, Minor, Major, and Critical columns, enter the desired percent for each anomaly level, then click the green check mark.
-
The values can be from 0 to 100. A value of 0 indicates Nexus Dashboard will not raise any anomalies for that severity. If you enter 0 for all of the severities, Nexus Dashboard suppresses the anomaly completely.
-
The value for Warning must be lower than the value for Minor, the value for Minor must be lower than the value for Major, and the value for Major must be lower than the value for Critical.
-
The value defined for Minor sets the upper end limit of the range defined for Warning, the value defined for Major sets the upper end limit of the range defined for Minor, and the value defined for Critical sets the upper end limit of the range defined for Major.
-
-
In the Forwarding column, determine if you want to enable forwarding using email, SNMP, or all, or leave the option set at None if you do not want to enable forwarding.
After you customize the thresholds, Nexus Dashboard recalculates the anomaly levels of existing anomalies, which takes approximately 30 minutes to complete.
You can click Reset to reset the values to their default or X to cancel the edit.
-
To enable notifications for the CPU, memory, power usage, or temperature anomaly types, locate the appropriate row and toggle the button in the Enable column to the on position.
Toggle the button in the Enable column back to the off position to disable the appropriate notification.
Telemetry
-
In the Customize thresholds for capacity anomalies table, find the anomaly whose thresholds you want to customize and click the edit (pencil) icon.
The Customize thresholds for capacity anomalies table can have multiple pages. If necessary, use the page controls at the bottom of the table to find the desired anomaly.
-
Enter the desired percent for each anomaly level, then click the green check mark.
After you customize the thresholds, Nexus Dashboard recalculates the anomaly levels of existing anomalies, which takes approximately 30 minutes to complete.
You can click Reset to reset the values to their default or X to cancel the edit.
-
The values can be from 0 to 100. A value of 0 indicates Nexus Dashboard will not raise any anomalies for that severity. If you enter 0 for all of the severities, Nexus Dashboard suppresses the anomaly completely.
-
The value for Warning must be lower than the value for Major, and the value for Major must be lower than the value for Critical.
-
The value defined for Major sets the upper end limit of the range defined for Warning, and the value defined for Critical sets the upper end limit of the range defined for Major.
-
Connectivity
These areas are available under Connectivity:
Fabric Management Anomaly Thresholds
The Fabric Management Anomaly Thresholds option under Connectivity is available for NX-OS fabrics only.
Follow these steps to customize anomaly thresholds and notification settings for NX-OS fabrics.
-
In the Fabric Management Anomaly Thresholds table, find the anomaly whose thresholds you want to customize and click the edit (pencil) icon.
The Fabric Management Anomaly Thresholds table can have multiple pages. If necessary, use the page controls at the bottom of the table to find the desired anomaly.
-
In the Warning, Minor, Major, and Critical columns, enter the desired percent for each anomaly level, then click the green check mark.
-
The values can be from 0 to 100. A value of 0 indicates Nexus Dashboard will not raise any anomalies for that severity. If you enter 0 for all of the severities, Nexus Dashboard suppresses the anomaly completely.
-
The value for Warning must be lower than the value for Minor, the value for Minor must be lower than the value for Major, and the value for Major must be lower than the value for Critical.
-
The value defined for Minor sets the upper end limit of the range defined for Warning, the value defined for Major sets the upper end limit of the range defined for Minor, and the value defined for Critical sets the upper end limit of the range defined for Major.
-
-
In the Forwarding column, determine if you want to enable forwarding using email, SNMP, or all, or leave the option set at None if you do not want to enable forwarding.
After you customize the thresholds, Nexus Dashboard recalculates the anomaly levels of existing anomalies, which takes approximately 30 minutes to complete.
You can click Reset to reset the values to their default or X to cancel the edit.
-
To enable notifications for any of the anomaly types available under Fabric Management Anomaly Thresholds, locate the appropriate row and toggle the button in the Enable column to the on position.
Toggle the button in the Enable column back to the off position to disable the appropriate notification.
Interface Anomaly Option
Follow these steps to customize thresholds and notification settings for interface anomalies.
-
In the Interface Anomaly Option table, find the anomaly whose thresholds you want to customize and click the edit (pencil) icon.
The Interface Anomaly Option table can have multiple pages. If necessary, use the page controls at the bottom of the table to find the desired anomaly.
The Edit Interface Anomaly Option page appears.
-
In the Edit Interface Anomaly Option page, make the appropriate choices for the interface anomaly option:
-
Toggle the button in the Enable field to the on position to enable this option, or in the off position to disable this option.
-
In the Forwarding field, determine if you want to enable forwarding using email, SNMP, or all, or leave the option set at None if you do not want to enable forwarding.
-
In the Severity field, determine if you want to set the severity threshold at Minor, Major, Warning, or Critical.
-
Click Save to save the configured interface anomaly option.
After you customize the thresholds, Nexus Dashboard recalculates the anomaly levels of existing anomalies, which takes approximately 30 minutes to complete.
-
Syslog Rules
Syslog Alarm Policy defines a pair of Syslog messages formats; one which raises the alarm, and one which clears the alarm.
Follow these steps to add a syslog rule.
-
Click Add Syslog Rule.
The Add Syslog Rule page appears.
-
Enter the necessary information to add a syslog rule.
Field Description Identifier
Specify the identifier portions of the raise and clear messages.
Syslog Raise
Define the format of a syslog raise message. The syntax is as follows: Facility-Severity-Type: Message
Syslog Clear
Define the format of a syslog clear message. The syntax is as follows: Facility-Severity-Type: Message
Policy Name
Specify the name for this policy. It must be unique.
Policy Details
Specify a brief description for this policy.
Forwarding
Determine if you want to enable forwarding using email, SNMP, or all, or leave the option set at None if you do not want to enable forwarding
Severity
Determine if you want to set the severity threshold at Minor, Major, Warning, or Critical.
What is wrong
Enter text that describes what went wrong.
What triggered it
Enter text that describes what went triggered the alarm.
What’s the impact
Enter text that describes what the impact is.
How do I fix it?
Enter text that describes how to fix the issue.
-
Determine how you want to proceed after entering the information for the syslog rule.
-
Click Save and Add New to save the information for this syslog rule and to add another syslog rule
-
Click Save to save the information for this syslog rule and exit the page
-
Click Cancel to exit out of the page without saving
-
GPU
To customize GPU anomaly thresholds, locate a row with "GPU" in the Anomaly Category column and click the entry in the Status column.
Follow these steps to customize thresholds for GPU anomalies.
-
In the Customize thresholds for GPU anomalies table, find the anomaly whose thresholds you want to customize and click the edit (pencil) icon.
The Customize thresholds for GPU anomalies table can have multiple pages. If necessary, use the page controls at the bottom of the table to find the desired anomaly.
-
Specify the desired percentage for each anomaly level, and click the green check mark.
After you customize the thresholds, Nexus Dashboard recalculates the anomaly levels of existing anomalies, which takes approximately 30 minutes to complete.
Click Reset to reset the values to their defaults or X to cancel the edit.
-
The values range from 0 to 100. A value of 0 indicates Nexus Dashboard will not raise any anomalies for that severity. If you enter 0 for all of the severities, Nexus Dashboard suppresses the anomaly completely.
-
The value for Warning must be lower than the value for Major, and the value for Major must be lower than the value for Critical.
-
The value defined for Major sets the upper limit of the range defined for Warning, and the value defined for Critical sets the upper limit of the range defined for Major.
-
Anomaly rules
Anomaly rules act on raised anomalies (even those based on global rules) to change properties of the anomaly such as severity, acknowledge, custom recommendation, and suppression. These rules allow for wider match criteria options to control the properties of all supported anomaly types. You can also match an alert against an anomaly rule using the match criteria.
Anomaly rules also allow you to customize an anomaly by adding a custom message that will be displayed when an anomaly is raised based on the anomaly rule. You can also suppress anomalies that are not relevant to your environment. Suppressed anomalies are not included in normal anomaly views or anomaly counts, but they can appear in the correlation graph when they are part of a root-cause relationship.
-
An anomaly rule contains the match criteria required to match an anomaly against the rule and the action that should be applied on the matched anomaly.
-
An anomaly rule can contain multiple match criteria.
-
You can use attributes such as severity, category, anomaly title, and affected object match, to define the match criteria for the anomaly rule.
Affected object matchis not available for all scopes including system.
-
A match criteria can contain either single or multiple attributes. When there are multiple attributes, the AND operator is applied to all the attribute match conditions within a match criteria entry including the object matches.
-
If an anomaly rule contains multiple match criteria, then the anomaly matching any of the match criteria will be seen as matching the rule and all the actions of the rule get applied on that anomaly. The OR operator will apply to the criteria.
-
Anomaly rules using Match Criteria with Object Match Rule will only support the Equals to criteria.
-
An Anomaly rule can be enabled only if it contains at least one match criteria.
-
Anomaly rules are not supported for advisories.
-
If you create multiple anomaly rules, an anomaly with actions of only the first rule that matches the criteria is applied. No further rules are considered once a rule is matched. The order of rules are listed in the Anomaly rules tab.
-
If you specify multiple attributes in the match criteria entry of a rule, the conditions of each attribute must be met for the rule to be applied.
-
If you specify multiple conditions for an attribute, any of the conditions must be met for the attribute to evaluate as true.
-
If an anomaly rule uses the All Fabrics scope, the rule applies to all the existing and newly onboarded local fabrics.
-
All match criteria in a rule must use the same scope type: All Fabrics, System, or individual fabric scope. A fabric-scoped rule can include match criteria for different fabric names, but it cannot include All Fabrics or System match criteria in the same rule.
-
Rules that use the All Fabrics scope have higher priority than fabric-specific or system-specific scope rules.
-
When you select the Suppress action, the other actions are disabled because they are not applicable to suppressed anomalies.
-
If you specify multiple match criteria within an affected object, each criteria must be met.
In Nexus Dashboard 4.2.1, all matching options like fabric, category, title and relevant object matches for rule creation continue to be supported. Also, system anomaly titles have been added to allow users to create rules for system anomalies.
Additionally, the following new rule actions have been added:
-
Override the default severity level of an anomaly based on specific match criteria, with support for applying changes to existing anomalies.
-
Include the ability to apply changes to existing anomalies for all the supported actions. Instead of per-action option to apply changes to existing anomalies, this option will be per-rule and applies all actions of the rule to existing active anomalies.
-
Rules are applied and validated while adhering to the hiding behavior when Alert Suspend is enabled on a fabric.
-
Centralized management of alert rules for all use cases improves extensibility for more match options and actions in a unified way.
-
Support for alert rules based on
systemcategory.
Guidelines and limitations
-
In Nexus Dashboard release 4.3.1, the All Fabrics scope supports only the Suppress action.
-
When Apply all actions to existing active anomalies is selected, all actions in the rule are applied to matching existing active anomalies. This includes Acknowledge, Customize Anomaly, Override Severity, and Suppress. If you later disable or delete the rule, rule-based actions applied to active anomalies are reverted, except for the Suppress action. Anomalies that were already suppressed remain suppressed. To stop using the Suppress action in an All Fabrics rule, disable or delete the rule, or change the scope before selecting another action.
-
To stop using the Suppress action in an All Fabrics rule, disable or delete the rule, or change the scope before selecting another action. When you delete or disable a suppression rule, previously suppressed anomalies remain suppressed.
-
When the Override Severity action is reverted, the anomaly severity is reset to the default highest severity applicable to that anomaly.
-
Avoid using severity as a match criterion unless required. The Severity Override action cannot be applied when severity is selected as a match criterion.
-
When Apply all actions to existing active anomalies is not selected, the rule applies only to new anomaly instances that match the criteria.
-
If multiple anomaly rules can match an anomaly, only the first matching rule in the current rule priority order is applied.
-
Manual acknowledge and unacknowledge actions always take precedence over rule-based acknowledgement actions.
-
When an anomaly is automatically cleared by its source, Nexus Dashboard checks whether the anomaly matches an anomaly rule and applies the rule action, if applicable.
-
Updates caused by a user-created anomaly rule are not captured in audit logs.
-
The maximum number of anomaly rules supported across all fabrics is 500.
-
After upgrading to this release, review your anomaly rules. Invalid rules may be updated or deleted during the upgrade. You can manually add the rules again after the upgrade, if needed.
-
Rules that use the All Fabrics scope take higher priority than fabric-specific or system-specific rules.
-
New anomalies are raised if they no longer match an enabled suppression rule.
-
Use explicit match criteria whenever possible. A broad suppression rule, such as an All Fabrics rule that matches only a common category or severity, can suppress more anomalies than intended.
Create anomaly rules
Ensure that you have the required permissions to create anomaly rules.
Follow these steps to create custom anomaly rules. You can also add the Suppress action to an existing or new rule.
-
Navigate to Manage > Anomaly and Compliance Rules > Anomaly Rules.
-
Click Create Anomaly Rule.
-
Complete the following fields for General settings.
-
In the Name field, enter a descriptive name for the rule.
-
In the Description field, enter a description for the rule.
-
Choose the state to enable the rule to be active.
-
Click Add criteria to define the match criteria for the anomaly rule.
-
From the Scope drop-down list, select the scope for the rule. You can select a specific fabric, Platform-system, or All Fabrics.
Do not mix scope types in the same rule.
-
Select the attributes for the match criteria. You can use category, event title, object match rule, and severity to define the attribute for the match criteria. Select category and event title from the drop-down list.
-
Click Add Object Match Rule to define the supported affected objects for the match criteria.
Within a match criteria entry, all selected attributes, including object match rules, must match for the anomaly to match the rule.
-
Click Save.
-
-
Complete the following fields for Actions.
If you have selected All Fabrics as the scope, only the Suppress action is available. All other actions are disabled.
-
Use the toggle to choose Suppress.
Suppress prevents matched anomalies from being generated or exported. When you choose Suppress, the other actions are disabled because they are not applicable to suppressed anomalies. Suppression is permanent for anomalies already suppressed. Even if the rule is later disabled or deleted, the suppressed anomalies are not regenerated.
Before saving a rule with the Suppress action, you must review the affected categories in the warning dialog and click I Acknowledge. Nexus Dashboard creates a separate audit log entry for this acknowledgment, in addition to the audit log entry for rule creation or modification.
-
Use the toggle to choose Acknowledge.
The Acknowledge action automatically acknowledges anomalies that match the rule criteria and adjusts the anomaly score accordingly. If Apply all actions to existing active anomalies is not selected, the action applies only to new matching anomaly instances.
-
Use the toggle to choose Severity level override.
-
Use the toggle to choose Add comment.
Add comment allows you to customize an anomaly by adding a custom message that will be displayed when an anomaly is raised based on the anomaly rule.
-
Enter the recommendations to display for anomalies that match the rule.
To display more than one user-configured recommendation for the same anomaly, add all recommendations in the same rule action. In the Anomaly page, the recommendations are displayed in the How do I fix it? area.
-
Check Apply all actions to existing, active anomalies to apply the anomaly rule to existing instances of the anomalies matching the rule.
Uncheck the checkbox to apply the anomaly rule to matching new instances of anomalies.
-
-
In the Summary, review your selections and click Save.
The newly created rule is displayed in the Anomaly Rule table.
If you created a rule with the Suppress action, matching anomalies are suppressed after the rule is applied. The suppressed anomalies do not appear in standard anomaly views, system anomaly views, fabric anomaly tabs, anomaly summary cards, and anomaly counts.
Create an anomaly rule from an anomaly
You can create an anomaly rule from a single anomaly in the ungrouped anomaly view. This workflow opens the General settings page of the anomaly rule creation flow, with the fabric name, category, and anomaly title prepopulated from the selected anomaly. You can edit these values before you save the rule.
Follow these steps to create an anomaly rule from an anomaly.
-
Navigate to Analyze > Anomalies.
-
From the drop-down list, choose Ungrouped.
-
Select the desired anomaly from the Anomalies table.
-
From the Actions menu, choose Create rule from anomaly.
The Create Anomaly Rule page opens with the fabric, category, and anomaly title fields prepopulated.
You can create a rule from only one anomaly at a time. If you select multiple anomalies, the Create rule from anomaly action is not available.
-
Review or update the rule name, description, state, scope, and match criteria. You can modify the prepopulated fabric, category, and anomaly title before you save the rule.
The fabric, category, and anomaly title are prepopulated based on the selected anomaly. Object match rules and severity are not prepopulated and must be defined manually. If you do not add more specific match criteria, the rule will apply to all anomalies that match these values, not only the selected anomaly instance.
-
Choose the action that you want the rule to apply.
To suppress matching anomalies, choose Suppress. When you choose Suppress, the other actions are disabled.
-
If you choose Suppress, review the affected categories in the warning dialog and click I Acknowledge before you save the rule.
Nexus Dashboard creates a separate audit log entry for this acknowledgment, in addition to the entry for rule creation or modification.
-
In the Summary, review your selections and click Save.
If you created a suppression rule, matching anomalies are suppressed after the rule is applied.
Manage anomaly rules
Follow these steps to manage anomaly rules in Nexus Dashboard.
-
Navigate to Manage > Anomaly and Compliance Rules > Anomaly Rules. The anomaly rules are displayed in the Anomaly Rule table.
-
Use the search bar to filter the rules based on Name, Actions, and State.
-
Select an anomaly rule and click Edit Rule to edit.
-
Select an anomaly rule and click Delete Rule to delete the rule from the system.
-
Select an anomaly rule and click ellipsis icon. Click Enable to enable the rule. If the state is enabled, the rule will be applied in the next analysis. Before enabling an anomaly rule make sure that at least one match criteria is present in the anomaly rule.
-
Select an anomaly rule and click ellipsis icon. Click Disable to disable the rule. If All fabrics scoped rules are present, they have the highest priority.
Copyright
THE SPECIFICATIONS AND INFORMATION REGARDING THE PRODUCTS IN THIS MANUAL ARE SUBJECT TO CHANGE WITHOUT NOTICE. ALL STATEMENTS, INFORMATION, AND RECOMMENDATIONS IN THIS MANUAL ARE BELIEVED TO BE ACCURATE BUT ARE PRESENTED WITHOUT WARRANTY OF ANY KIND, EXPRESS OR IMPLIED. USERS MUST TAKE FULL RESPONSIBILITY FOR THEIR APPLICATION OF ANY PRODUCTS.
THE SOFTWARE LICENSE AND LIMITED WARRANTY FOR THE ACCOMPANYING PRODUCT ARE SET FORTH IN THE INFORMATION PACKET THAT SHIPPED WITH THE PRODUCT AND ARE INCORPORATED HEREIN BY THIS REFERENCE. IF YOU ARE UNABLE TO LOCATE THE SOFTWARE LICENSE OR LIMITED WARRANTY, CONTACT YOUR CISCO REPRESENTATIVE FOR A COPY.
The Cisco implementation of TCP header compression is an adaptation of a program developed by the University of California, Berkeley (UCB) as part of UCB’s public domain version of the UNIX operating system. All rights reserved. Copyright © 1981, Regents of the University of California.
NOTWITHSTANDING ANY OTHER WARRANTY HEREIN, ALL DOCUMENT FILES AND SOFTWARE OF THESE SUPPLIERS ARE PROVIDED “AS IS" WITH ALL FAULTS. CISCO AND THE ABOVE-NAMED SUPPLIERS DISCLAIM ALL WARRANTIES, EXPRESSED OR IMPLIED, INCLUDING, WITHOUT LIMITATION, THOSE OF MERCHANTABILITY, FITNESS FOR A PARTICULAR PURPOSE AND NONINFRINGEMENT OR ARISING FROM A COURSE OF DEALING, USAGE, OR TRADE PRACTICE.
IN NO EVENT SHALL CISCO OR ITS SUPPLIERS BE LIABLE FOR ANY INDIRECT, SPECIAL, CONSEQUENTIAL, OR INCIDENTAL DAMAGES, INCLUDING, WITHOUT LIMITATION, LOST PROFITS OR LOSS OR DAMAGE TO DATA ARISING OUT OF THE USE OR INABILITY TO USE THIS MANUAL, EVEN IF CISCO OR ITS SUPPLIERS HAVE BEEN ADVISED OF THE POSSIBILITY OF SUCH DAMAGES.
Any Internet Protocol (IP) addresses and phone numbers used in this document are not intended to be actual addresses and phone numbers. Any examples, command display output, network topology diagrams, and other figures included in the document are shown for illustrative purposes only. Any use of actual IP addresses or phone numbers in illustrative content is unintentional and coincidental.
The documentation set for this product strives to use bias-free language. For the purposes of this documentation set, bias-free is defined as language that does not imply discrimination based on age, disability, gender, racial identity, ethnic identity, sexual orientation, socioeconomic status, and intersectionality. Exceptions may be present in the documentation due to language that is hardcoded in the user interfaces of the product software, language used based on RFP documentation, or language that is used by a referenced third-party product.
Cisco and the Cisco logo are trademarks or registered trademarks of Cisco and/or its affiliates in the U.S. and other countries. To view a list of Cisco trademarks, go to this URL: https://www.cisco.com/go/trademarks. Third-party trademarks mentioned are the property of their respective owners. The use of the word partner does not imply a partnership relationship between Cisco and any other company. (1110R)
© 2017-2026 Cisco Systems, Inc. All rights reserved.
Americas Headquarters
Cisco Systems, Inc.
170 West Tasman Drive
San Jose, CA 95134-1706
USA
https://www.cisco.com
Tel: 408 526-4000
800 553-NETS (6387)
Fax: 408 527-0883