
New and changed information
The following table provides an overview of the significant changes up to this current release. The table does not provide an exhaustive list of all changes or of the new features up to this release.
| Release Version | Feature | Description |
|---|---|---|
|
Nexus Dashboard 4.3.1 |
Detecting Anomalies and Identifying Advisories in Your Nexus Dashboard article now split into two articles |
Prior to this release, a single Detecting Anomalies and Identifying Advisories in Your Nexus Dashboard article provided information on both anomalies and advisories. Beginning with this release, that information is now split into two separate articles:
|
|
Nexus Dashboard 4.3.1 |
Fabric group support |
Beginning with Nexus Dashboard release 4.3.1, you can now view advisory information at the fabric group level. For more information, see View advisories for a fabric group. |
Advisories
Nexus Dashboard identifies field notices, software and hardware end-of-life and end-of-sale announcements, as well as security advisories that can potentially impact the network fabrics that it is monitoring, and generate advisories. Advisories provides recommendations to keep your network under support and running in optimal conditions.
Advisories in Nexus Dashboard provide details of relevant impact from field notices, security advisories, EoL/EoS of hardware and software, and best practices. You can view the advisories by level and category for a particular fabric based on the selected time range.
Comprehensive security advisories that evaluate a range of device configurations, including specific product IDs (PIDs), SSH configurations, Bash configurations, and so on, require the Advantage tier subscription. Essentials tier subscribers receive security advisories based only on device software versions, such as a security advisory for an affected software version. For more information about bug scan, refer to the section "Collecting information on bugs that might affect your network using Bug scan" in Analyzing and Troubleshooting Your Network.
When Advisories identifies field notices that can potentially impact the network fabrics that it is monitoring, Nexus Dashboard validates the serial number of the devices in the fabrics against a list of affected device serial numbers in each field notice. If a serial number is not included in a field notice, Nexus Dashboard excludes that field notice. For Advisories to validate the device serial numbers, Nexus Dashboard must have an Internet connection and be connected to and registered to Cisco Intersight. Without such connectivity, Advisories cannot validate the serial numbers, which can result in Advisories incorrectly including field notices that do not apply. Not all field notices include serial number validation.
Click a particular advisory to view information such as What’s wrong, What’s the impact, and How do I fix it.
Advisories enable you to stay current with
-
new software and hardware availability
-
hardware and software EoS and EoL announcements and lead time for upgrades
-
security advisories and field notices, which helps you stay secure and compliant, and
-
instant visibility into applicable bugs.
Advisories are classified into three levels: critical, major, and warning.
-
Critical: Advisories are shown as critical when there are unsupported infrastructure and the severity of the bugs associated with notices is Severity1. Some of the examples include:
-
When switches in a fabric are running under End-of-Life conditions. When a critical (Severity1) field notice or security advisory has been issued for a switch or software version currently running in your network.
-
-
Major: Advisories are shown as major when the severity of the bugs associated with notices is Severity2. Some of the examples include:
-
When a critical (Severity2) field notice or security advisory has been issued for a switch or software version currently running in your network.
-
-
Warning: Advisories are shown as warning when there is support for potentially at risk infrastructure and the severity of the bugs associated with notices is Severity3. Some of the examples include:
-
When switches in a fabric are approaching end-of-life conditions. When a Severity3 field notice or security advisory has been issued for a switch or software version currently running in your network.
-
Navigate to Advisories
You can view advisories in Nexus Dashboard at different levels such as across all fabrics, for a specific fabric, for a specific switch, or for system-wide advisories. Use the following methods to access advisory details.
View all advisories across all fabrics
Follow these steps to view all advisories across all fabrics.
-
Navigate to Analyze > Advisories.
This displays all advisories detected across all fabrics in your environment.
View advisories for a single fabric
Follow these steps to view the advisories for a single fabric.
-
Navigate to Manage > Fabrics.
-
Click the appropriate fabric from the list of fabrics.
The Overview page for that fabric appears.
-
Click the Advisories tab to view advisories specific to that fabric.
View advisories for a fabric group
Follow these steps to view the advisories for a fabric group.
-
Navigate to Manage > Fabrics > Fabric groups.
-
Click the appropriate fabric group from the list of fabric groups.
The Overview page for that fabric group appears.
The advisory summary values displayed in the Overview page are an aggregation of the advisory values of all member fabrics.
-
Click the Advisories tab to view advisories specific to that fabric group.
Advisories belonging to member fabrics list the member fabric name in the Fabric column.
View security advisories
Follow these steps to view the security advisories.
-
Navigate to Home > Overview.
-
Choose online fabrics or snapshot fabrics from the drop-down list.
-
Click Security advisories in the Advisory level card.
-
Click Active advisories.
View advisories for a single switch
Follow these steps to view the advisories for a single switch in the Inventory page.
-
Navigate to Manage > Inventory.
-
Choose online fabrics or snapshot fabrics from the drop-down list.
-
Choose a switch.
The Switch Overview page displays.
-
Click the Advisories tab.
View system advisories
Follow these steps to view the system advisories.
-
Navigate to Admin > System Status.
-
Click the Advisories tab.
Analyze advisories
Follow these steps to analyze advisories.
-
Click the Date and Time selector to choose the time range.
-
Use the search bar to filter the advisories.
-
The Advisories table displays the filtered advisories. The advisories are sorted by Level by default. Click the column heading to sort the advisories in the table.
-
Click the gear icon to configure the columns in the Advisories table. By default, the columns Title, Level, Category, and Fabric are displayed.
-
Click an advisory to view the additional details such as What’s wrong?, What’s the impact?, and How do I fix it?.
-
Choose advisories from the Advisories table and click Acknowledge Advisories to acknowledge advisories.
You can also click an advisory in the Advisory page and choose Acknowledge Advisory from the Actions drop-down list.
By default all the unacknowledged Advisories are displayed in the advisories table. Once you acknowledge an advisory, choose Acknowledged from the drop-down list to view all the acknowledged advisories.
View platform and system alerts in global advisories table
System advisories allow you to view information about updates, issues, or required actions related to a system, application, or network. These advisories ensure that you are aware of critical information that might impact the system’s performance, security, or operation.
Follow these steps to include system-related advisories.
-
Navigate to Analyze > Advisories.
The Advisories page displays.
-
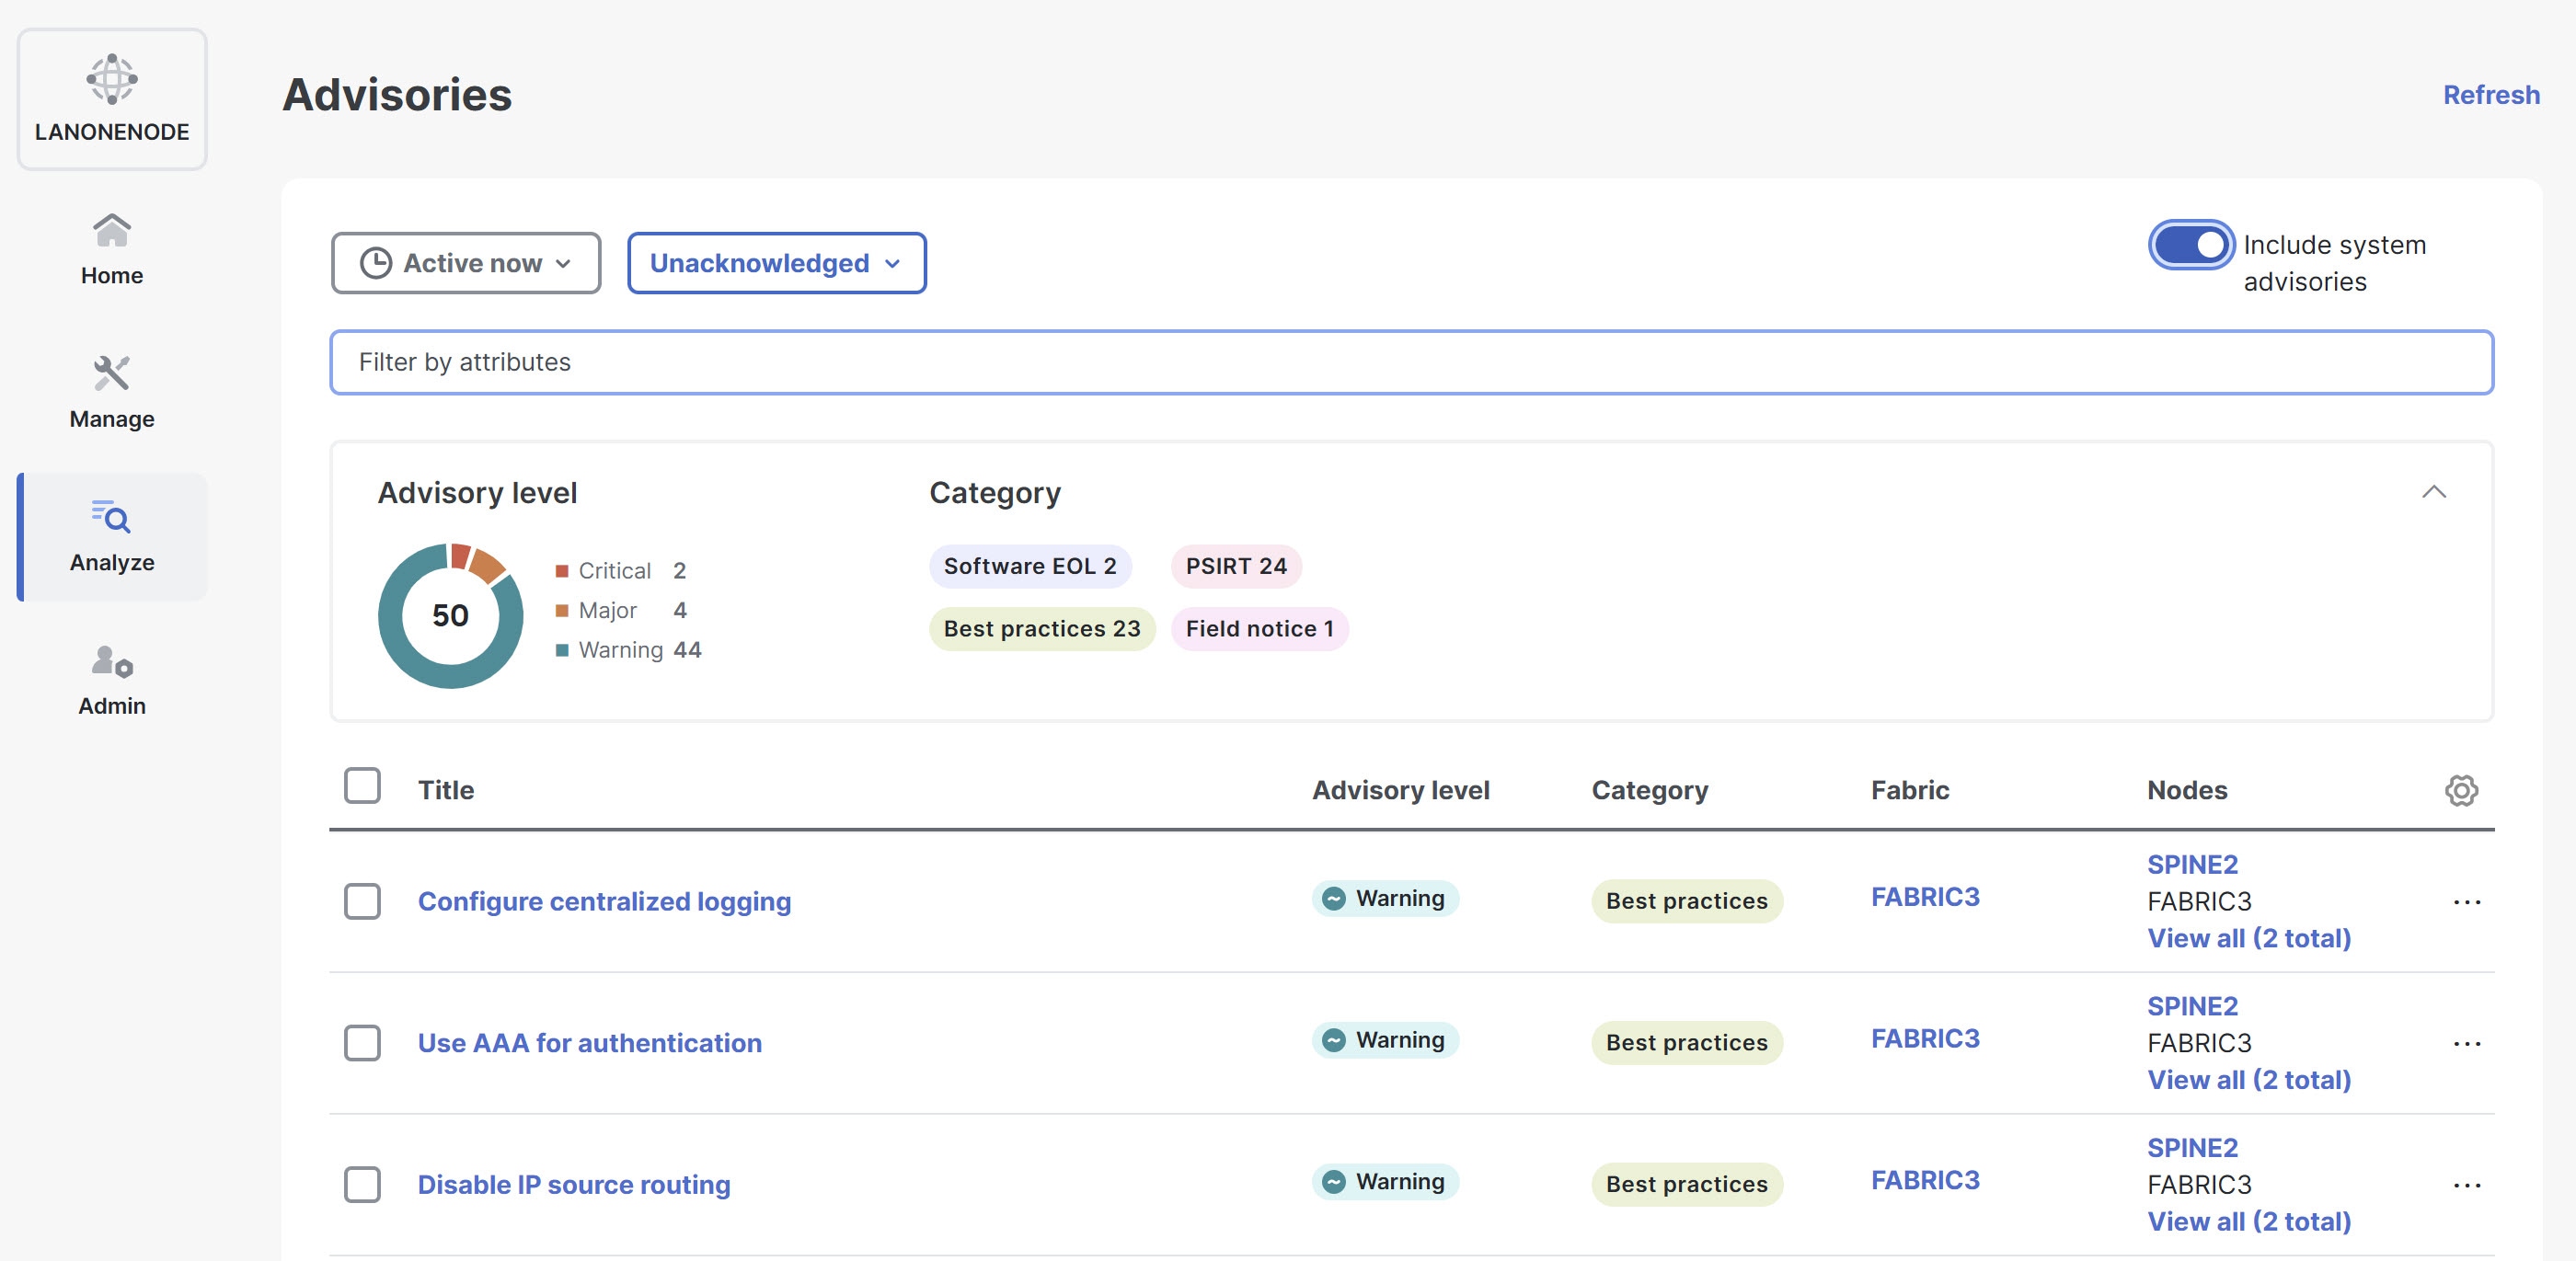
Click the Include system advisories toggle button in the top-right corner, to include system-related advisories in the Advisories table.
Once enabled, the System category appears under advisories by category in the Advisories page.
System advisory notification
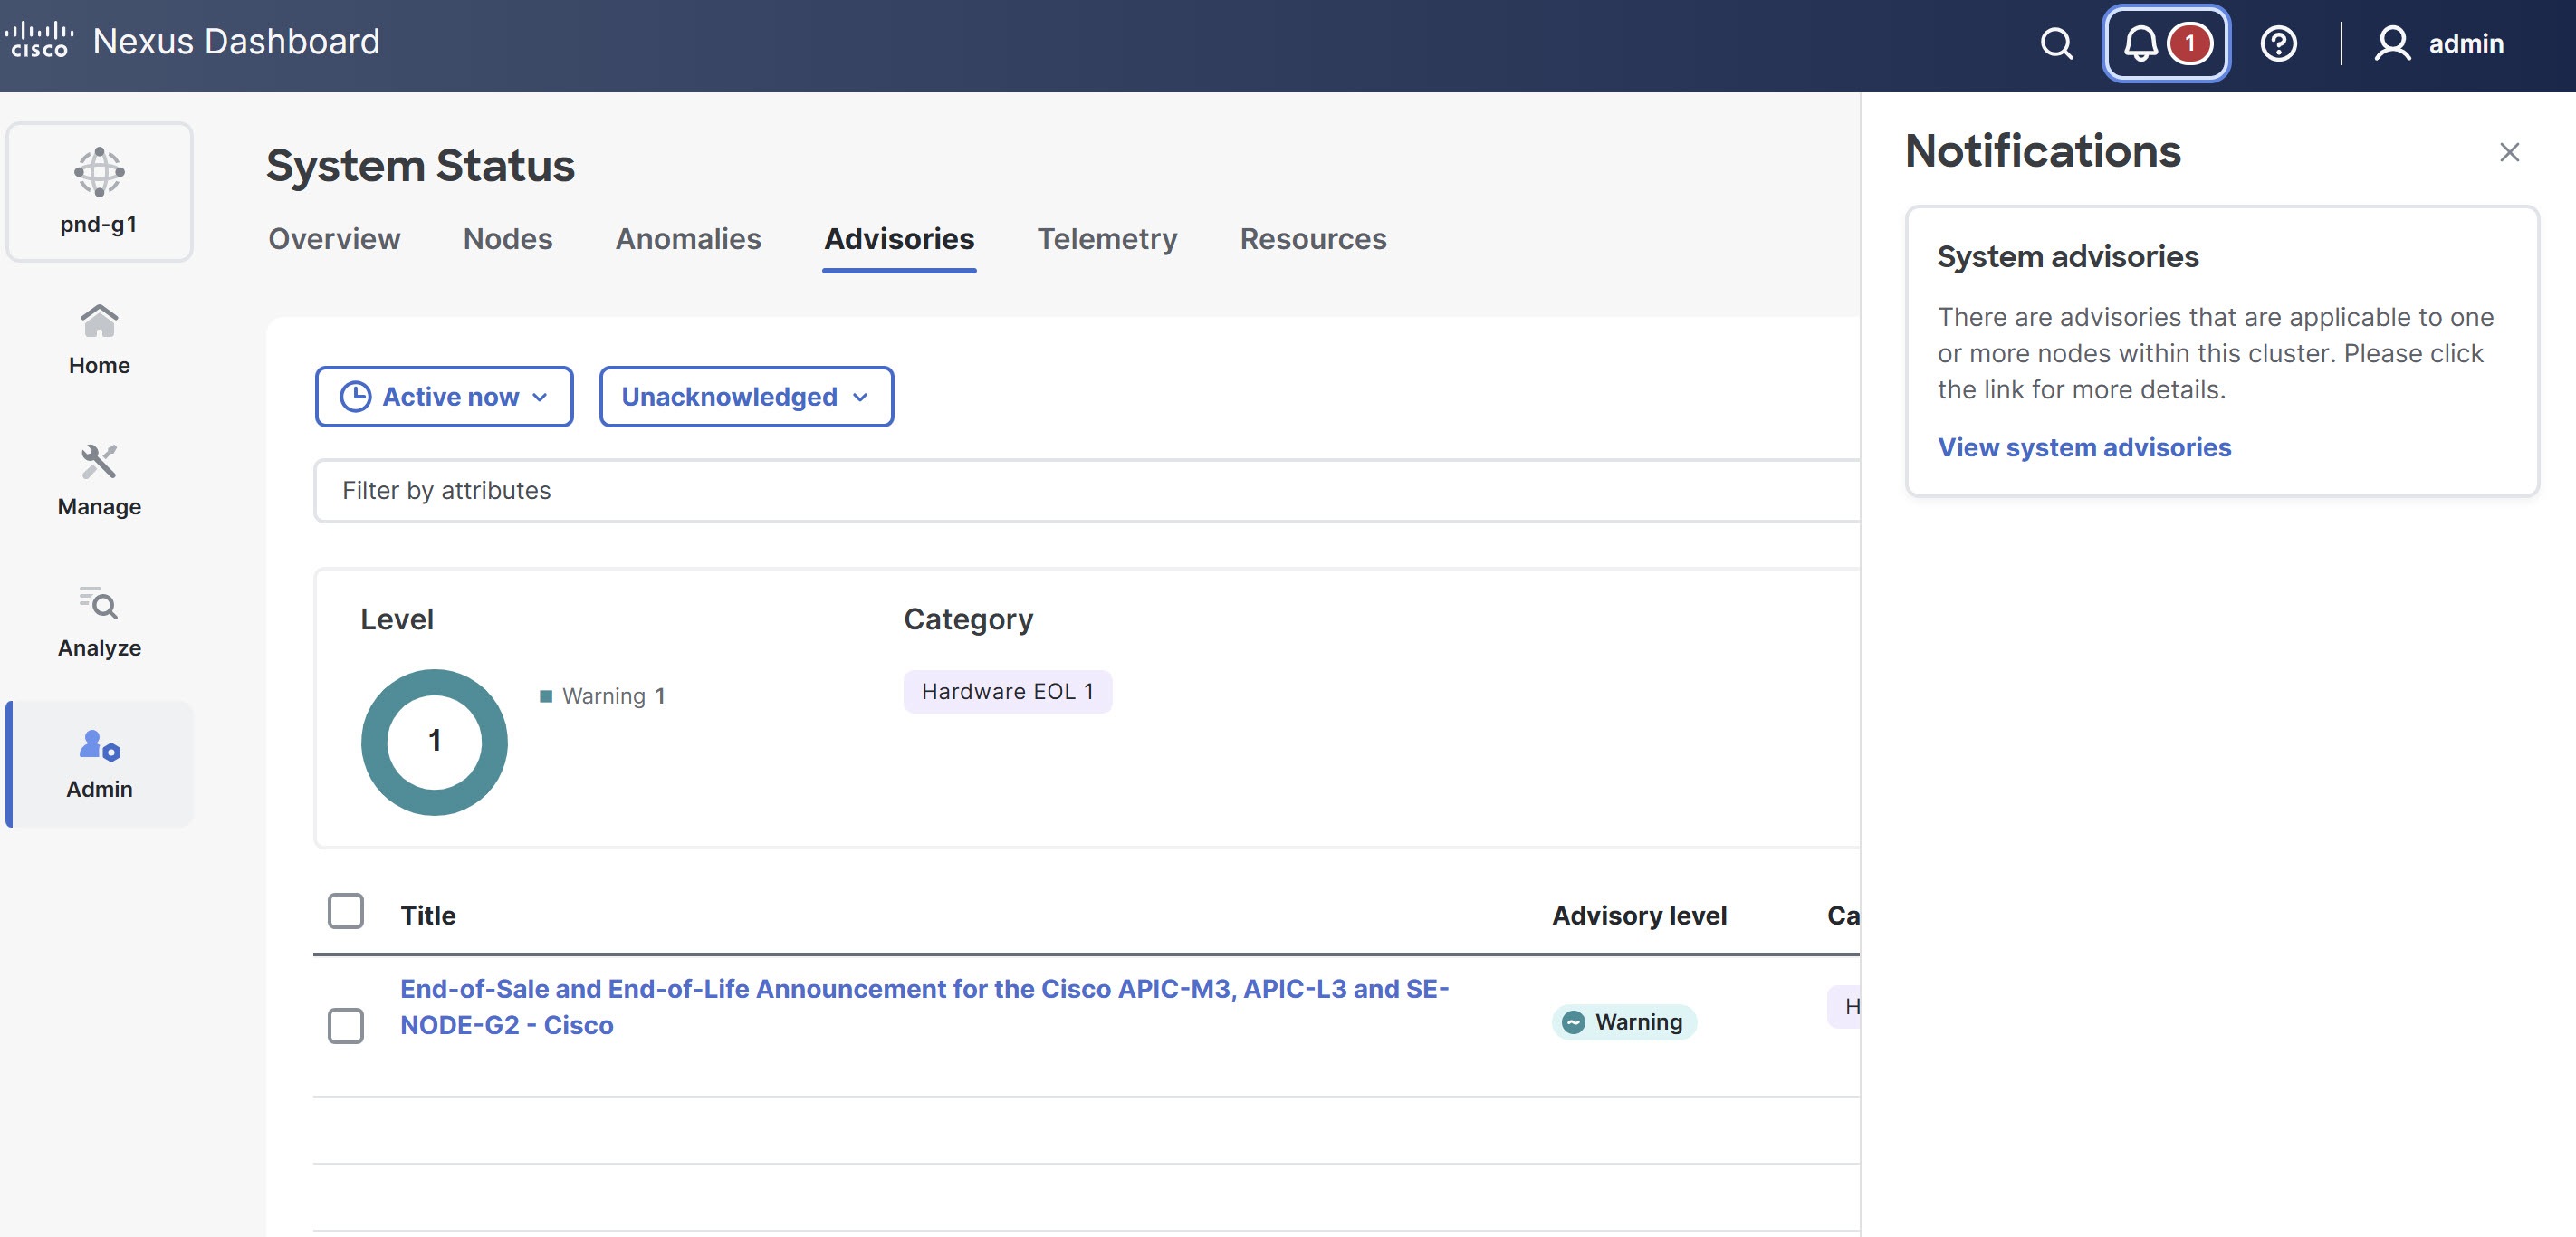
When there is an active system advisory, a notification alert appears on the Notifications bell icon located in the common navigation bar at the top of the page. Click the notification bell icon to open the Notifications pane. In the Notifications pane, click View system advisories. Nexus Dashboard redirects you to the System Status page, where you can review the full list of current and past system advisories in the Advisories table.
Advisory filters
The search bar allows you to filters the advisories. In the Advisories page, you can use the following filters to refine the displayed advisories:
-
Title - Display advisories with a specific title.
-
Advisory Level - Display advisories of a specific level.
-
Detection Time - Display advisories with a specific detection time.
-
Last Seen time - Display only advisories with a specific last seen time. Last Seen Time indicates the time advisory was updated while under active status. If the status of the advisory is not cleared, then the advisory is active.
-
Category - Display advisories from a specific category.
-
Fabric - Display advisories for a specific fabric.
-
Nodes - Display advisories for specific nodes.
-
What’s wrong? - Display advisories of a specific affected object.
As a secondary filter refinement, use the following operators:
-
==- with the initial filter type, this operator, and a subsequent value, returns an exact match. -
!=- with the initial filter type, this operator, and a subsequent value, returns all that do not have the same value. -
contains- with the initial filter type, this operator, and a subsequent value, returns all that contain the value. -
!contains- with the initial filter type, this operator, and a subsequent value, returns all that do not contain the value.
Metadata support
Nexus Dashboard uses metadata bundles to detect new bugs, security advisories, Field Notices, and End of Life Notices. Metadata packages are constantly updated by us and posted to the Cisco Intersight Cloud after validation. Nexus Dashboard connects to the Cisco Intersight Cloud through a device connector that is embedded in the Nexus Dashboard platform and that pulls periodically updated metadata packages. With metadata support for air-gapped environment, if Nexus Dashboard is not connected to Cisco Intersight Cloud, you can manually upload the latest metadata to Nexus Dashboard in a secure and trusted way. You can download the bundle updates from the Cisco DC App Center.
Navigate to Admin > System Settings > Metadata to view the metadata version.
-
In the General area, the Metadata Version is displayed.
-
In the Update Metadata Version area, you can upload metadata for air-gapped environments.
Metadata support for air-gapped environment
With metadata support for air-gapped environment, if Nexus Dashboard is not connected to Cisco secure cloud, you can upload the latest metadata to Nexus Dashboard periodically in a secure and trusted way.
You can download the encrypted metadata file from the Cisco DC App Center and upload it to Nexus Dashboard to get decrypted updates on exposure to Bugs, security advisories, Defects, Field Notices, and End of Life Notices.
Update metadata version
Follow these steps to update the latest metadata version in an air-gapped or offline environment.
-
Log in to Cisco DC App Center.
-
From the User drop-down list, choose My Account.
-
Click Config Files Requests tab.
-
Click Request Config File.
-
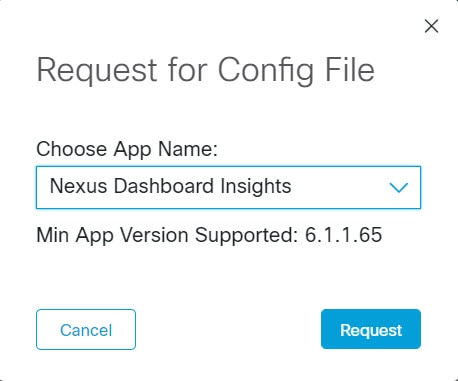
From the Choose App ID drop-down list, select Nexus Dashboard.
-
Verify the minimum supported app version and click Request.
It takes approximately 15 minutes for the request to be completed. In the Config Files Request page, the generated file is displayed in the table below.
-
Select the file and click Download to download the file locally.

-
Log in to Nexus Dashboard.
-
Navigate to Admin > System Settings > Metadata to view the metadata version.
-
In the Update Metadata Version area, upload the file you have downloaded from the Cisco DC App Center.
-
Click Begin Upload to upload the latest metadata.
Copyright
THE SPECIFICATIONS AND INFORMATION REGARDING THE PRODUCTS IN THIS MANUAL ARE SUBJECT TO CHANGE WITHOUT NOTICE. ALL STATEMENTS, INFORMATION, AND RECOMMENDATIONS IN THIS MANUAL ARE BELIEVED TO BE ACCURATE BUT ARE PRESENTED WITHOUT WARRANTY OF ANY KIND, EXPRESS OR IMPLIED. USERS MUST TAKE FULL RESPONSIBILITY FOR THEIR APPLICATION OF ANY PRODUCTS.
THE SOFTWARE LICENSE AND LIMITED WARRANTY FOR THE ACCOMPANYING PRODUCT ARE SET FORTH IN THE INFORMATION PACKET THAT SHIPPED WITH THE PRODUCT AND ARE INCORPORATED HEREIN BY THIS REFERENCE. IF YOU ARE UNABLE TO LOCATE THE SOFTWARE LICENSE OR LIMITED WARRANTY, CONTACT YOUR CISCO REPRESENTATIVE FOR A COPY.
The Cisco implementation of TCP header compression is an adaptation of a program developed by the University of California, Berkeley (UCB) as part of UCB’s public domain version of the UNIX operating system. All rights reserved. Copyright © 1981, Regents of the University of California.
NOTWITHSTANDING ANY OTHER WARRANTY HEREIN, ALL DOCUMENT FILES AND SOFTWARE OF THESE SUPPLIERS ARE PROVIDED “AS IS" WITH ALL FAULTS. CISCO AND THE ABOVE-NAMED SUPPLIERS DISCLAIM ALL WARRANTIES, EXPRESSED OR IMPLIED, INCLUDING, WITHOUT LIMITATION, THOSE OF MERCHANTABILITY, FITNESS FOR A PARTICULAR PURPOSE AND NONINFRINGEMENT OR ARISING FROM A COURSE OF DEALING, USAGE, OR TRADE PRACTICE.
IN NO EVENT SHALL CISCO OR ITS SUPPLIERS BE LIABLE FOR ANY INDIRECT, SPECIAL, CONSEQUENTIAL, OR INCIDENTAL DAMAGES, INCLUDING, WITHOUT LIMITATION, LOST PROFITS OR LOSS OR DAMAGE TO DATA ARISING OUT OF THE USE OR INABILITY TO USE THIS MANUAL, EVEN IF CISCO OR ITS SUPPLIERS HAVE BEEN ADVISED OF THE POSSIBILITY OF SUCH DAMAGES.
Any Internet Protocol (IP) addresses and phone numbers used in this document are not intended to be actual addresses and phone numbers. Any examples, command display output, network topology diagrams, and other figures included in the document are shown for illustrative purposes only. Any use of actual IP addresses or phone numbers in illustrative content is unintentional and coincidental.
The documentation set for this product strives to use bias-free language. For the purposes of this documentation set, bias-free is defined as language that does not imply discrimination based on age, disability, gender, racial identity, ethnic identity, sexual orientation, socioeconomic status, and intersectionality. Exceptions may be present in the documentation due to language that is hardcoded in the user interfaces of the product software, language used based on RFP documentation, or language that is used by a referenced third-party product.
Cisco and the Cisco logo are trademarks or registered trademarks of Cisco and/or its affiliates in the U.S. and other countries. To view a list of Cisco trademarks, go to this URL: https://www.cisco.com/go/trademarks. Third-party trademarks mentioned are the property of their respective owners. The use of the word partner does not imply a partnership relationship between Cisco and any other company. (1110R)
© 2017-2026 Cisco Systems, Inc. All rights reserved.
Americas Headquarters
Cisco Systems, Inc.
170 West Tasman Drive
San Jose, CA 95134-1706
USA
https://www.cisco.com
Tel: 408 526-4000
800 553-NETS (6387)
Fax: 408 527-0883