
New and changed information
The following table provides an overview of the significant changes up to this current release. The table does not provide an exhaustive list of all changes or of the new features up to this release.
| Release Version | Feature | Description |
|---|---|---|
|
Nexus Dashboard 4.1.1 |
Improved navigation and workflow when editing AI Data Center Routed fabric settings. |
Beginning with Nexus Dashboard 4.1.1, the navigation and workflow when editing AI Data Center Routed fabric settings in Nexus Dashboard have been enhanced. |
Editing AI Data Center Routed fabric settings
A AI Data Center Routed fabric is a type of fabric that provides automated provisioning of AI ready BGP Layer 3 networks on Cisco Nexus (NX-OS) devices.
When you first create a AI Data Center Routed fabric using the procedures provided in Creating LAN and ACI Fabrics and Fabric Groups, the standard workflow allows you to create a fabric using the bare minimum settings so that you are able to create a fabric quickly and easily. Use the procedures in this article to make more detailed configurations for your routed fabric.
-
Navigate to the main Fabrics window:
Manage > Fabrics
-
Locate the fabric that you want to edit.
-
Click the circle next to the routed fabric that you want to edit to select that fabric, then click Actions > Edit Fabric Settings.
The Edit fabric_name Settings window appears.
-
Click the appropriate tab to edit these settings for the fabric:
-
Telemetry (if the Telemetry feature is enabled for the fabric)
General
Use the information in this section to edit the settings in the General window for your routed fabric.
Change the general parameters that you configured previously for the routed fabric, if necessary, or click another tab to leave these settings unchanged.
| Fabric type | Description |
|---|---|
|
Name |
The name for the fabric. This field is not editable. |
|
Type |
The fabric type for this fabric. This field is not editable. |
|
Location |
Choose the location for the fabric. |
|
BGP ASN for Spines |
Enter the BGP autonomous system number (ASN) for the fabric’s spine switches. |
|
AI QOS & Queuing policy |
Choose the queuing policy from the drop-down list based on the predominant fabric link speed for certain switches in the fabric. For more information, see AI QoS classification and queuing policies. Options are:
|
|
License tier |
Choose the licensing tier for the fabric:
Click on the information icon (i) next to License tier to see what functionality is enabled for each license tier. |
|
Enabled features |
Check the Telemetry check box to enable telemetry for the fabric. This is the equivalent of enabling the Nexus Dashboard Insights service in previous releases. |
|
Telemetry collection |
This option becomes available if you choose to enable Telemetry in the Enabled features field above. Choose either Out-of-band or In-band for telemetry collection. |
|
Telemetry streaming |
This option becomes available if you choose to enable Telemetry in the Enabled features field above. Choose either IPv4 or IPv6 for telemetry streaming. |
|
Security domain |
Choose the security domain for the fabric. |
Fabric Management
Use the information in this section to edit the settings in the Fabric Management window for your AI Data Center Routed fabric. The tabs and their fields in the screen are explained in the following sections. The fabric-level parameters are included in these tabs.
General Parameters
The General Parameters tab is displayed, by default. The fields in this tab are described in the following table.
| Field | Description |
|---|---|
|
BGP ASN for Super Spines |
Enter the ASN used for super spine and border super spines, if the fabric contains any super spine or border super spine switches. |
|
BGP ASN for Leafs |
Enter the ASN used for leaf switches, if the fabric contains any leaf switches. |
|
BGP ASN for Border and Border Gateway switches |
Enter the ASN used for border and border gateway switches, if the fabric contains any border and border gateway switches. |
|
BGP AS Mode |
Choose Multi-AS or Same-Tier-AS.
In both Multi-AS and Same-Tier-AS, all spine switches in a fabric share one unique AS number. The fabric is identified by the spine switch ASN. |
|
Allow Same ASN On Leafs |
Uses the same ASN on all the leaf nodes even when you have configured Multi-AS mode. |
|
Enable IPv6 routed fabric or VXLAN with IPv6 underlay |
Enables IPv6 routed fabric or IPv6 underlay. With the checkbox cleared, the system configures IPv4 routed fabric or IPv4 underlay. To configure IPv6 underlay, you must also configure the VXLAN overlay parameters in the EVPN tab. |
|
Underlay Subnet IP Mask |
Specifies the subnet mask for the fabric interface IP addresses. |
|
Manual Underlay IP Address Allocation |
Check the check box to disable dynamic underlay IP address allocations. |
|
Underlay Routing Loopback IP Range |
Specifies the loopback IPv4 addresses for protocol peering. |
|
Underlay Subnet IP Range |
Specifies the IPv4 addresses for underlay P2P routing traffic between interfaces. |
|
Underlay Routing Loopback IPv6 Range |
Specifies the loopback IPv6 addresses for protocol peering. |
|
Disable Route-Map Tag |
Disables subnet redistribution. |
|
Route-Map Tag |
Configures a route tag for redistributing subnets. By default, the tag value of 12345 is configured, when enabled. |
|
Subinterface Dot1q Range |
Specifies the subinterface range when Layer 3 sub interfaces are used. |
|
Enable Performance Monitoring |
Check the check box to enable performance monitoring. Ensure that you do not clear interface counters from the command-line interface of the switches. Clearing interface counters can cause the Performance Monitor to display incorrect data for traffic utilization. If you must clear the counters and the switch has both 
Performance monitoring is supported on switches with NX-OS Release 9.3.6 and later. |
EVPN
| Field | Description |
|---|---|
|
Enable EVPN VXLAN Overlay |
Enables the VXLAN overlay provisioning for the fabric. You can convert a routed fabric to a VXLAN enabled fabric by selecting this option. When the fabric is VXLAN enabled, you can create and deploy overlay networks or VRF instances. The procedure for creating and deploying networks or VRFs is the same as in Data Center VXLAN EVPN. For more information, see the "Creating Network for Standalone Fabrics" and "Creating VRF" sections in Editing Data Center VXLAN EVPN Fabric Settings. You must uncheck the Enable EVPN VXLAN Overlay check box to create a routed fabric (an IP fabric with no VXLAN encapsulation). In a routed fabric, you can create and deploy networks. For more information, see the section "Overview of Networks in a Routed Fabric" in Editing Routed Fabric Settings. Whether you create an eBGP routed or eBGP VXLAN fabric, the fabric uses eBGP as the control plane to build intra-fabric connectivity. Links between spine and leaf switches are auto-configured with point-to-point (P2P) numbered IP addresses with eBGP peering built on top. If a network or a VRF is created in a fabric, you cannot switch between VXLAN EVPN mode and routed fabric mode by selecting the Enable EVPN VXLAN Overlay check box. You need to delete these networks or VRFs to change the fabric setting. Routed_Network_Universal Template is applicable to a routed fabric only. When you convert the routed fabric to a VXLAN EVPN fabric, set the network template and network extension template to the ones defined for VXLAN EVPN: Default_Network_Universal and Default_Network_Universal. If you have a customized template for a VXLAN EVPN fabric, you can also choose to use it. |
|
First Hop Redundancy Protocol |
This field is available if you did not select the Enable EVPN VXLAN Overlay option above. This field is only applicable to a routed fabric. Specify the First Hop Redundancy Protocol that you want to use:
After a network has been created, you cannot change this fabric setting. You should delete all networks, and then change the First Hop Redundancy Protocol setting. |
|
The following fields in the EVPN tab are only applicable if you selected the Enable EVPN VXLAN Overlay option above. |
|
|
Anycast Gateway MAC |
Specifies the anycast gateway MAC address for the leaf switches. |
|
Enable VXLAN OAM |
Enables the VXLAN operations, administration, and maintenance (OAM) function for existing switches. This is enabled by default. Uncheck the check box to disable VXLAN OAM feature. If you want to enable the VXLAN OAM on specific switches and disable on other switches in the fabric, use freeform configurations to enable OAM and disable OAM in the fabric settings.
The VXLAN OAM feature in Nexus Dashboard is supported on a single fabric or site only. VXLAN OAM is not supported with multi-site fabrics. |
|
Enable Tenant DHCP |
Enables tenant DHCP support. |
|
vPC advertise-pip |
Check the check box to enable the advertise PIP (primary IP address) feature on vPC enabled leaf or border leaf switches. |
|
vPC advertise-pip on Border only |
Check the check box to enable advertise-pip on vPC border switches and border gateways only. Applicable only when the vPC advertise-pip option is not enabled. |
|
Replication Mode |
Specifies the mode of replication that is used in the fabric - ingress replication or multicast. |
|
Multicast Group Subnet |
Specifies the IP address prefix used for multicast communication. A unique IP address is allocated from this group for each overlay network. This field is used when the underlay is IPv4 and replication mode is multicast.
We recommend using the old multicast group pool into the spine or leaf freeform if they are being referenced by existing networks (and potentially VRFs if TRM is enabled) and in use. Use the new or updated multicast group pool in the Multicast Group Subnet settings. This ensures that the new or updated multicast pool is used for every new network. |
|
IPv6 Multicast Group Subnet |
Specifies the IPv6 address prefix used for multicast communication. A unique IP address is allocated from this group for each overlay network. This field is used when the underlay is IPv6 and replication mode is multicast. |
|
Enable IPv4 Tenant Routed Multicast |
Check the check box to enable Tenant Routed Multicast (TRM) for IPv4 support for VXLAN EVPN fabrics. For more information, see the section "Creating a VXLAN EVPN Fabric Using the Data Center VXLAN EVPN template" in Editing Data Center VXLAN EVPN Fabric Settings. |
|
Enable IPv6 Tenant Routed Multicast (TRMv6) |
Check the check box to enable Tenant Routed Multicast (TRM) for IPv6 support for VXLAN EVPN fabrics. For more information, see the section "Configuring VXLAN EVPN Fabrics with a PIMv6 Underlay and TRMv6" in Editing Data Center VXLAN EVPN Fabric Settings. |
|
Default MDT Address for TRM VRFs |
Indicates the multicast address for TRMv4 traffic. By default, this address is from the IP prefix specified in the Multicast Group Subnet field. When you update either field, ensure that the address is chosen from the IP prefix specified in Multicast Group Subnet. |
|
Default MDT IPv6 Address for TRM VRFs |
Indicates the multicast address for TRMv6 traffic. By default, this address is from the IP prefix specified in the IPv6 Multicast Group Subnet field. When you update either field, ensure that the address is chosen from the IP prefix specified in the IPv6 Multicast Group Subnet field. For more information, see the section "Overview of Tenant Routed Multicast" in Editing Data Center VXLAN EVPN Fabric Settings. |
|
Rendezvous-Points |
Enter the number of spine switches acting as rendezvous points. |
|
RP mode |
Choose from the two supported multicast modes of replication - ASM (for Any-Source Multicast [ASM]) or BiDir (for Bidirectional PIM [BIDIR-PIM]). When you enable multicast mode, only the fields pertaining to that multicast mode is enabled and the fields related to other the multicast mode are disabled.
BIDIR-PIM is supported on Cisco’s Cloud Scale Family platforms 9300-EX and 9300-FX/FX2, and with NX-OS Release 9.2(1) and later. |
|
Underlay RP Loopback ID |
Specifies the loopback ID used for the Rendezvous Point (RP). The default is 254. |
|
The following fields are enabled if you choose bidir as the RP mode. Depending on the RP count, either 2 or 4 phantom RP loopback ID fields are enabled. |
|
|
Underlay Primary RP Loopback ID |
Specifies the primary loopback ID used for phantom RP. |
|
Underlay Backup RP Loopback ID |
Specifies the secondary (or backup) loopback ID used for Fallback Bidir-PIM phantom RP. |
|
The following Loopback ID options are applicable only when the RP count is 4 and if bidir is chosen. |
|
|
Underlay Second Backup RP Loopback ID |
Specifies the second backup loopback ID used for phantom RP. |
|
Underlay Third Backup RP Loopback ID |
Specifies the third backup loopback ID used for phantom RP. |
|
Enable MVPN VRI ID Generation |
This field was previously named Allow L3VNI w/o VLAN. In an IPv4 underlay, enabling this option generates an MVPN VRI ID if there is a VRF with TRM or TRMv6 and no VRF with Layer 3 VNI VLAN. In an IPv6 underlay, an MVPN VRI ID is generated once TRM or TRMv6 is enabled, regardless of whether this option is enabled or not. For more information, see Layer 3 VNI without VLAN. |
|
MVPN VRI ID Range |
Use this field for allocating a unique MVPN VRI ID per vPC. This field is needed for the following conditions:
The MVPN VRI ID cannot be the same as any site ID within a multi-site fabric. The VRI ID has to be unique within all sites within an MSD. |
|
Enable MVPN VRI ID Re-allocation |
Enable this check box to generate a one-time VRI ID reallocation. Nexus Dashboard automatically allocates a new MVPN ID within the MVPN VRI ID range above for each applicable switch. Since this is a one-time operation, after performing the operation, this field is turned off. 
Changing the VRI ID is disruptive, so plan accordingly. |
|
VRF Template |
Specifies the VRF template for creating VRFs, and the VRF extension template for enabling VRF extension to other fabrics. |
|
VRF Extension Template |
|
|
Network Template |
Specifies the network template for creating networks, and the network extension template for extending networks to other fabrics. |
|
Network Extension Template |
|
|
Overlay Mode |
Specify the VRF/network configuration using one of the following options:
The default option is config-profile. The overlay mode can only be changed before deploying overlay configurations to the switches. After the overlay configuration is deployed, you cannot change the mode unless all the VRF and network attachments are removed. For a brownfield import, if the overlay is deployed as config-profile, it can be imported in the config-profile mode only. However, if the overlay is deployed as cli, it can be imported in either config-profile or cli modes. |
|
The Allow L3VNI w/o VLAN option has been renamed to Enable MVPN VRI ID Generation. |
|
|
Enable L3VNI w/o VLAN |
Check the box to set the default value of the VRF. The setting at this fabric-level field is the default value of Enable L3VNI w/o VLAN at the VRF level. For more information, see:
|
|
Site Id |
eBGP fabrics are now supported as child fabrics in a VXLAN EVPN Multi-Site fabric. For more information, see Border Gateway Support. Enter a value in this field for the ASN for the BGP fabric in the VXLAN EVPN Multi-Site fabric. Valid entries for this field range from 1-281474976710655. If left empty, the value for this field defaults to the fabric ASN. |
|
Anycast Border Gateway advertise-pip |
Check the check box to advertise the Anycast Border Gateway PIP as a Virtual Tunnel End Point (VTEP) when adding a BGP fabric as a child fabric in a VXLAN EVPN Multi-Site fabric. This setting takes affect when you click Recalculate Config as part of the VXLAN EVPN Multi-Site fabric configuration process. For more information, see Border Gateway Support. |
|
Underlay VTEP Loopback IP Range |
Specifies the loopback IP address range for VTEPs. This is typically the Loopback1 IP address range. |
|
Underlay RP Loopback IP Range |
Specifies anycast or phantom RP IP address range. |
|
Underlay VTEP Loopback IPv6 Range |
Specifies the loopback IPv6 address range for VTEPs. This is typically the Loopback1 and Anycast Loopback IPv6 address range. |
|
Layer 2 VXLAN VNI Range |
Specify the VXLAN VNI IDs for the fabric. |
|
Layer 3 VXLAN VNI Range |
|
|
Network VLAN Range |
VLAN ranges for the Layer 3 VRF and overlay network. |
|
VRF VLAN Range |
|
|
VRF Lite Deployment |
Specifies the VRF Lite method for extending inter fabric connections. Only Manual is supported. |
vPC
| Field | Description |
|---|---|
|
vPC Peer Link VLAN |
VLAN used for the vPC peer link SVI. |
|
Make vPC Peer Link VLAN as Native VLAN |
Enables vPC peer link VLAN as Native VLAN. |
|
vPC Peer Keep Alive option |
From the drop-down list, select management or loopback. To use IP addresses assigned to the management port and the management VRF, select management. To use IP addresses assigned to loopback interfaces (in non-management VRF), select loopback. If you use IPv6 addresses, you must use loopback IDs. |
|
vPC Auto Recovery Time |
Specifies the vPC auto recovery time-out period in seconds. |
|
vPC Delay Restore Time |
Specifies the vPC delay restore period in seconds. |
|
vPC Peer Link Port Channel Number |
Specifies the Port Channel ID for a vPC Peer Link. By default, the value in this field is 500. |
|
vPC IPv6 ND Synchronize |
Enables IPv6 Neighbor Discovery synchronization between vPC switches. The check box is enabled by default. Uncheck the check box to disable the function. |
|
Fabric wide vPC Domain Id |
Enables the usage of same vPC Domain Id on all vPC pairs in the fabric. When you select this field, the vPC Domain Id field is editable. |
|
vPC Domain Id |
Specifies the vPC domain ID to be used on all vPC pairs. Otherwise unique vPC domain IDs are used (in increment of 1) for each vPC pair. |
|
Enable Qos for Fabric vPC-Peering |
Enables QoS on spines for guaranteed delivery of vPC Fabric Peering communication.
QoS for vPC fabric peering and queuing policies options in fabric settings are mutually exclusive. |
|
Qos Policy Name |
Specifies QoS policy name that should be same on all spines. |
Protocols
| Field | Description |
|---|---|
|
Routing Loopback Id |
The loopback interface ID is populated as 0 by default. It is used as the BGP router ID. |
|
VTEP Loopback Id |
The loopback interface ID is populated as 1 and it is used for VTEP peering purposes. |
|
BGP Maximum Paths |
Specifies maximum number for BGP routes to be installed for same prefix on the switches for ECMP. |
|
Enable BGP Authentication |
Check the check box to enable BGP authentication. If you enable this field, the BGP Authentication Key Encryption Type and BGP Authentication Key fields are enabled. |
|
BGP Authentication Key Encryption Type |
Choose the three for 3DES encryption type, or seven for Cisco encryption type. |
|
BGP Authentication Key |
Enter the encrypted key based on the encryption type.
Plain-text passwords are not supported. Log on to the switch, retrieve the encrypted key. Enter the key in the BGP Authentication Key field. For more information, see Retrieve the encrypted BFD authentication key. |
|
Enable PIM Hello Authentication |
Enables the PIM hello authentication. |
|
PIM Hello Authentication Key |
Specifies the PIM hello authentication key. |
|
Enable BFD |
Check the Enable BFD check box to enable feature bfd on all switches in the fabric. This feature is valid only on IPv4 underlay and the scope is within a fabric. Nexus Dashboard supports BFD within a fabric. The BFD feature is disabled by default in the Fabric Settings. If enabled, BFD is enabled for the underlay protocols with the default settings. Any custom BFD configurations requires configurations to be deployed via the per switch freeform or per interface freeform policies. The following configuration is pushed after you enable BFD. 'feature bfd' For Nexus Dashboard with BFD-enabled, the following configurations are pushed on all the P2P fabric interfaces: no ip redirects no ipv6 redirects For information about BFD feature compatibility, refer your respective platform documentation and for information about the supported software versions, see Cisco Nexus Dashboard Fabric Controller Compatibility Matrix. |
|
Enable BFD for BGP |
Check the check box to enable BFD for the BGP neighbor. This option is disabled by default. |
|
Enable BFD Authentication |
Check the check box to enable BFD authentication. If you enable this field, the BFD Authentication Key ID and BFD Authentication Key fields are enabled. |
|
BFD Authentication Key ID |
Specifies the BFD authentication key ID for the interface authentication. |
|
BFD Authentication Key |
Specifies the BFD authentication key. For information about how to retrieve the BFD authentication parameters, see Retrieve the encrypted BFD authentication key. |
Security
| Field | Description |
|---|---|
|
Enable MACsec |
Check the check box to enable MACsec in the fabric. MACsec configuration is not generated until MACsec is enabled on an intra-fabric link. Perform a Recalculate and deploy operation to generate the MACsec configuration and deploy the configuration on the switch. |
|
MACsec Cipher Suite |
Choose one of the following MACsec cipher suites for the MACsec policy:
The default value is GCM-AES-XPN-256. |
|
MACsec Primary Key String |
Specify a Cisco Type 7 encrypted octet string that is used for establishing the primary MACsec session. For AES_256_CMAC, the key string length must be 130 and for AES_128_CMAC, the key string length must be 66. If these values are not specified correctly, an error is displayed when you save the fabric.
The default key lifetime is infinite. |
|
MACsec Primary Cryptographic Algorithm |
Choose the cryptographic algorithm used for the primary key string. It can be AES_128_CMAC or AES_256_CMAC. The default value is AES_128_CMAC. You can configure a fallback key on the device to initiate a backup session if the primary session fails. |
|
MACsec Fallback Key String |
Specify a Cisco Type 7 encrypted octet string that is used for establishing a fallback MACsec session. For AES_256_CMAC, the key string length must be 130 and for AES_128_CMAC, the key string length must be 66. If these values are not specified correctly, an error is displayed when you save the fabric. |
|
MACsec Fallback Cryptographic Algorithm |
Choose the cryptographic algorithm used for the fallback key string. It can be AES_128_CMAC or AES_256_CMAC. The default value is AES_128_CMAC. |
|
MACsec Status Report Timer |
Specify the MACsec operational status periodic report timer in minutes. |
Advanced
| Field | Description |
|---|---|
|
Intra Fabric Interface MTU |
Specifies the MTU for the intra fabric interface. This value must be an even number. |
|
Layer 2 Host Interface MTU |
Specifies the MTU for the Layer 2 host interface. This value must be an even number. |
|
Power Supply Mode |
Choose the appropriate power supply mode. |
|
CoPP Profile |
From the drop-down list, select the appropriate Control Plane Policing (CoPP) profile policy for the fabric. By default, the strict is selected. |
|
VTEP HoldDown Time |
Specifies the NVE source interface hold down time. |
|
VRF Lite Subnet IP Range |
These fields are prefilled with the DCI subnet details. Update the fields as needed. The values shown on the page are automatically generated. If you want to update the IP address ranges, VXLAN Layer 2/Layer 3 network ID ranges or the VRF/network VLAN ranges, ensure that each fabric has its own unique range and is distinct from any underlay range to avoid possible duplication. You should only update one range of values at a time. If you want to update more than one range of values, do it in separate instances. For example, if you want to update Layer 2 and Layer 3 ranges, you should do the following.
|
|
VRF Lite Subnet Mask |
|
|
Enable CDP for Bootstrapped Switch |
Check the check box to enable CDP for switches discovered using Bootstrap. |
|
Enable NX-API |
Check the check box to enable NX-API on HTTPS. This check box is checked by default. |
|
Enable NX-API on HTTP |
Specifies enabling of NX-API on HTTP. Check Enable NX-API on HTTP and Enable NX-API check boxes to use HTTP. This check box is checked by default. If you uncheck this check box, the applications that use NX-API and supported by Nexus Dashboard, such as Endpoint Locator (EPL), Layer 4-Layer 7 services (L4-L7 services), VXLAN OAM, and so on, start using the HTTPS instead of HTTP.
If you check both Enable NX-API and Enable NX-API on HTTP check boxes, applications use HTTP. |
|
Enable Strict Config Compliance |
Enable the Strict Configuration Compliance feature by selecting this check box. For more information, see the section "Strict configuration compliance" in Configuration Compliance. |
|
Enable AAA IP Authorization |
Enables AAA IP authorization (make sure IP Authorization is enabled in the AAA Server). |
|
Enable Nexus Dashboard as Trap Host |
Check the check box to enable Nexus Dashboard as a trap host. |
|
Enable TCAM Allocation |
TCAM commands are automatically generated for VXLAN and vPC Fabric Peering when enabled. |
|
Greenfield Cleanup Option |
Enable the switch cleanup option for greenfield switches without performing a switch reload. This option is typically recommended only for the Data centers with the Cisco Nexus 9000v Switches. |
|
Enable Default Queuing Policies |
Check the check box to apply QoS policies on all the switches in this fabric. To remove the QoS policies that you applied on all the switches, uncheck this check box, update all the configurations to remove the references to the policies, and deploy the configuration. Pre-defined QoS configurations are included that can be used for various Cisco Nexus 9000 Series Switches. When you check this check box, the appropriate QoS configurations are pushed to the switches in the fabric. The system queuing is updated when configurations are deployed to the switches. You can perform the interface marking with defined queuing policies, if required, by adding the necessary configuration to the peer interface freeform block. Review the actual queuing policies by opening the policy file in the template editor. From the Nexus Dashboard Web UI, choose Operations > Template. Search for the queuing policies by the policy file name, for example, queuing_policy_default_8q_cloudscale. Choose the file and click the Modify/View template icon to edit the policy. See the Cisco Nexus 9000 Series NX-OS Quality of Service Configuration Guide for platform specific details. |
|
N9K Cloud Scale Platform Queuing Policy |
Choose the queuing policy from the drop-down list to be applied to all Cisco Nexus 9200 Series Switches and the Cisco Nexus 9000 Series Switches that ends with EX, FX, and FX2 in the fabric. The valid values are queuing_policy_default_4q_cloudscale and queuing_policy_default_8q_cloudscale. Use the queuing_policy_default_4q_cloudscale policy for FEXs. You can change from the queuing_policy_default_4q_cloudscale policy to the queuing_policy_default_8q_cloudscale policy only when FEXs are offline. |
|
N9K R-Series Platform Queuing Policy |
Select the queuing policy from the drop-down list to be applied to all Cisco Nexus switches that ends with R in the fabric. The valid value is queuing_policy_default_r_series. |
|
Other N9K Platform Queuing Policy |
Choose the queuing policy from the drop-down list to be applied to all other switches in the fabric other than the switches mentioned in the above two options. The valid value is queuing_policy_default_other. |
|
Priority flow control watch-dog interval |
When enabling the AI feature,
The |
|
Enable Real Time Interface Statistics Collection |
Valid for NX-OS fabrics only. Check the box to enable the collection of real time interface statistics. |
|
Interface Statistics Load Interval |
Enter the interval for the interface statistics load, in seconds (min: 5, max: 300). |
Freeform
The fields in this tab are shown below. For more information, see "Enabling Freeform Configurations on Fabric Switches" in Configuring Switches for LAN and IPFM Fabrics.
| Field | Description |
|---|---|
|
Leaf Pre-Interfaces Freeform Config |
Enter additional CLIs, added before interface configurations, for all Leafs and Tier2 Leafs as captured from Show Running Configuration. |
|
Spine Pre-Interfaces Freeform Config |
Enter additional CLIs, added before interface configurations, for all Spines as captured from Show Running Configuration. |
|
Leaf Post-Interfaces Freeform Config |
Enter additional CLIs, added after interface configurations, for all Leafs and Tier2 Leafs as captured from Show Running Configuration. |
|
Spine Post-Interfaces Freeform Config |
Enter additional CLIs, added after interface configurations, for all Spines as captured from Show Running Configuration. |
|
Intra-fabric Links Additional Config |
Add CLIs that should be added to the intra-fabric links. |
Manageability
| Field | Description |
|---|---|
|
DNS Server IPs |
Specifies the comma-separated list of IP addresses (v4/v6) of the DNS servers. |
|
DNS Server VRFs |
Specifies one VRF for all DNS servers or a comma separated list of VRFs, one per DNS server. |
|
NTP Server IPs |
Specifies the comma-separated list of IP addresses (v4/v6) of the NTP server. |
|
NTP Server VRFs |
Specifies one VRF for all NTP servers or a comma-separated list of VRFs, one per NTP server. |
|
Syslog Server IPs |
Specifies the comma-separated list of IP addresses (v4/v6) IP address of the syslog servers, if used. |
|
Syslog Server Severity |
Specifies the comma-separated list of syslog severity values, one per syslog server. The minimum value is 0 and the maximum value is 7. To specify a higher severity, enter a higher number. |
|
Syslog Server VRFs |
Specifies one VRF for all syslog servers or a comma-separated list of VRFs, one per syslog server. |
|
AAA Freeform Config |
Specifies the AAA freeform configs. If AAA configs are specified in the fabric settings, switch_freeform PTI with source as UNDERLAY_AAA and description as AAA Configurations will be created. NOTE: If you enter a clear text password while editing the AAA freeform configuration, it is converted to an encrypted password, and displayed as an encrypted password when you perform a show run command on the switch. For example, if you changed the password in the configuration as: The show run command output displays the encrypted password as follows: |
Bootstrap
| Field | Description |
|---|---|
|
Enable Bootstrap |
Check the Enable Bootstrap check box to enable the bootstrap feature. After you enable bootstrap, you can enable the DHCP server for automatic IP address assignment using one of the following methods:
|
|
Enable Local DHCP Server |
Check the Enable Local DHCP Server check box to enable DHCP service on Nexus Dashboard and initiate automatic IP address assignment. When you check this check box, the DHCP Scope Start Address and DHCP Scope End Address fields become editable. If you do not check this check box, Nexus Dashboard uses the remote or external DHCP server for automatic IP address assignment. |
|
DHCP Version |
Select DHCPv4 or DHCPv6 from this drop-down list. When you select DHCPv4, the Switch Mgmt IPv6 Subnet Prefix field is disabled. If you select DHCPv6, the Switch Mgmt IP Subnet Prefix is disabled.
Nexus Dashboard IPv6 POAP is not supported with Cisco Nexus 7000 Series Switches. Cisco Nexus 9000 and 3000 Series Switches support IPv6 POAP only when switches are either Layer2 adjacent (eth1 or out-of-band subnet must be a /64) or Layer3 adjacent residing in some IPv6 /64 subnet. Subnet prefixes other than /64 are not supported. |
|
DHCP Scope Start Address |
Specifies the first and last IP addresses of the IP address range. IPs from this scope are allocated to the switches during the POAP bootstrap process. |
|
DHCP Scope End Address |
|
|
Switch Mgmt Default Gateway |
Specifies the default gateway for the DHCP scope. |
|
Switch Mgmt IP Subnet Prefix |
Specifies the prefix length for DHCP scope. |
|
DHCP scope and management default gateway IP address specification |
If you specify the management default gateway IP address 10.0.1.1 and subnet mask 24, ensure that the DHCP scope is within the specified subnet, between 10.0.1.2 and 10.0.1.254. |
|
Switch Mgmt IPv6 Subnet Prefix |
Specifies the IPv6 prefix for the Mgmt0 interface on the switch. The prefix should be between 112 and 126. This field is editable if you enable IPv6 for DHCP. |
|
Enable AAA Config |
Check the check box to include AAA configs from the Manageability tab during device bootup. |
|
Bootstrap Freeform Config |
Enter additional commands as needed. For example, if you are using AAA or remote authentication related configurations, you need to add these configurations in this field to save the intent. After the devices boot up, they contain the intent defined in the Bootstrap Freeform Config field. Copy-paste the running-configuration to a freeform config field with correct indentation, as seen in the running configuration on the NX-OS switches. The freeform config must match the running config. For more information, see the section "Resolve freeform config errors in switches" in Working with Inventory in Your Nexus Dashboard LAN or IPFM Fabrics. |
|
DHCPv4/DHCPv6 Multi Subnet Scope |
Specifies the field to enter one subnet scope per line. This field is editable after you check the Enable Local DHCP Server check box. The format of the scope should be defined as: DHCP Scope Start Address, DHCP Scope End Address, Switch Management Default Gateway, Switch Management Subnet Prefix For example: 10.6.0.2, 10.6.0.9, 10.6.0.1, 24 |
Configuration Backup
| Field | Description |
|---|---|
|
Hourly Fabric Backup |
Check the Hourly Fabric Backup check box to enable an hourly backup of fabric configurations and the intent. You can enable an hourly backup for fresh fabric configurations and the intent. If there is a configuration push in the previous hour, Nexus Dashboard takes a backup. Intent refers to configurations that are saved in Nexus Dashboard but yet to be provisioned on the switches. |
|
Scheduled Fabric Backup |
Check the check box to enable a daily backup. This backup tracks changes in running configurations on the fabric devices that are not tracked by configuration compliance. |
|
Scheduled Time |
Specifies the scheduled backup time in a 24-hour format. This field is enabled if you check the Scheduled Fabric Backup check box.
|
Flow Monitor
| Field | Description |
|---|---|
|
Enable Netflow |
Check the Enable Netflow check box to enable Netflow on VTEPs for this Fabric. By default, Netflow is disabled.
When Netflow is enabled on the fabric, you can choose not to have netflow on a particular switch by having a fake no_netflow PTI. If netflow is not enabled at the fabric level, an error message is generated when you enable netflow at the interface, network, or VRF level. For information about Netflow support for Nexus Dashboard, see the "Configuring Netflow support" section in Creating LAN and ACI Fabrics and Fabric Groups. |
|
Netflow Exporter |
To add Netflow exporters for receiving netflow data:
|
|
Netflow Record |
To add Netflow records:
|
|
Netflow Monitor |
To add Netflow monitors:
The record name and exporters referred to in each netflow monitor must be defined in the Netflow Record and Netflow Exporter configuration sections in the Flow Monitor tab. . Click Save to configure the flow monitor. |
Telemetry
The telemetry feature in Nexus Dashboard allows you to collect, manage, and monitor real-time telemetry data from your Nexus Dashboard. This data provides valuable insights into the performance and health of your network infrastructure, enabling you to troubleshoot proactively and optimize operations. When you enable telemetry, you gain enhanced visibility into network operations and efficiently manage your fabrics.
Follow these steps to enable telemetry for a specific fabric.
-
Navigate to the Fabrics page.
Go to Manage > Fabrics.
-
Choose the fabric for which you want to enable telemetry.
-
From the Actions drop-down list, choose Edit fabric settings.
The Edit fabric-name settings page displays.
You can also access the Edit fabric-name settings page for a fabric from the Fabric Overview page. In the Fabric Overview page, click the Actions drop-down list and choose Edit fabric settings.
-
In the Edit fabric-name settings page, click the General tab.
-
Under the Enabled features section, check the Telemetry check box.
-
Click Save.
Navigate back to the Edit fabric-name settings page. The Telemetry tab displays.
NOTE: The Telemetry tab appears only when you enable the Telemetry option under the General tab in the Edit fabric-name settings page.
The Telemetry tab includes these options.
-
Configuration — allows you to manage telemetry settings and parameters.
-
NAS — provides Network Analytics Service (NAS) features for advanced insights.
Edit configuration settings
The Configuration tab includes these settings.
-
General — allows you to enable analysis.
You can enable these settings.
-
Enable assurance analysis — enables you to collect of telemetry data from devices to ensure network reliability and performance.
-
Enable Microburst sensitivity - allows you to monitor traffic to detect unexpected data bursts within a very small time window (microseconds). Choose the sensitivity type from the Microburst Sensitivity Level drop-down list. The options are High sensitivity, Medium sensitivity, and Low sensitivity.
The Enable Microburst sensitivity option is available only for ACI fabrics.
-
-
Flow collection modes — allows you to choose the mode for telemetry data collection. Modes include NetFlow, sFlow, and Flow Telemetry.
For more information see: Flow collection and Configure flows.
-
Flow collection rules — allows you to define rules for monitoring specific subnets or endpoints. These rules are pushed to the relevant devices, enabling detailed telemetry data collection.
For more information, see Flow collection.
Edit NAS settings
Nexus Dashboard allows you to export captured flow records to a remote NAS device using the Network File System (NFS) protocol. Nexus Dashboard defines the directory structure on NAS where the flow records are exported.
You can choose between the two export modes.
-
Full — exports the complete data for each flow record.
-
Base — exports only the essential 5-tuple data for each flow record.
Nexus Dashboard needs both read and write permissions on the NAS to perform the export successfully. If Nexus Dashboard cannot write to the NAS, it will generate an alert to notify you of the issue.
Disable Telemetry
You can uncheck the Telemetry check box on your fabric’s Edit Fabric Settings > General > page to disable the telemetry feature for your fabric. Disabling telemetry puts the telemetry feature in a transition phase and eventually the telemetry feature is disabled.
In certain situations, the disable telemetry workflow can fail, and you may see the Force disable telemetry option on your fabric’s Edit Fabric Settings page.
If you disable the telemetry option using the instructions provided in Perform force disable telemetry on your fabric on your fabric, Nexus Dashboard acknowledges the user intent to disable telemetry feature for your fabric, ignoring any failures.
The Nexus Dashboard Force disable telemetry allows you to perform a force disable action for the telemetry configuration on your fabric. This action is recommended when the telemetry disable workflow has failed and you need to disable the telemetry feature on your fabric.
Using the Force disable telemetry feature may leave switches in your fabric with stale telemetry configurations. You must manually clean up these stale configurations on the switches before re-enabling telemetry on your fabric.
Perform force disable telemetry on your fabric
Follow these steps to perform a force disable telemetry on your fabric.
-
(Optional) Before triggering a force disable of telemetry configuration, resolve any telemetry configuration anomalies flagged on the fabric.
-
On the Edit Fabric Settings page of your fabric, a banner appears to alert you that telemetry cannot be disabled gracefully, and a Force Disable option is provided with the alert message.
-
Disable telemetry from the Nexus Dashboard UI using one of these options.
-
Click the Force disable option in the banner that appears at the top of your fabric’s Edit Fabric Settings page to disable telemetry for your fabric gracefully.
-
Navigate to your fabric’s Overview page and click the Actions drop-down list to choose Telemetry > Force disable telemetry option.
Once the force disable action is executed, the Telemetry configuration appears as disabled in Edit Fabric Settings > General > Enabled features > Telemetry area, that is, the Telemetry check box is unchecked.
-
-
Clean up any stale telemetry configurations from the fabric before re-enabling telemetry on Nexus Dashboard.
NAS
You can export flow records captured by Nexus Dashboard on a remote Network Attached Storage (NAS) with NFS.
Nexus Dashboard defines the directory structure on NAS where the flow records are exported.
You can export the flow records in Base or Full mode. In Base mode, only 5-tuple data for the flow record is exported. In Full mode the entire data for the flow record is exported.
Nexus Dashboard requires read and write permission to NAS in order to export the flow record. A system issue is raised if Nexus Dashboard fails to write to NAS.
Guidelines and limitations for network attached storage
-
In order for Nexus Dashboard to export the flow records to an external storage, the Network Attached Storage added to Nexus Dashboard must be exclusive for Nexus Dashboard.
-
Network Attached Storage with Network File System (NFS) version 3 must be added to Nexus Dashboard.
-
Flow Telemetry and Netflow records can be exported.
-
Export of FTE is not supported.
-
Average Network Attached Storage requirements for 2 years of data storage at 20k flows per sec:
-
Base Mode: 500 TB data
-
Full Mode: 2.8 PB data
-
-
If there is not enough disk space, new records will not be exported and an anomaly is generated.
Add network attached storage to export flow records
The workflow to add Network Attached Storage (NAS) to export flow records includes the following steps:
-
Add NAS to Nexus Dashboard.
-
Add the onboarded NAS to Nexus Dashboard to enable export of flow records.
Add NAS to Nexus Dashboard
Follow these steps to add NAS to Nexus Dashboard.
-
Navigate to Admin > System Settings > General.
-
In the Remote storage area, click Edit.
-
Click Add Remote Storage Locations.
-
Complete the following fields to add NAS to Nexus Dashboard.
-
Enter the name of the Network Attached Storage and a description, if desired.
-
In the Remote storage location type field, click NAS Storage.
-
In the Type field, choose Read Write.
Nexus Dashboard requires read and write permission to export the flow record to NAS. A system issue is raised if Nexus Dashboard fails to write to NAS.
-
In the Hostname field, enter the IP address of the Network Attached Storage.
-
In the Port field, enter the port number of the Network Attached Storage.
-
In the Export path field, enter the export path.
Using the export path, Nexus Dashboard creates the directory structure in NAS for exporting the flow records.
-
In the Alert threshold field, enter the alert threshold time.
Alert threshold is used to send an alert when the NAS is used beyond a certain limit.
-
In the Limit (Mi/Gi) field, enter the storage limit in Mi/Gi.
-
Click Save.
-
Add the onboarded NAS to Nexus Dashboard
Follow these steps to add the onboarded NAS to Nexus Dashboard.
-
Navigate to the Fabrics page:
Manage > Fabrics
-
Choose the fabric with the telemetry feature enabled.
-
Choose Actions > Edit Fabric Settings.
-
Click Telemetry.
-
Click the NAS tab in the Telemetry page.
-
Make the necessary configurations in the General settings area.
-
Enter the name in the Name field.
-
In the NAS server field, choose the NAS server added to Nexus Dashboard from the drop-down list.
-
-
In the Collection settings area, choose the flow from the Flows drop-down list.
-
In Base mode, only 5-tuple data for the flow record is exported.
-
In Full mode, the entire data for the flow record is exported.
-
-
Click Save.
The traffic from the flows displayed in the Flows page is exported as a JSON file to the external NAS in the following directory hierarchy.
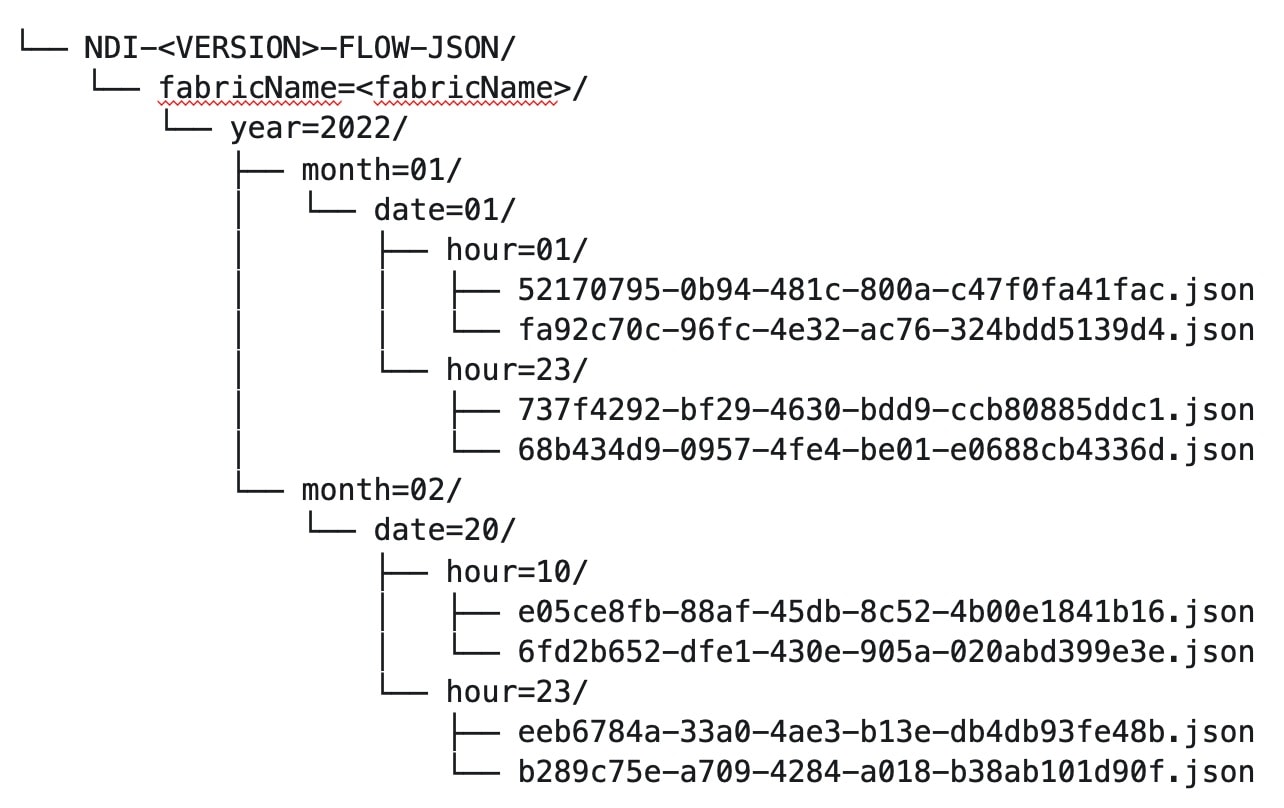
Navigate to Analyze > Flows to view the flows that will be exported.
Each flow record is written as a line delimited JSON.
JSON output file format for a flow record in base mode
{"fabricName":"myapic","terminalTs":1688537547433,"originTs":1688537530376,"srcIp":"2000:201:1:1::1","dstIp":"2000:201:1:1::3","srcPort":1231,"dstPort":1232,"ingressVrf":"vrf1","egressVrf":"vrf1","ingressTenant":"FSV1","egressTenant":"FSV1","protocol":"UDP"}

{"fabricName":"myapic","terminalTs":1688537547378,"originTs":1688537530377,"srcIp":"201.1.1.127","dstIp":"201.1.1.1","srcPort":0,"dstPort":0,"ingressVrf":"vrf1","egressVrf":"","ingressTenant":"FSV2","egressTenant":"","protocol":"ANY-HOST"}
JSON output file format for a flow record in full mode
{"fabricName":"myapic","terminalTs":1688538023562,"originTs":1688538010527,"srcIp":"201.1.1.121","dstIp":"201.1.1.127","srcPort":0,"dstPort":0,"ingressVrf":"vrf1","egressVrf":"vrf1","ingressTenant":"FSV2","egressTenant":"FSV2","protocol":"ANY-HOST","srcEpg":"ext-epg","dstEpg":"ext-epg1","latencyMax":0,"ingressVif":"eth1/15","ingressVni":0,"latency":0,"ingressNodes":"Leaf1-2","ingressVlan":0,"ingressByteCount":104681600,"ingressPktCount":817825,"ingressBurst":0,"ingressBurstMax":34768,"egressNodes":"Leaf1-2","egressVif":"po4", "egressVni":0,"egressVlan":0,"egressByteCount":104681600,"egressPktCount":817825,"egressBurst":0,"egressBurstMax":34768,"dropPktCount":0,"dropByteCount":0,"dropCode":"","dropScore":0,"moveScore":0,"latencyScore":0,"burstScore":0,"anomalyScore":0,"hashCollision":false,"dropNodes":"[]","nodeNames":"[\"Leaf1-2\"]","nodeIngressVifs":"[\"Leaf1-2,eth1/15\"]","nodeEgressVifs":"[\"Leaf1-2,po4\"]“ ,"srcMoveCount":0,"dstMoveCount":0,"moveCount":0,"prexmit":0,"rtoOutside":false,"events":"[[\\\"1688538010527,Leaf1-2,0,3,1,no,no,eth1/15,,po4,po4,,,,,0,64,0,,,,,,,,\\\"]]"}
Flow collection
Understanding flow telemetry
Flow telemetry allows users to see the path taken by different flows in detail. It also allows you to identify the EPG and VRF instance of the source and destination. You can see the switches in the flow with the help of flow table exports from the nodes. The flow path is generated by stitching together all the exports in order of the flow.
You can configure the Flow Telemetry rule for the following interface types:
-
VRF instances
-
Physical interfaces
-
Port channel interfaces
-
Routed sub-interfaces (Cisco ACI fabric)
-
SVIs (Cisco ACI fabric)
In a Cisco ACI fabric, if you want to configure routed sub-interfaces from the UI, select L3 Out.
In an NX-OS fabric, physical or port channel flow rules are supported only on routed interfaces.
Flow telemetry monitors the flow for each fabric separately, as there is no stitching across the fabrics in a fabric group. Therefore, flow telemetry is for individual flows. For example, if there are two fabrics (fabric A and fabric B) within a fabric group, and traffic is flowing between the two fabrics, they will be displayed as two separate flows. One flow will originate from Fabric A and display where the flow exits. And the other flow from Fabric B will display where it enters and where it exits.
Flow telemetry guidelines and limitations
-
All flows are monitored as a consolidated view in a unified pipeline for Cisco ACI and NX-OS fabrics, and the flows are aggregated under the same umbrella.
-
Even if a particular node (for example, a third-party switch) is not supported for Flow Telemetry, Nexus Dashboard will use LLDP information from the previous and next nodes in the path to identify the switch name and the ingress and egress interfaces.
-
Nexus Dashboard supports Kafka export for Flow anomalies. However, Kafka export is not currently supported for Flow Event anomalies.
Flow telemetry guidelines and limitations for NX-OS fabrics
-
Ensure that you have configured NTP and enabled PTP in Nexus Dashboard. See Cisco Nexus Dashboard Deployment Guide and Precision Time Protocol (PTP) for Cisco Nexus Dashboard Insights for more information. You are responsible for configuring the switches with external NTP servers.
-
In the Edit Flow page, you can enable all three telemetry types. sFlow is most restrictive, Netflow has some more capability, and Flow Telemetry has the most capability. We recommend that you enable Flow Telemetry if it is available for your configuration. If Flow Telemetry is not available, then use Netflow. If Netflow is not available, use sFlow.
-
If there are multiple Nexus Dashboard clusters onboarded to Nexus Dashboard, partial paths will be generated for each fabric.
-
If you manually configure the fabric to use with Nexus Dashboard and Flow Telemetry support, the Flows Exporter port changes from 30000 to 5640. To prevent a breakage of the Flows Exporter, adjust the automation.
-
Nexus Dashboard supports Kafka export for Flow anomalies. However, Kafka export is not currently supported for Flow Event anomalies.
-
Flow telemetry is supported in -FX3 platform switches for the following NX-OS versions:
-
9.3(7) and later
-
10.1(2) and later
-
Flow telemetry is not supported in -FX3 platform switches for NX-OS version 10.1(1).
-
-
Interface based Flow Telemetry is only supported on modular chassis with -FX land -GX line cards on physical ports and port-channels rules.
-
If interface-based Flow Telemetry is pushed from Nexus Dashboard for Classic LAN and External Connectivity Network fabrics, perform the following steps:
-
Choose the fabric.
-
Choose Policies > Action > Add policy > Select all > Choose template > host_port_resync and click Save.
-
In the Fabric Overview page, choose Actions > Recalculate and deploy.
-
-
For VXLAN fabrics, interface-based Flow Telemetry is not supported on switch links between spine switch and leaf switch.
-
If you want to use the default VRF instance for flow telemetry, you must create the VRF instance with a name of "default" in lowercase. Do not enter the name with any capital letters.
-
Flow telemetry is not supported in classic LAN topologies with 2-level VPC access layers.
-
If you want to enable Flow Telemetry, ensure that there are no pre-existing Netflow configurations on the switches. If there are any pre-existing configurations, the switch configuration may fail.
To enable Flow Telemetry without configuration issues, follow these steps:
-
Ensure that there are no pre-existing Netflow configurations on the switches. If such configurations exist, enabling Flow Telemetry might result in a system anomaly with an error message stating
invalid command match IP source address. -
If you encounter the error, disable Flow Telemetry.
-
Remove any existing Netflow configurations from the switches.
-
Re-enable Flow Telemetry.
-
For some flows, latency information is not available, which could happen due to latency issues. In these cases, latency information will be reported as 0.
-
Flow telemetry rules guidelines and limitations for NX-OS fabrics
-
If you configure an interface rule (physical or port channel) on a subnet, it can monitor only incoming traffic. It cannot monitor outgoing traffic on the configured interface rule.
-
If a configured port channel that contains two physical ports, only the port channel rule is applicable. Even if you configure physical interface rules on the port, only port channel rule takes precedence.
-
For NX-OS release 10.3(2) and earlier, if a flow rule are configured on an interface, then global flow rules are not matched.
-
For NX-OS release 10.3(3) and later, a flow rule configured on an interface is matched first and then the global flow rules are matched.
Configure flows
Configure flow collection modes
Follow these steps to configure flow collection modes.
-
Navigate to Admin > System Settings > Flow collection.
-
In the Flow collection mode area, choose Flow telemetry.
Enabling Flow Telemetry automatically activates Flow Telemetry Events. Whenever a compatible event takes place, an anomaly will be generated, and the What’s the impact? section in the Anomaly page will display the associated flows. You can manually configure a Flow Telemetry rule to acquire comprehensive end-to-end information about the troublesome flow.
Configure flow collection rules in an NX-OS fabric
Follow these steps to configure flow collection rules in an NX-OS fabric.
-
Navigate to the Telemetry window for your fabric.
-
Navigate to the main Fabrics page:
Manage > Fabrics
-
In the table showing all of the Nexus Dashboard fabrics that you have already created, locate the LAN or IPFM fabric where you want to configure telemetry settings.
-
Single-click on that fabric.
The Overview page for that fabric appears.
-
Click Actions > Edit Fabric Settings.
The Edit fabric_name Settings window appears.
-
Verify that the Telemetry option is enabled in the Enabled features area.
The Telemetry tab doesn’t become available unless the Telemetry option is enabled in the Enabled features area.
-
Click the Telemetry tab to access the telemetry settings for this fabric.
-
-
Click the Flow collection tab in the Telemetry window.
-
In the Mode area, click Flow telemetry.
-
In the Flow collections rules area, determine what sort of flow collection rule that you want to add.
VRF
To add a VRF rule:
-
Click the VRF tab.
A table with already-configured VRF flow collection rules is displayed.
For any VRF flow collection rule in this table, click the ellipsis (…), then click Edit rule to edit that rule or Delete rule to delete it.
-
Add a new rule by clicking Create flow collection rule.
-
In the General area, complete the following:
-
Enter the name of the rule in the Rule Name field.
-
The VRF field is disabled. The flow rule applies to all the VRF instances.
-
In the Flow Properties area, select the protocol for which you intend to monitor the flow traffic.
-
Enter the source and destination IP addresses. Enter the source and destination port.
-
Click Save.
-
-
Physical interface
To add a physical interface rule:
-
Click the Physical interface tab.
A table with already-configured physical interface flow collection rules is displayed.
For any physical interface flow collection rule in this table, click the ellipsis (…), then click Edit rule to edit that rule or Delete rule to delete it.
-
Add a new rule by clicking Create flow collection rule.
-
In the General area, complete the following:
-
Enter the name of the rule in the Rule Name field.
-
Check the Enabled check box to enable the status. If you enable the status, the rule will take effect. Otherwise, the rule will be removed from the switches.
-
In the Flow Properties area, select the protocol for which you intend to monitor the flow traffic.
-
Enter the source and destination IP addresses. Enter the source and destination port.
-
In the Interface List area, click Select a Node. Use the search box to select a node.
-
From the drop-down list, select an interface. You can add more than one row (node+interface combination) by clicking Add Interfaces. However, within the rule, a node can appear only once. Configuration is rejected if more than one node is added.
-
Click Save.
-
-
Port channel
To add a port channel rule:
-
Click the Port channel tab.
A table with already-configured port channel flow collection rules is displayed.
For any port channel flow collection rule in this table, click the ellipsis (…), then click Edit rule to edit that rule or Delete rule to delete it.
-
Add a new rule by clicking Create flow collection rule.
-
In the General area, enter the name of the rule in the Rule Name field.
-
Select the Enabled check box to enable the status. If you enable the status, the rule will take effect. Otherwise, the rule will be removed from the switches.
-
In the Flow Properties area, select the protocol for which you intend to monitor the flow traffic.
-
Enter the source and destination IP addresses. Enter the source and destination port.
-
From the drop-down list, select an interface. You can add more than one row (node+interface combination) by clicking Add Interfaces. However, within the rule, a node can appear only once. Configuration is rejected if more than one node is added.
-
Click Save.
-
-
-
Click Done.
Monitor the subnet for flow telemetry
In the following example, the configured rule for a flow monitors the specific subnet provided. The rule is pushed to the fabric which pushes it to the switches. So, when the switch sees traffic coming from a source IP or the destination IP, and if it matches the subnet, the information is captured in the TCAM and exported to the Nexus Dashboard service. If there are 4 nodes (A, B, C, D), and the traffic moves from A > B > C > D, the rules are enabled on all 4 nodes and the information is captured by all the 4 nodes. Nexus Dashboard stitches the flows together. Data such as the number of drops and the number of packets, anomalies in the flow, and the flow path are aggregated for the 4 nodes.
Follow these steps to monitor the subnet for flow telemetry.
-
Navigate to Manage > Fabric.
-
Choose a fabric.
-
Verify that your Fabrics and the Snapshot values are appropriate. The default snapshot value is 15 minutes. Your choice will monitor all the flows in the chosen fabric or snapshot fabric.
-
Navigate to Connectivity > Flows to view a summary of all the flows that are being captured based on the snapshot that you chose.
The related anomaly score, record time, the nodes sending the flow telemetry, flow type, ingress and egress nodes, and additional details are displayed in a table format. If you click a specific flow in the table, specific details are displayed in the sidebar for the particular flow telemetry. In the sidebar, if you click the Details icon, the details are displayed in a larger page. In this page, in addition to other details, the Path Summary is also displayed with specifics related to source and destination. If there are flows in the reverse direction, that will also be visible in this location.
For a bi-directional flow, there is an option to choose to reverse the flow and see the path summary displayed. If there are any packet drops that generate a flow event, they can be viewed in the Anomaly dashboard.
Understanding Netflow
Netflow is an industry standard where Cisco routers monitor and collect network traffic on an interface. Netflow version 9 is supported.
Netflow enables the network administrator to determine information such as source, destination, class of service, and causes of congestion. Netflow is configured on the interface to monitor every packet on the interface and provide telemetry data. You cannot filter on Netflow.
Netflow in Nexus series switches is based on intercepting the packet processing pipeline to capture summary information of network traffic.
The components of a flow monitoring setup are as follows:
-
Exporter: Aggregates packets into flows and exports flow records towards one or more collectors
-
Collector: Reception, storage, and pre-processing of flow data received from a flow exporter
-
Analysis: Used for traffic profiling or network intrusion
-
The following interfaces are supported for Netflow:
| Interfaces | 5 Tuple | Nodes | Ingress | Egress | Path | Comments |
|---|---|---|---|---|---|---|
|
Routed Interface/Port Channel |
Yes |
Yes |
Yes |
No |
Yes |
Ingress node is shown in path |
|
Sub Interface/Logical (Switch Virtual Interface) |
Yes |
Yes |
No |
No |
No |
No |
In an NX-OS fabric, port channel support is available if you monitor only the host-facing interfaces.
Understanding Netflow types
You can use these Netflow types:
Full Netflow
With Full Netflow, all packets on the configured interfaces are captured into flow records in a flow table. Flows are sent to the supervisor module. Records are aggregated over configurable intervals and exported to the collector. Except in the case of aliasing (multiple flows hashing to the same entry in the flow table), all flows can be monitored regardless of their packet rate.
Nexus 9000 Series switches with the Fabric Controller type as well as switches in a Cisco ACI fabric support Full Netflow.
Sampled Netflow
With Sampled Netflow, packets on configured interfaces are time sampled. Flows are sent to the supervisor or a network processor for aggregation. Aggregated flow records are exported at configured intervals. The probability of a record for a flow being captured depends on the sampling frequency and packet rate of the flow relative to other flows on the same interface.
Nexus 7000 and Nexus 7700 Series switches with F/M line cards and the Fabric Controller type, support Sampled Netflow.
Netflow guidelines and limitations
-
In Cisco Nexus 9000 series switches, Netflow supports a small subset of the published export fields in the RFC.
-
Netflow is captured only on the ingress port of a flow as only the ingress switch exports the flow. Netflow cannot be captured on fabric ports.
Netflow guidelines and limitations for Cisco ACI fabrics
-
We recommend that you enable Flow Telemetry. If that is not available for your configuration, use Netflow. However, you can determine which mode of flow to use based upon your fabric configuration.
-
Enabling both Flow Telemetry and Netflow is not supported.
-
After you enable Netflow, you must obtain the Netflow collector IP address and configure Cisco APIC with the collector IP address. See Cisco APIC and NetFlow.
To obtain the Netflow collector IP address, navigate to Admin > System Settings > General, then locate the External Pools area. Click View all at the bottom left area of the External Pools tile; the Telemetry-collector persistent IP addresses listed in the table are used for the Netflow collector IP address.
-
The Netflow and sFlow flow collection modes do not support any anomaly.
Netflow guidelines and limitations for NX-OS fabrics
-
In the Edit Flow page, you can enable all three modes. Choose the best possible mode for a product. sFlow is the most restrictive, Netflow has more capabilities, and Flow Telemetry has the most capabilities. We recommend that you enable Flow Telemetry if it is available for your configuration. If Flow Telemetry is not available, then use Netflow. If Netflow is not available, use sFlow.
-
In Nexus 7000 and Nexus 9000 Series switches, only the ingress host-facing interface configured for Netflow are supported (either in VXLAN or Classic LAN).
-
The Netflow supported fabrics are Classic and VXLAN. VXLAN is not supported on fabric ports.
-
Netflow configurations will not be pushed. However, if a fabric is managed, the software sensors will be pushed.
-
If you manually configure the fabric to use with Nexus Dashboard and Netflow support, the Flows Exporter port changes from 30000 to 5640. To prevent a breakage of the Flows Exporter, adjust the automation.
-
To configure Netflow on fabric switches, see the Configuring Netflow section in the Cisco Nexus 9000 Series NX-OS System Management Configuration Guide.
Configure Netflow
Follow these steps to configure Netflow.
-
Navigate to the Telemetry page for your LAN or IPFM fabric.
-
Click the Flow collection tab on the Telemetry page.
-
In the Mode area, make the following choices:
-
Choose Netflow.
-
Choose Flow Telemetry.
-
-
Click Save.
Understanding sFlow
sFlow is an industry standard technology traffic in data networks containing switches and routers. Nexus Dashboard supports sFlow version 5 on Cisco Nexus 3000 series switches.
sFlow provides the visibility to enable performance optimization, an accounting and billing for usage, and defense against security threats.
The following interfaces are supported for sFlow:
| Interfaces | 5 Tuple | Nodes | Ingress | Egress | Path | Comments |
|---|---|---|---|---|---|---|
|
Routed Interface |
Yes |
Yes |
Yes |
Yes |
Yes |
Ingress node is shown in path |
Guidelines and limitations for sFlow
-
Nexus Dashboard supports sFlow with Cisco Nexus 3000 series switches.
-
It is recommended to enable Flow Telemetry if it is available for your configuration. If it is not available for your configuration, use Netflow. If Netflow, is not available for your configuration, then use sFlow.
-
For sFlow, Nexus Dashboard requires the configuration of persistent IPs under cluster configuration, and 6 IPs in the same subnet as the data network are required.
-
sFlow configurations will not be pushed. However, if a fabric is managed, the software sensors will be pushed.
-
If you manually configure the fabric to use with Nexus Dashboard and sFlow support, the Flows Exporter port changes from 30000 to 5640. To prevent a breakage of the Flows Exporter, adjust the automation.
-
Nexus Dashboard does not support sFlow in the following Cisco Nexus 3000 Series switches:
-
Cisco Nexus 3600-R Platform Switch (N3K-C3636C-R)
-
Cisco Nexus 3600-R Platform Switch (N3K-C36180YC-R)
-
Cisco Nexus 3100 Platform Switch (N3K-C3132C-Z)
-
-
Nexus Dashboard does not support sFlow in the following Cisco Nexus 9000 Series fabric modules:
-
Cisco Nexus 9508-R fabric module (N9K-C9508-FM-R)
-
Cisco Nexus 9504-R fabric module (N9K-C9504-FM-R)
-
-
To configure sFlow on fabric switches, see the Configuring sFlow section in the Cisco Nexus 9000 Series NX-OS System Management Configuration Guide.
Configure sFlow telemetry
Prerequisites
Follow these steps to configure sFlow telemetry.
-
Navigate to the Telemetry page for your LAN or IPFM fabric.
-
Click the Flow collection tab on the Telemetry page.
-
In the Mode area, make the following choices:
-
Choose sFlow.
-
Choose Flow Telemetry.
-
-
Click Save.
External streaming
The External streaming tab in Nexus Dashboard allows you export data that Nexus Dashboard collects over Kafka, email, and syslog. Nexus Dashboard generates data such as advisories, anomalies, audit logs, faults, statistical data, and risk and conformance reports. When you configure a Kafka broker, Nexus Dashboard writes all data to a topic. By default, the Nexus Dashboard collects export data every 30 seconds or at a less frequent interval.
For ACI fabrics, you can also collect data for specific resources (CPU, memory, and interface utilization) every 10 seconds from the leaf and spine switches using a separate data pipeline. To export this data, select the Usage option under Collection Type in the Message bus export settings. Additionally, CPU and memory data is collected for the controllers.
Nexus Dashboard does not store the collected data in Elasticsearch; instead, it exports the data directly to your repository or data lake using a Kafka broker for consumption. By using the Kafka export functionality, you can then export this data to your Kafka broker and push it into your data lake for further use.
You can configure an email scheduler to define the type of data and the frequency at which you want to receive information via email. You can also export anomaly records to an external syslog server. To do this, select the Syslog option under the External Streaming tab.
Configure external streaming settings
Follow these steps to configure external streaming settings.
-
Navigate to the Fabrics page.
Go to Manage > Fabrics.
-
Choose the fabric for which you configure streaming settings.
-
From the Actions drop-down list, choose Edit fabric settings.
The Edit fabric-name settings page displays.
You can also access the Edit fabric-name settings page for a fabric from the Fabric Overview page. In the Fabric Overview page, click the Actions drop-down list and choose Edit fabric settings.
-
In the Edit fabric-name settings page, click the External streaming tab.
You can view these options.
-
Email
-
Message bus
-
Syslog
-
Guidelines and limitations
-
Intersight connectivity is required to receive the reports by email.
-
You can configure up to five emails per day for periodic job configurations.
-
A maximum of six exporters is supported for export across all types of exporters including email, message bus, and syslog. You must provide unique names for each export.
-
The scale for Kafka exports is increased to support up to 20 exporters per cluster. However, statistics selection is limited to any six exporters.
-
Before configuring your Kafka export, you must add the external Kafka IP address as a known route in your Nexus Dashboard cluster configuration and verify that Nexus Dashboard can reach the external Kafka IP address over the network.
-
The anomalies in Kafka and email messages include categories such as Resources, Environmental, Statistics, Endpoints, Flows, and Bugs.
-
Export data is not supported for snapshot fabrics.
-
You must provide unique names for each exporter, and they may not be repeated between Kafka export for Alerts and Events and Kafka export for Usage.
-
Nexus Dashboard supports Kafka export for flow anomalies. However, Kafka export is not currently supported for flow Event anomalies.
Guidelines and limitations in NX-OS fabrics
-
Remove all configurations in the Message Bus Configuration and Email page before you disable Software Telemetry on any fabric and remove the fabric from Nexus Dashboard.
-
If you use interface groups while enabling PTP in an Enhanced Classic LAN fabric, you must add the following commands to the freeform section of the interface group.
-
ttag -
ttag-stripIf you do not add these commands, endpoints connected behind these interfaces will experience traffic loss.
-
The email scheduler feature in Nexus Dashboard automates the distribution of summarized data collected from Nexus Dashboard. It allows customization of selection of email recipients, choice of email format, scheduling frequency settings, and configuring the types of alerts and reports.
To configure email at the system settings level, see the section "Email" in Working with System Settings.
Follow these steps to configure an email scheduler.
-
Navigate to the Fabrics page.
Go to Manage > Fabrics.
-
Choose the fabric for which you configure streaming settings.
-
From the Actions drop-down list, choose Edit fabric settings.
The Edit fabric-name settings page displays.
-
In the Edit fabric-name settings page, click the External streaming tab.
-
Click the Email tab.
-
Review the information provided in the Email tab for already-configured email configurations.
The following details display under Email tab.
| Field | Description |
|---|---|
|
Name |
The name of the email configuration. |
|
|
The email addresses used in the email configuration. |
|
Start time |
The start date used in the email configuration. |
|
Frequency |
The frequency in days or weeks set in the email configuration. |
|
Anomalies |
The severity level for anomalies and advisories set in the email configuration. |
|
Advisories |
|
|
Risk and conformance reports |
The status of the overall inventory for a fabric, including software release, hardware platform, and a combination of software and hardware conformance. |
To add a new email configuration, click Add email in the Email page.
-
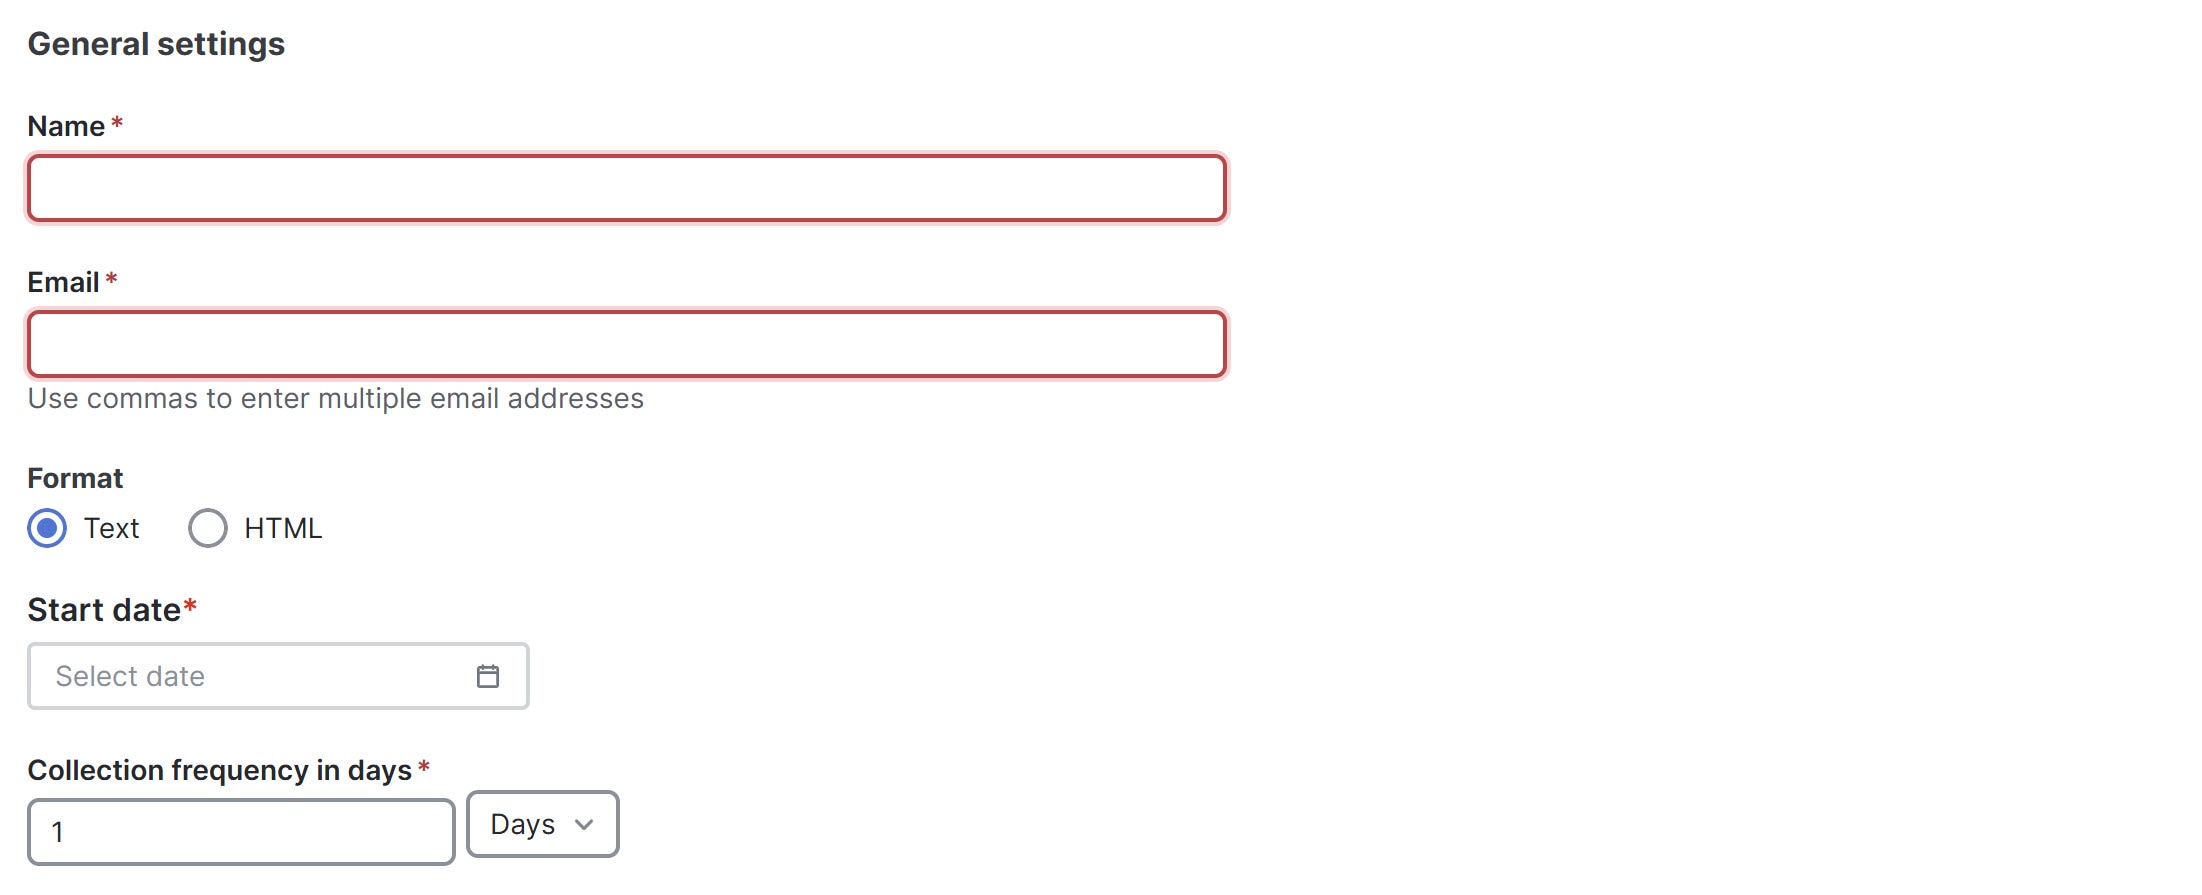
Follow these steps to configure General Settings.
-
In the Name field, enter the name of the email scheduler.
-
In the Email field, enter one or more email addresses separated by commas.
-
In the Format field, choose Text or HTML email format.
-
In the Start date field, choose the start date when the scheduler should begin sending emails.
-
In the Collection frequency in days field, specify how often the summary is sent, you can choose days or weeks.
-
-
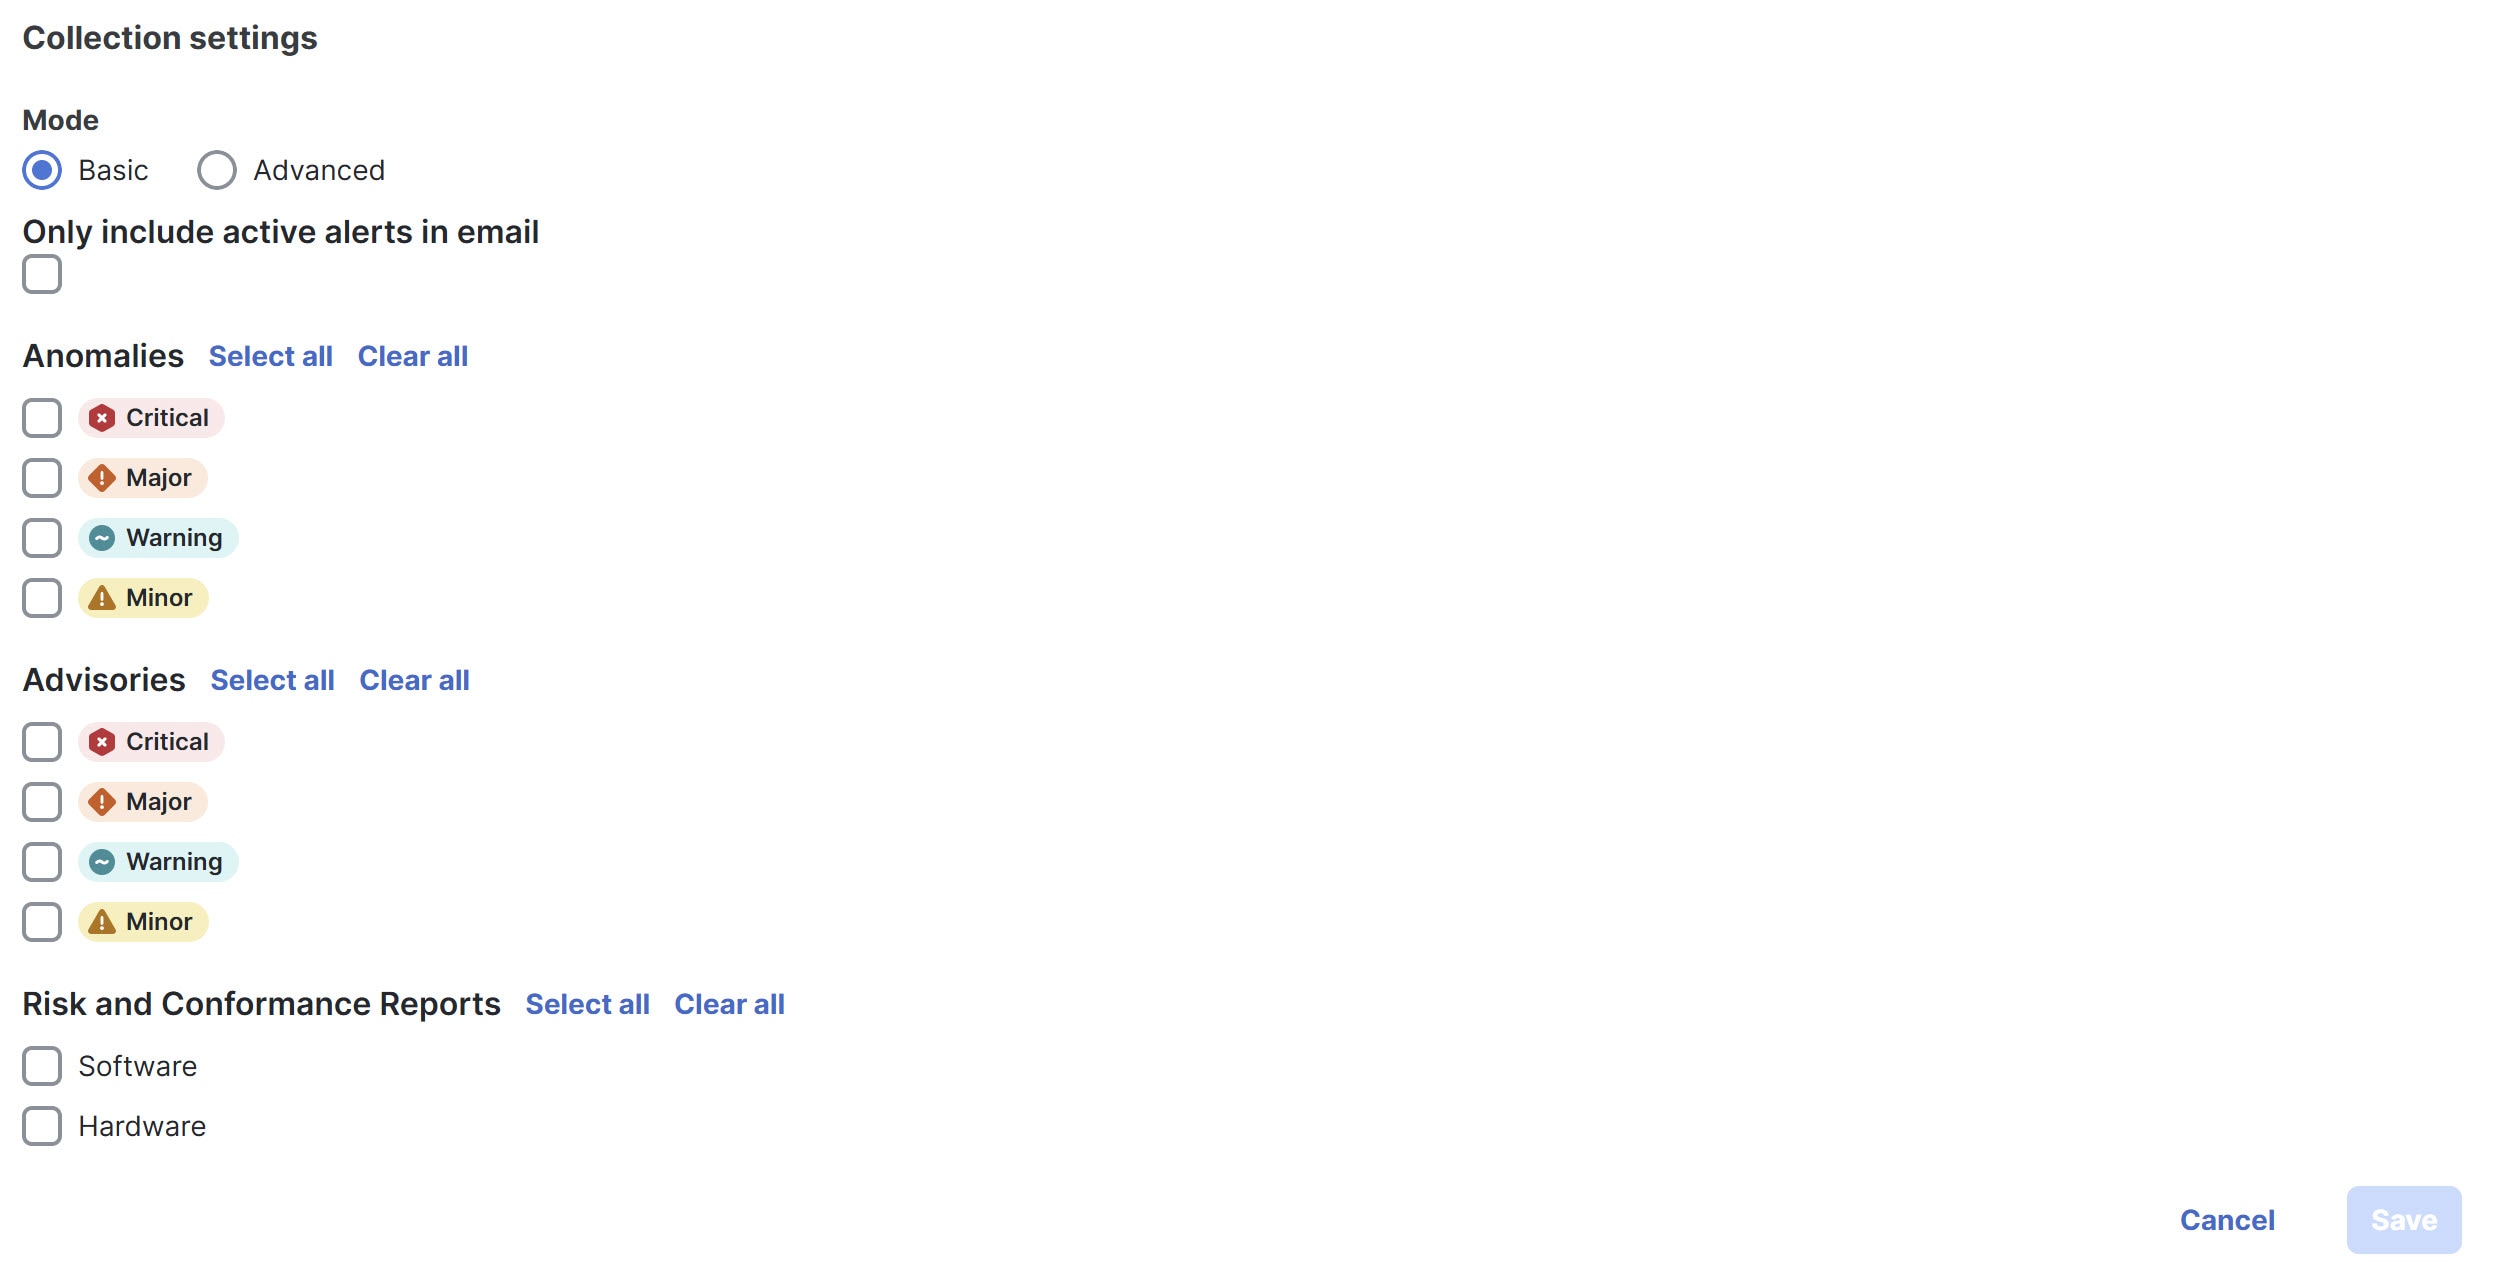
Follow these steps to configure Collection Settings.
-
In the Mode field, choose one of the following modes.
-
Basic — displays the severity levels for anomalies and advisories.
-
Advanced — displays the categories and severity levels for anomalies and advisories.
-
-
Check the Only include active alerts in email check box, to include only active anomaly alerts.
-
Under Anomalies choose the categories and severity levels for the anomalies.
-
Under Advisories choose the categories and severity levels for the advisories.
-
Under Risk and Conformance Reports, choose from the following options.
-
Software
-
Hardware
-
-
-
Click Save.
The Email area displays the configured email schedulers.
You will receive an email about the scheduled job on the provided Start Date and at the time provided in the Collection frequency in days field. The subsequent emails follow after Collect Every frequency expires. If the provided time is in the past, Nexus Dashboard will send you an email immediately and trigger the next email after the duration from the provided start time expires.
Message bus
Add Kafka broker configuration
Follow these steps to configure the message bus and add kafka broker.
-
Configure the message bus at the System Settings level.
-
Navigate to Admin > System Settings > General.
-
In the Message bus configuration area, click Edit.
The Message bus configuration dialog box opens.
-
Click Add message bus configuration.
The Add message bus configuration dialog box opens.
-
In the Name field, enter a name for the configuration.
-
In the Hostname/IP address and Port fields, enter the IP address of the message bus consumer and the port that is listening on the message bus consumer.
-
In the Topic name field, enter the name of the Kafka topic to which Nexus Dashboard must send the messages.
-
In the Mode field, choose the security mode.
The supported modes are Unsecured, Secured SSL and SASLPLAIN. The default value is Unsecured.
-
For Unsecured, no other configurations are needed.
-
For Secured SSL, fill out the following field:
Client certification name — The System Certificate name configured at the Certificate Management level. The CA certificate and System Certificate (which includes Client certificate and Client key) are added at the Certificate Management level.
Refer to Step 2 for step-by-step instructions on managing certificates. Navigate to Admin > Certificate Management to manage the following certificates:
-
CA Certificate — The CA certificate used for signing consumer certificate, which will be stored in the trust-store so that Nexus Dashboard can trust the consumer.
-
Client Certificate — The CA signed certificate for Nexus Dashboard. The certificate is signed by the same CA, and the same CA certificate will be in the truststore of the consumer. This will be stored in Nexus Dashboard’s Kafka keystore that is used for exporting.
-
Client Key — A private key for the Kafka producer, which is Nexus Dashboard in this case. This will be stored in Nexus Dashboard’s Kafka keystore that is used for exporting.
-
-
For SASLPLAIN, fill out these fields:
-
Username — The username for the SASL/PLAIN authentication.
-
Password — The password for the SASL/PLAIN authentication.
-
-
-
Click Save
-
-
Add CA certificates and System certificates at the Certificate Management level.
-
Navigate to Admin > Certificate Management.
-
In the Certificate management page, click the CA Certificates tab, then click Add CA certificate.
The fields in the CA Certificates tab are described in the following table.
Field Description Certificate name
The name of the CA certificate.
Certificate details
The details of the CA certificate.
Attached to
The CA signed certificate attached to Nexus Dashboard.
Expires on
The Expiry date and time of the CA certificate.
Last updated time
The last updated time of the CA certificate.
-
In the Certificate management page, click the System certificates tab, then click Add system certificate to add Client Certificate and Client key. Note that the Client certificate and Client key should have same names except extensions as .cer/.crt/.pem for Client certificate and .key for Client key.
You must add a valid CA Certificate before adding the corresponding System Certificate.
The fields in the System Certificates tab are described in the following table.
Field Description Certificate name
The name of the Client certificate.
Certificate details
The details of the Client certificate.
Attached to
The feature to which the system certificate is attached to, in this case, the message bus.
Expires on
The Expiry date and time of the CA certificate.
Last updated time
The last updated time of the CA certificate.
To configure message bus, the System Certificate should be attached to message bus feature.
-
To attach a System Certificate to the message bus feature:
-
Choose the System Certificate that you want to use and click the ellipses (…) on that row.
-
Choose Manage Feature Attachments from the drop-down list.
The Manage Feature Attachments dialog box opens.
-
In the Features field, choose messageBus.
-
Click Save.
For more information on CA certificates, see Managing Certificates in your Nexus Dashboard.
Configure Kafka exports in fabric settings
-
Navigate to the External streaming page for your fabric.
-
Navigate to the Fabrics page.
Go to Manage > Fabrics.
-
Choose the fabric for which you configure streaming settings.
-
From the Actions drop-down list, choose Edit fabric settings.
The Edit fabric-name settings page displays.
-
In the Edit fabric-name settings page, click the External streaming tab.
-
Click the Message bus tab.
-
-
Review the information provided in the Message bus tab for already-configured message bus configurations, or click Add message bus to add a new message bus configuration.
Skip to Step 3 if you are adding a message bus.
The fields in the Message bus tab are described in the following table.
Field Description Message bus stream
The name of the message bus stream configuration.
Collection type
The collection type used by the message bus stream.
Mode
The mode used by the message bus stream.
Anomalies
The severity level for anomalies and advisories set in the message bus stream configuration.
Advisories
Statistics
The statistics that were configured for the message bus stream.
Faults
The severity level for faults set in the message bus stream configuration.
Audit Logs
The audit logs that were configured for the message bus stream.
-
To configure a new message bus stream, in the Message bus page, click Add message bus.
-
In the Message bus stream field, choose the message bus stream that you want to edit.
-
In the Collection Type area, choose the appropriate collection type.
Depending on the Collection Type that you choose, the options displayed in this area will change.
-
Alerts and events: This is the default setting. Continue to Step 7, if you choose Alerts and events.
-
Usage: In the Collection settings area, under Data, the Resources, and Statistics for the collection settings are displayed. By default, the data for CPU, Memory, and Interface Utilization are collected and exported. You cannot choose to export a subset of these resources.
Usage is applicable only for ACI Fabrics. This option is disabled for other fabrics.
-
-
Click Save. The configured message bus streams are displayed in the Message bus area. This configuration now sends immediate notification when the selected anomalies or advisories occur.
-
If you choose Alerts and events as the Collection Type, in the Mode area, choose either Basic or Advanced.
The configurations that are available in each collection settings section might vary, depending on the mode that you set.
-
Determine which area you want to configure for the message bus stream.
The following areas appear in the page:
After you complete the configurations on this page, click Save. Nexus Dashboard displays the configured message bus streams in the Message bus area. This configuration now sends immediate notification when the selected anomalies or advisories occur.
Anomalies
-
If you chose Basic in the Mode area, choose one or more of the following severity levels for anomaly statistics that you want to configure for the message bus stream:
-
Critical
-
Major
-
Warning
-
Minor
Or click Select all to select all available statistics for the message bus stream.
-
-
If you chose Advanced in the Mode area:
-
Choose one or more of the following categories for anomaly statistics that you want to configure for the message bus stream:
-
Active Bugs
-
Capacity
-
Compliance
-
Configuration
-
Connectivity
-
Hardware
-
Integrations
-
System
-
-
Choose one or more of the following severity levels for anomaly statistics that you want to configure for the message bus stream:
-
Critical
-
Major
-
Warning
-
Minor
Or click Select all to select all available categories and statistics for the message bus stream.
-
For more information on anomaly levels, see Detecting Anomalies and Identifying Advisories in Your Nexus Dashboard.
-
Advisories
-
If you chose Basic in the Mode area, choose one or more of the following severity levels for advisory statistics that you want to configure for the message bus stream:
-
Critical
-
Major
-
Warning
-
Minor
Or click Select all to select all available statistics for the message bus stream.
-
-
If you chose Advanced in the Mode area:
-
Choose one or more of the following categories for advisory statistics that you want to configure for the message bus stream:
-
Best Practices
-
Field Notices
-
HW end-of-life
-
SW end-of-life
-
PSIRT
-
-
Choose one or more of the following severity levels for advisory statistics that you want to configure for the message bus stream:
-
Critical
-
Major
-
Warning
-
Minor
Or click Select all to select all available categories and statistics for the message bus stream.
-
For more information on advisory levels, see Detecting Anomalies and Identifying Advisories in Your Nexus Dashboard.
-
Statistics
There are no differences in the settings in the Statistics area when you choose Basic or Advanced in the Mode area.
Choose one or more of the following categories to configure the statistics you want to stream over the message bus.
-
Interfaces — streams statistics related to network interfaces, such as traffic volume, error rates, and interface status.
-
Protocol — streams protocol-specific statistics, including packet counts, protocol errors, and handshake success rates.
-
Resource Allocation — streams data about system resources, such as CPU usage, memory consumption, and bandwidth allocation.
-
Environmental — streams environmental metrics such as temperature, humidity, and power supply status.
-
Endpoints — streams statistics about connected endpoints, including connection status, data throughput, and session durations.
Faults
There are no differences in the settings in the Faults area when you choose Basic or Advanced in the Mode area.
Choose one or more of the following severity levels for fault statistics that you want to configure for the message bus stream:
-
Critical
-
Major
-
Minor
-
Warning
-
Info
Audit Logs
There are no differences in the settings in the Audit Logs area when you choose Basic or Advanced in the Mode area.
Choose one or more of the following categories for audit logs that you want to configure for the message bus stream:
-
Creation
-
Deletion
-
Modification
Syslog
Nexus Dashboard supports the export of anomalies in syslog format. You can use the syslog configuration feature to develop network monitoring and analytics applications on top of Nexus Dashboard, integrate with the syslog server to get alerts, and build customized dashboards and visualizations.
After you choose the fabric where you want to configure the syslog exporter and set up the syslog export configuration, Nexus Dashboard establishes a connection with the syslog server and sends data to the syslog server.
Nexus Dashboard exports anomaly records to the syslog server. With syslog support, you can export anomalies to your third-party tools even if you do not use Kafka.
Guidelines and limitations for syslog
If the syslog server is not operational at a certain time, messages generated during that downtime will not be received by a server after the server becomes operational.
Add syslog server configuration
Follow these steps to add syslog server configuration.
-
Navigate to Admin > System Settings > General.
-
In the Remote streaming servers area, click Edit.
The Remote streaming servers page displays.
-
Click Add server.
The Add server page displays.
-
Choose the Service as Syslog.
-
Choose the Protocol.
You have these options.
-
TCP
-
UDP
-
-
In the Name field, provide the name for the syslog server.
-
In the Hostname/IP address field, provide the hostname or IP address of the syslog server.
-
In the Port field, specify the port number used by the syslog server.
-
If you want to enable secure communication, check the TLS check box.
Before you enable TLS you must upload the CA certificate for the syslog destination host to Nexus Dashboard. For more information see, Upload a CA certificate.
Configure syslog to enable exporting anomalies data to a syslog server
Follow these steps to configure syslog to enable exporting anomalies data to a syslog server.
-
Navigate to the Fabrics page.
Go to Manage > Fabrics.
-
Choose the fabric for which you configure streaming settings.
-
From the Actions drop-down list, choose Edit fabric settings.
The Edit fabric-name settings page displays.
-
In the Edit fabric-name settings page, click the External streaming tab.
-
Click the Syslog tab.
The following details display under Syslog tab.
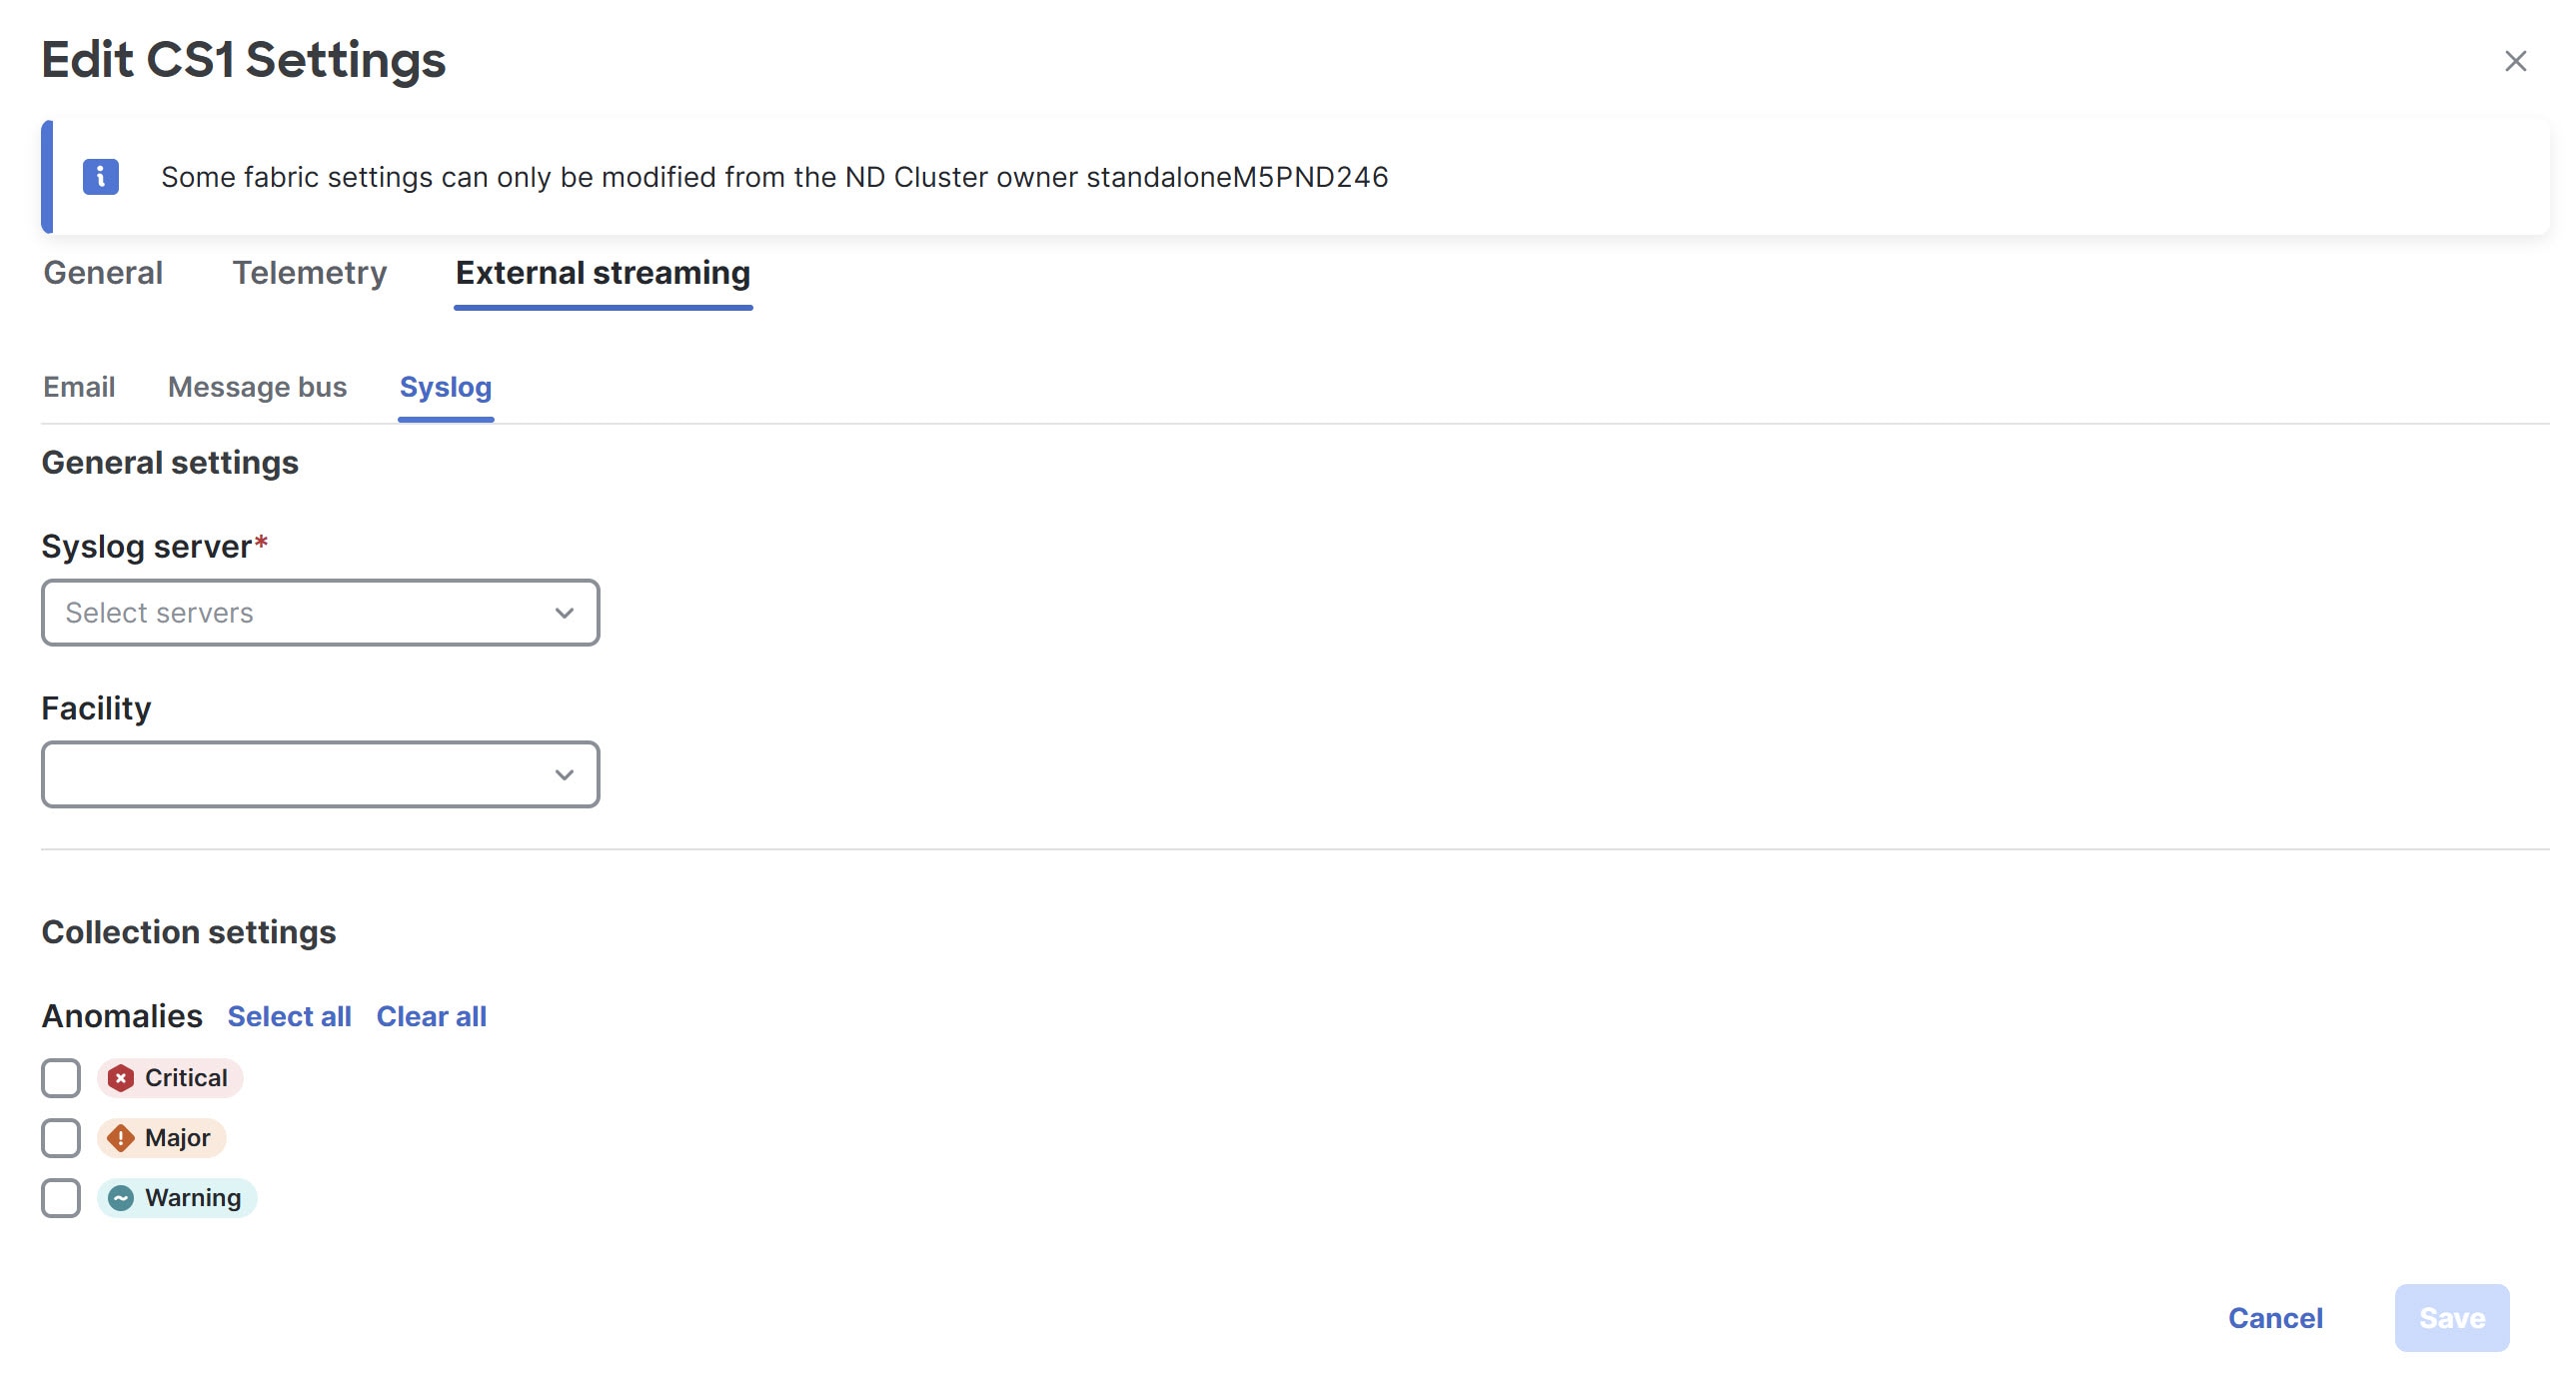
-
Make the necessary configurations in the General settings area.
-
In the Syslog server drop down list, choose a syslog server.
The Syslog server drop down list displays the syslog servers that you added in the System Settings level. For more information, see Add syslog server configuration.
-
In the Facility field, from the drop-down list, choose the appropriate facility string.
A facility code is used to specify the type of system that is logging the message. For this feature, the local0-local7 keywords for locally used facility are supported.
-
-
In the Collection settings area, choose the desired severity options.
The options available are Critical, Major, and Warning.
-
Click Save.
Upload a CA certificate
Follow these steps to upload a CA certificate for syslog server TLS.
-
Navigate to Admin > Certificate Management.
-
In the Certificate management page, click the CA certificates tab, then click Add CA certificate.
You can upload multiple files at a single instance.
-
Browse your local directory and choose the certificate-key pair to upload.
You can upload certificates with the
.pem/.cer/.crt/file extensions. -
Click Save to upload the selected files to Nexus Dashboard.
A successful upload message appears. The uploaded certificates are listed in the table.
Additional settings
The following sections provide information for additional settings that might be necessary when editing the settings for a AI Data Center Routed fabric.
Retrieving the authentication key
Retrieve the 3DES encrypted OSPF authentication key
-
SSH into the switch.
-
On an unused switch interface, enable the following:
config terminal
    feature ospf
    interface Ethernet1/1
       no switchport
       ip ospf message-digest-key 127 md5 ospfAuth
In the example, ospfAuth is the unencrypted password.
This Step 2 is needed when you want to configure a new key.
-
Enter the show run interface Ethernet1/1 command to retrieve the password.
Switch # show run interface Ethernet1/1
   interface Ethernet1/1
     no switchport
     ip ospf message-digest key 127 md5 3 sd8478f4fsw4f4w34sd8478fsdfw
     no shutdown
The sequence of characters after md5 3 is the encrypted password.
-
Update the encrypted password into the OSPF Authentication Key field.
Retrieve the encrypted IS-IS authentication key
To get the key, you must have access to the switch.
-
SSH into the switch.
-
Create a temporary keychain.
config terminal
   key chain isis
   key 127
   key-string isisAuth
In the example, isisAuth is the plaintext password. This will get converted to a Cisco type 7 password after the CLI is accepted.
-
Enter the show run | section "key chain" command to retrieve the password.
key chain isis
   key 127
       key-string 7 071b245f5a
The sequence of characters after key-string 7 is the encrypted password. Save it.
-
Update the encrypted password into the ISIS Authentication Key field.
-
Remove any unwanted configuration made in Step 2.
Retrieve the 3DES encrypted BGP authentication key
-
SSH into the switch and enable BGP configuration for a non-existent neighbor.
Non-existent neighbor configuration is a temporary BGP neighbor configuration for retrieving the password.
router bgp
   neighbor 10.2.0.2 remote-as 65000
   password bgpAuth
In the example, bgpAuth is the unencrypted password.
-
Enter the show run bgp command to retrieve the password. A sample output:
neighbor 10.2.0.2
   remote-as 65000
   password 3 sd8478fswerdfw3434fsw4f4w34sdsd8478fswerdfw3434fsw4f4w3
The sequence of characters after password 3 is the encrypted password.
-
Update the encrypted password into the BGP Authentication Key field.
-
Remove the BGP neighbor configuration.
Retrieve the encrypted BFD authentication key
-
SSH into the switch.
-
On an unused switch interface, enable the following:
switch# config terminal
switch(config)# int e1/1
switch(config-if)# bfd authentication keyed-SHA1 key-id 100 key passwd
In the example, passwd is the unencrypted password and the key ID is 100.
This Step 2 is needed when you want to configure a new key.
-
Enter the show running-config interface command to retrieve the key.
switch# show running-config interface Ethernet1/1

interface Ethernet1/1
description connected-to- switch-Ethernet1/1
no switchport
mtu 9216
bfd authentication Keyed-SHA1 key-id 100 hex-key 636973636F313233
no ip redirects
ip address 10.4.0.6/30
no ipv6 redirects
ip ospf network point-to-point
ip router ospf 100 area 0.0.0.0
no shutdown
The BFD key ID is 100 and the encrypted key is 636973636F313233.
-
Update the key ID and key in the BFD Authentication Key ID and BFD Authentication Key fields.
Guidelines for VXLAN Fabric With eBGP Underlay
-
Brownfield migration is not supported for eBGP fabrics.
-
You cannot change the leaf switch Autonomous System (AS) number after it is created and the configuration is deployed. You must delete the leaf_bgp_asn policy and perform Recalculate & Deploy to remove BGP configuration related to this AS. Then, add the leaf_bgp_asn policy with the new AS number.
-
To switch between Multi-AS and Same-Tier-AS modes, remove all manually added BGP policies (including leaf_bgp_asn on the leaf switch and the EBGP overlay policies), and perform the Recalculate & Deploy operation before the mode change.
-
You cannot change or delete the leaf switch leaf_bgp_asn policy if there are ebgp overlay policies present on the device. You need to delete the eBGP overlay policy first, and then delete the leaf_bgp_asn policy.
-
Intra-fabric links only support IPv6 link local addresses when the underlay is IPv6.
-
On a border device, VRF-Lite is supported with manual mode.
-
VXLAN eBGP fabrics are supported as child fabrics in VXLAN Multi-Site fabrics.
-
TRM (Tenant Routed Multicast) is supported with an eBGP fabric with an IPv4 or an IPv6 underlay.
-
VXLAN with an IPv6 underlay does not support the following features:
-
Bidirectional Forwarding Detection (BFD)
-
MACSec
-
Flexible Netflow
-
BGP authentication
-
Adding Switches
Switches can be added to a single fabric at any point in time. To add switches to a fabric and discover existing or new switches, refer to the section "Add switches to a fabric" in Working with Inventory in Your Nexus Dashboard LAN or IPFM Fabrics.
Assigning Switch Roles
To assign roles to switches on Nexus Dashboard Fabric Controller refer to the "Assign switch roles" in Working with Inventory in Your Nexus Dashboard LAN or IPFM Fabrics.
AI QoS classification and queuing policies
These sections provide information about the AI QoS classification and queuing policies.
Understanding AI QoS classification and queuing policies
Support is available for configuring a low latency, high throughput, and lossless fabric configuration that can be used for artificial intelligence (AI) and machine learning (ML) traffic.
The AI QoS feature allows you to:
-
Easily configure a network with homogeneous interface speeds, where most or all of the links run at 400Gb, 100Gb, or 25Gb speeds.
-
Provide customizations to override the predominate queuing policy for a host interface.
When you apply the AI QoS policy, Nexus Dashboard will automatically pre-configure any inter-fabric links with QoS and system queuing policies, and will also enable Priority Flow Control (PFC). If you enable the AI QoS feature on a VXLAN EVPN fabric, then the Network Virtual (NVE) interface will have the attached AI QoS policies.
Use the following areas to enable this feature:
-
When configuring a BGP fabric, new fields are available to enable the feature and to set the queuing policy parameters based on the interface speed.
-
You can also use the following AI-specific switch templates to create custom device policies, which can be used on host interfaces:
-
AI_Fabric_QOS_Classification_Custom: An interface template that is available for applying a custom queuing policy to an interface.
-
AI_Fabric_QOS_Queuing_Custom: A switch template that is available for user-defined queuing policy configurations.
Policies defined with these custom Classification and Queuing templates can be used in various host interface polices. For more information, see Create a policy using the custom QoS templates.
-
When enabling the AI feature, priority-flow-control watchdog-interval on is enabled on all of your configured devices, intra-fabric links, and all your host interfaces where Priority Flow Control (PFC) is also enabled. The PFC watchdog interval is for detecting whether packets in a no-drop queue are being drained within a specified time period. This release also adds the Priority flow control watch-dog interval field on the Advanced tab. When you create or edit a Data Center VXLAN EVPN fabric or other fabrics and AI is enabled, you can set the Priority flow control watch-dog interval field to a non-system default value (the default is 100 milliseconds). For more information on the PFC watchdog interval for Cisco NX-OS, see Configuring a priority flow control watchdog Interval in the Cisco Nexus 9000 Series NX-OS Quality of Service Configuration Guide.
If you perform an upgrade from an earlier release, and then do a Recalculate and deploy, you may see additional priority-flow-control watchdog-interval on configurations.
Guidelines and limitations for AI QoS classification and queuing policies
Following are the guidelines and limitations for the AI QoS and queuing policy feature:
-
On Cisco Nexus N9K-C9808 and N9K-C9804 series switches, the command priority-flow-control watch-dog-interval is not supported in either global or interface configuration modes and the command hardware qos nodrop-queue-thresholds queue-green is not supported in global configuration mode.
-
Cisco Nexus N9K-C9808 and N9K-C9804 series switches only support AI fabric type from NX-OS version 10.5(1) and later.
-
This feature does not automate any per-interface speed settings.
-
This feature is supported only on Nexus devices with Cisco Cloud Scale technology, such as the Cisco Nexus 9300-FX2, 9300-FX3, 9300-GX, and 9300-GX2 series switches.
-
This feature is not supported in fabrics with devices that are assigned with a ToR role.
Configure AI QoS classification and queuing policies
Follow these steps to configure AI QoS and queuing policies:
-
Enable AI QoS and queuing policies at the fabric level.
-
Create a fabric as you normally would.
-
In the Advanced tab in those instructions, make the necessary selections to configure AI QoS and queuing policies at the fabric level.
-
Configure any remaining fabric-level settings as necessary in the remaining tabs.
-
When you have completed all the necessary fabric-level configurations, click Save, then click Recalculate and deploy.
At this point in the process, the network QoS and queuing policies are configured on each device, the classification policy is configured on NVE interfaces (if applicable), and priority flow control and classification policy is configured on all intra-fabric link interfaces.
-
-
For host interfaces, selectively enable priority flow control, QoS, and queuing by editing the policy associated with that host interface.
See Working with Connectivity for LAN Fabrics for more information.
-
Within a fabric where you enabled AI QoS and queuing policies in the previous step, click the Interfaces tab.
The configured interfaces within this fabric are displayed.
-
Locate the host interface where you want to enable AI QoS and queuing policies, then click the box next to that host interface to select it and click Actions > Edit.
The Edit Interfaces page is displayed.
-
In the Policy field, verify that the policy that is associated with this interface contains the necessary fields that will allow you to enable AI QoS and queuing policies on this host interface.
For example, these policy templates contain the necessary AI QoS and queuing policies fields:
-
int_access_host
-
int_dot1q_tunnel_host
-
int_pvlan_host
-
int_routed_host
-
int_trunk_host
-
-
Locate the Enable priority flow control field and click the box next to this field to enable Priority Flow Control for this host interface.
-
In the Enable QoS Configuration field, click the box next to this field to enable AI QoS for this host interface.
This enables the QoS classification on this interface if AI queuing is enabled at the fabric level.
-
If you checked the box next to the Enable QoS Configuration field in the previous step and you created a custom QoS policy using the procedures provided in Create a policy using the custom QoS templates, enter that custom QoS classification policy in the Custom QoS Policy for this interface field to associate that custom QoS policy with this host interface, if necessary.
If this field is left blank, then Nexus Dashboard will use the default QOS_CLASSIFICATION policy, if available.
-
If you created a custom queuing policy using the procedures provided in Create a policy using the custom QoS templates, enter that custom queuing policy in the Custom Queuing Policy for this interface field to associate that custom queuing policy with this host interface, if desired.
-
Click Save when you have completed the AI QoS and queuing policy configurations for this host interface.
-
Create a policy using the custom QoS templates
Follow these procedures to use the custom QoS templates to create a policy, if desired. See Managing Your Template Library for general information on templates.
-
Within a fabric where you enabled AI QoS and queuing policies, click Inventory > Switches, then double-click the switch that has the host interface where you enabled AI QoS and queuing policies.
The Switch Overview page for that switch appears.
-
Choose Configuration Policies > Policies.
-
Click Actions > Add policy.
The Create Policy page appears.
-
Set the priority and enter a description for the new policy.
Note that the priority for this policy must be lower (must come before) the priority that was set for the host interface.
-
In the Select Template field, click the No Policy Selected text.
The Select Policy Template page appears.
-
Select the appropriate custom Classification or Queuing template from the list, then click Select.
The following templates are specific to the AI QoS and queuing policies feature. Use these templates to create policies that can be used on one or more host interfaces:
-
AI_Fabric_QOS_Classification_Custom: An interface template that is available for applying a custom queuing policy to an interface.
-
AI_Fabric_QOS_Queuing_Custom: A switch template that is available for user-defined queuing policy configurations.
-
-
Make the necessary QoS classification or queuing configurations in the template that you selected, then click Save.
Any custom QoS policy created using these procedures are now available to use when you configure QoS and queuing policies for the host interface.
Border Gateway Support
The following border gateway roles are now supported in an eBGP fabric:
-
Border gateway
-
Border gateway spine
-
Border gateway super spine
Support is also available for eBGP fabrics as child fabrics within a VXLAN fabric group. Several new fields are available when creating a BGP fabric that allow you to enter an ASN and to advertise the Anycast Border Gateway PIP as a Virtual Tunnel End Point (VTEP) for the BGP fabric in the VXLAN fabric group. For more information, see EVPN.
The way that the BGP ASN is allocated for the border gateway will match the settings for the leaf switches and border switches. You also might have to make additional configurations, based on the device role that you assign to the switch:
-
If you set the device role as border gateway, then you must manually add the leaf_bgp_asn policy to the device to specify the BGP ASN that will be used on the switch, following the same Multi-AS mode or Same-Tier-AS mode rule that you have set at the fabric level.
-
If you set the device role as border gateway spine, then the device ASN is the same value as the value provided in the BGP ASN for Spines option at the fabric level.
-
If you set the device role as border gateway super spine, then the device ASN is the same value as the value provided in the BGP ASN for Super Spines option at the fabric level.
Nexus Dashboard Fabric Controller will automatically generate the BGP underlay configuration after you click Recalculate & Deploy at the end of the configuration process. You will then need to manually add the eBGP overlay policies for the border gateways using the procedures provided in the section "Deploying Fabric Overlay eBGP Policies" in
Border Gateway Route Filtering
Two prefix-list policies are created for each border gateway when you perform a Recalculate & Deploy at the VXLAN EVPN Multi-Site fabric level:
-
fabric-internal: This policy is applied to an eBGP session toward fabric internal, and is used to avoid routes that are learned from DCI from being propagated to other nodes within the fabric.
For this policy, permit only the following:
-
Routing loopback (typically loopback0) subnet
-
VTEP loopback (typically loopback1) subnet
-
Anycast RP loopback (typically loopback254) subnet
-
Multisite loopback IP address
-
Following is a sample configuration for this policy:
ip prefix-list ebgp-fabric-to-internal seq 10 permit 8.2.0.0/22 eq 32
ip prefix-list ebgp-fabric-to-internal seq 20 permit 8.3.0.0/22 eq 32
ip prefix-list ebgp-fabric-to-internal seq 30 permit 8.254.254.0/24 eq 32
ip prefix-list ebgp-fabric-to-internal seq 40 permit 10.10.0.2/32
route-map ebgp-rmap-filter-to-internal permit 10
 match ip address prefix-list ebgp-fabric-to-internal
route-map ebgp-rmap-filter-to-internal deny 20
router bgp 65028
 neighbor 8.4.0.1
   address-family ipv4 unicast
     route-map ebgp-rmap-filter-to-internal out
-
fabric-to-dci: This policy is applied to the VXLAN EVPN Multi-Site underlay eBGP session, and is used to avoid VXLAN fabric underlay routes from being propagated to external fabrics.
For this policy, permit only the BGW and the local loopback interface IP address of its neighbor BGW (loopback0/1/VPC VIP/multisite loopback).
Following is a sample configuration for this policy:
ip prefix-list ebgp-fabric-to-dci seq 10 permit 8.2.0.2/32
ip prefix-list ebgp-fabric-to-dci seq 20 permit 8.3.0.1/32
ip prefix-list ebgp-fabric-to-dci seq 30 permit 10.10.0.2/32
route-map ebgp-rmap-filter-to-dci permit 10
 match ip address prefix-list ebgp-fabric-to-dci
route-map ebgp-rmap-filter-to-dci deny 20
router bgp 65028
 neighbor 10.10.1.2
   address-family ipv4 unicast
     route-map ebgp-rmap-filter-to-dci out
     next-hop-self
You can edit either of these two prefix-list policies using the template ipv4_prefix_list_internal to add the custom prefix-list entries. For more information on adding or editing a policy, see the section "Add a policy" in Working with Configuration Policies for Your Nexus Dashboard LAN or IPFM Fabrics.
Guidelines and Limitations
Following are the guidelines and limitations with the border gateway support in BGP fabrics:
-
Border gateway support for an eBGP fabric is only available when EVPN is enabled, and when the underlay is IPv4.
-
Tenant Routed Multicast (TRM) is also supported with border gateway roles in a BGP fabric.
Layer 3 VNI without VLAN
Following is the upper-level process to enable the Layer 3 VNI without VLAN feature in a fabric:
-
(Optional) When configuring a new fabric, check the Enable L3VNI w/o VLAN field to enable the Layer 3 VNI without VLAN feature at the fabric level. The setting at this fabric-level field affects the related field at the VRF level, as described below.
-
When creating or editing a VRF, check the Enable L3VNI w/o VLAN field to enable the Layer 3 VNI without VLAN feature at the VRF level. The default setting for this field varies depending on the following factors:
-
For existing VRFs, the default setting is disabled (the Enable L3VNI w/o VLAN box is unchecked).
-
For newly-created VRFs, the default setting is inherited from the fabric settings, as described above.
-
This field is a per-VXLAN fabric variable. For VRFs that are created from a VXLAN EVPN Multi-Site fabric, the value of this field is inherited from the fabric setting in the child fabric. You can edit the VRF in the child fabric to change the value, if desired.
See the "Create a VRF" section in Working with Segmentation and Security for Your Nexus Dashboard VXLAN Fabric for more information.
-
The VRF attachment (new or edited) then uses the new Layer 3 VNI without VLAN mode if the following conditions are met:
-
The Enable L3VNI w/o VLAN is enabled at the VRF level
-
The switch supports this feature and the switch is running on the correct release (see Guidelines and limitations for Layer 3 VNI without VLAN)
The VLAN is ignored in the VRF attachment when these conditions are met.
Guidelines and limitations for Layer 3 VNI without VLAN
Following are the guidelines and limitations for the Layer 3 without VLAN feature:
-
The Layer 3 VNI without VLAN feature is supported on the -EX, -FX, and -GX versions of the Nexus 9000 switches. When you enable this feature at the VRF level, the feature setting on the VRF will be ignored on switch models that do not support this feature.
-
When used in a Campus VXLAN EVPN fabric, this feature is only supported on Cisco Nexus 9000 series switches in that type of fabric. This feature is not supported on Cisco Catalyst 9000 series switches in the Campus VXLAN EVPN fabric; those switches require VLANs for Layer 3 VNI configurations.
-
This feature is supported on switches running on NX-OS release 10.3.1 or later. If you enable this feature at the VRF level, the feature setting on the VRF is ignored on switches running an NX-OS image earlier than 10.3.1.
-
When you perform a brownfield import in a Data Center VXLAN EVPN fabric, if one switch configuration is set with the Enable L3VNI w/o VLAN configuration at the VRF level, then you should also configure this same setting for the rest of the switches in the same fabric that are associated with this VRF, if the switch models and images support this feature.
-
For VXLAN fabric or fabric group deployments with Campus switches, use a VNI range within 4096 to 1,677,721 to align with the best practices for VNI allocation in Campus environments.
MACsec support in Data Center VXLAN EVPN and BGP fabrics
MACsec is supported in Data Center VXLAN EVPN and BGP fabrics for intra-fabric links. You should enable MACsec on the fabric and on each required intra-fabric link to configure MACsec. Unlike CloudSec, auto-configuration of MACsec is not supported.
Support is available for MACsec for inter-fabric links, DCI MACsec, with a QKD server to generate keys or using preshared keys. For more information, see the section "About connecting two NX-OS fabrics with MACsec using QKD" in Working with Connectivity in Your Nexus Dashboard LAN Fabrics.
MACsec is supported on switches with minimum Cisco NX-OS releases 7.0(3), I7(8), and 9.3(5).
Guidelines
-
If MACsec cannot be configured on the physical interfaces of the link, an error is displayed when you click Save. MACsec cannot be configured on the device and link due to the following reasons:
-
The minimum NX-OS version is not met.
-
The interface is not MACsec capable.
-
-
MACsec global parameters in the fabric settings can be changed at any time.
-
MACsec and CloudSec can coexist on a BGW device.
-
MACsec status of a link with MACsec enabled is displayed on the Links page.
-
Brownfield migration of devices with MACsec configured is supported using switch and interface freeform configs.
For more information about MACsec configuration, which includes supported platforms and releases, see the Configuring MACsec chapter in Cisco Nexus 9000 Series NX-OS Security Configuration Guide.
The following sections show how to enable and disable MACsec in Nexus Dashboard.
Enable MACsec
The process described in this section is for configuring MACsec for intra-fabric links and inter-fabric links.
For information on configuring data center interconnect (DCI) MACsec for inter-fabric links and using a quantum key distribution (QKD) server, see the section "About connecting two NX-OS fabrics with MACsec using QKD" in Working with Connectivity in Your Nexus Dashboard LAN Fabrics.
-
Navigate to Manage > Fabrics.
-
Click Create Fabric to create a new fabric or click Actions > Edit Fabric Settings on an existing Data Center VXLAN EVPN fabric.
-
Click Fabric Management > Security and specify the MACsec details.
Field Description Enable MACsec
Check the check box to enable MACsec in the fabric. MACsec configuration is not generated until MACsec is enabled on an intra-fabric link. Perform a Recalculate and deploy operation to generate the MACsec configuration and deploy the configuration on the switch.
MACsec Cipher Suite
Choose one of the following MACsec cipher suites for the MACsec policy:
-
GCM-AES-128
-
GCM-AES-256
-
GCM-AES-XPN-128
-
GCM-AES-XPN-256
The default value is GCM-AES-XPN-256.
MACsec Primary Key String
Specify a Cisco Type 7 encrypted octet string that is used for establishing the primary MACsec session. For AES_256_CMAC, the key string length must be 130 and for AES_128_CMAC, the key string length must be 66. If these values are not specified correctly, an error is displayed when you save the fabric.
The default key lifetime is infinite.
MACsec Primary Cryptographic Algorithm
Choose the cryptographic algorithm used for the primary key string. It can be AES_128_CMAC or AES_256_CMAC. The default value is AES_128_CMAC.
You can configure a fallback key on the device to initiate a backup session if the primary session fails.
MACsec Fallback Key String
Specify a Cisco Type 7 encrypted octet string that is used for establishing a fallback MACsec session. For AES_256_CMAC, the key string length must be 130 and for AES_128_CMAC, the key string length must be 66. If these values are not specified correctly, an error is displayed when you save the fabric.
MACsec Fallback Cryptographic Algorithm
Choose the cryptographic algorithm used for the fallback key string. It can be AES_128_CMAC or AES_256_CMAC. The default value is AES_128_CMAC.
Enable DCI MACsec
Check the check box to enable DCI MACsec on DCI links.
If you enable the Enable DCI MACsec option and disable the Use Link MACsec Setting option, Nexus Dashboard uses the fabric settings for configuring DCI MACsec on the DCI links.
Enable QKD
Check the check box to enable the QKD server for generating quantum keys for encryption.
If you choose to not enable the Enable QKD option, Nexus Dashboard generates preshared keys instead of using the QKD server to generate the keys. If you disable the Enable QKD option, all the fields pertaining to QKD are grayed out.
DCI MACsec Cipher Suite
Choose one of the following DCI MACsec cipher suites for the DCI MACsec policy:
-
GCM-AES-128
-
GCM-AES-256
-
GCM-AES-XPN-128
-
GCM-AES-XPN-256
The default value is GCM-AES-XPN-256.
DCI MACsec Primary Key String
Specify a Cisco Type 7 encrypted octet string that is used for establishing the primary DCI MACsec session. For AES_256_CMAC, the key string length must be 130 and for AES_128_CMAC, the key string length must be 66. If these values are not specified correctly, an error is displayed when you save the fabric.
The default key lifetime is infinite.
DCI MACsec Primary Cryptographic Algorithm
Choose the cryptographic algorithm used for the primary key string. It can be AES_128_CMAC or AES_256_CMAC. The default value is AES_128_CMAC.
You can configure a fallback key on the device to initiate a backup session if the primary session fails.
DCI MACsec Fallback Key String
Specify a Cisco Type 7 encrypted octet string that is used for establishing a fallback MACsec session. For AES_256_CMAC, the key string length must be 130 and for AES_128_CMAC, the key string length must be 66. If these values are not specified correctly, an error is displayed when you save the fabric.
If you disabled the Enable QKD option, you need to specify the DCI MACsec Fallback Key String option.
DCI MACsec Fallback Cryptographic Algorithm
Choose the cryptographic algorithm used for the fallback key string. It can be AES_128_CMAC or AES_256_CMAC. The default value is AES_128_CMAC.
QKD Profile Name
Specify the crypto profile name.
The maximum size is 63.
KME Server IP
Specify the IPv4 address for the Key Management Entity (KME) server.
KME Server Port Number
Specify the port number for the KME server.
Trustpoint Label
Specify the authentication type trustpoint label.
The maximum size is 64.
Ignore Certificate
Enable this check box to skip verification of incoming certificates.
MACsec Status Report Timer
Specify the MACsec operational status periodic report timer in minutes.
-
-
Click Save.
-
Click a fabric to view the Summary in the side panel.
-
Click the Launch icon to open the Fabric Overview page.
-
Click the Fabric Overview > Links tab.
-
Choose an inter-fabric connection (IFC) link on which you want to enable MACsec and click Actions > Edit. For more information on creating a VRF-Lite inter-fabric link, see the section "Establishing inter-fabric connectivity using VRF Lite" Working with Connectivity in Your Nexus Dashboard LAN Fabrics.
The Link Management - Edit Link page displays.
-
From the Link Management - Edit Link page, navigate to the Security tab and enter the required parameters.
For an inter-fabric link, the Enable MACsec option is in Security.
Field Description Enable MACsec
Check the check box to enable MACsec on the VRF-Lite inter-fabric connection (IFC) link.
If you enable the Enable MACsec option and you disable the Use Link MACsec Setting option, Nexus Dashboard uses the fabric settings for configuring MACsec on the VRF-Lite IFC.
When MACsec is configured on the link, Nexus Dashboard generates the following configurations:
-
Switch-level MACsec configurations if this is the first link that enables MACsec.
-
MACsec configurations for the link.
Source MACsec Policy/Key-Chain Name Prefix
Specify the prefix for the policy and key-chain names for the MACsec configuration at the source.
The default value is DCI, and you can change the value.
Destination MACsec Policy/Key-Chain Name Prefix
Specify the prefix for the policy and key-chain names for the MACsec configuration at the destination.
The default value is DCI, and you can change the value.
Enable QKD
Check the check box to enable the QKD server for generating quantum keys for encryption.
If you choose to not enable the Enable QKD option, Nexus Dashboard uses preshared keys provided by the user instead of using the QKD server to generate the keys. If you disable the Enable QKD option, all the fields pertaining to QKD are grayed out.
Use Link MACsec Setting
Check this check box as the override option for using the link settings instead of using the fabric settings.
MACsec Cipher Suite
Choose one of the following MACsec cipher suites for the MACsec policy:
-
GCM-AES-128
-
GCM-AES-256
-
GCM-AES-XPN-128
-
GCM-AES-XPN-256
The default value is GCM-AES-XPN-256.
MACsec Primary Key String
Specify a Cisco Type 7 encrypted octet string that is used for establishing the primary DCI MACsec session. For AES_256_CMAC, the key string length must be 130 and for AES_128_CMAC, the key string length must be 66. If these values are not specified correctly, an error is displayed when you save the fabric.
The default key lifetime is infinite.
MACsec Primary Cryptographic Algorithm
Choose the cryptographic algorithm used for the primary key string. It can be AES_128_CMAC or AES_256_CMAC. The default value is AES_128_CMAC.
You can configure a fallback key on the device to initiate a backup session if the primary session fails.
MACsec Fallback Key String
Specify a Cisco Type 7 encrypted octet string that is used for establishing a fallback MACsec session. For AES_256_CMAC, the key string length must be 130 and for AES_128_CMAC, the key string length must be 66. If these values are not specified correctly, an error is displayed when you save the fabric.
This parameter is mandatory if Enable QKD is not selected.
MACsec Fallback Cryptographic Algorithm
Choose the cryptographic algorithm used for the fallback key string. It can be AES_128_CMAC or AES_256_CMAC. The default value is AES_128_CMAC.
Source QKD Profile Name
Specify the source crypto profile name.
The maximum size is 63.
Source KME Server IP
Specify the source IPv4 address for the Key Management Entity (KME) server.
Source KME Server Port Number
Specify the source port number for the KMEserver.
Source Trustpoint Label
Specify the source authentication type trustpoint label.
The maximum size is 64.
Destination QKD Profile Name
Specify the destination crypto profile name.
Destination KME Server IP
Specify the destination IPv4 address for the KME server.
Destination KME Server Port Number
Specify the destination port number for the KME server.
Destination Trustpoint Label
Specify the destination authentication type trustpoint label.
The maximum size is 64.
Ignore Certificate
Specify if you want to skip verification of incoming certificates.
-
-
Click Save.
-
From the Fabric Overview > Switches tab, select Actions > Recalculate and deploy to deploy the MACsec configuration on the switch.
Disable MACsec
The process described in this section is for disabling MACsec on an inter-fabric link for Data Center VXLAN EVPN and BGP fabrics.
For information on disabling MACsec for an inter-fabric link with a quantum key distribution (QKD) server, see the section "About connecting two NX-OS fabrics with MACsec using QKD" in Creating LAN and ACI Fabrics and Fabric Groups].
Nexus Dashboard performs the following operations when you disable MACsec:
-
Disables MACsec on an inter-fabric link using QKD or a preshared key.
-
If this is the last link where MACsec is enabled, Nexus Dashboard deletes the switch-level MACsec configuration from the switch.
-
Navigate to the Fabric Overview > Links tab.
-
Choose the link on which you want to disable MACsec on the inter-fabric link.
-
From the Link Management - Edit Link page, navigate to the appropriate tab and unselect the Enable MACsec option.
For an intra-fabric link, the Enable MACsec option is in the Advanced tab.
For an inter-fabric link, the Enable MACsec option is in the Security tab.
-
Click Save.
-
From the Fabric Overview > Switches tab, select Actions > Deploy to remove the MACsec configuration from the switch.
-
vPC fabric peering
vPC Fabric Peering provides an enhanced dual-homing access solution without the overhead of wasting physical ports for vPC Peer Link. This feature preserves all the characteristics of a traditional vPC. For more information, see Information about vPC Fabric Peering section in Cisco Nexus 9000 Series NX-OS VXLAN Configuration Guide.
You can create a virtual peer link for two switches or change the existing physical peer link to a virtual peer link. Nexus Dashboard supports vPC fabric peering in both greenfield as well as brownfield deployments. This feature is applicable for Data Center VXLAN EVPN and BGP Fabric fabric templates.
The BGP Fabric fabric does not support brownfield import.
Guidelines and limitations
The following are the guidelines and limitations for vPC fabric pairing.
-
vPC fabric peering is supported from Cisco NX-OS Release 9.2(3).
-
Only Cisco Nexus N9K-C9332C Switch, Cisco Nexus N9K-C9364C Switch, Cisco Nexus N9K-C9348GC-FXP Switch as also the Cisco Nexus 9000 Series Switches that ends with FX, and FX2 support vPC fabric peering.
-
Cisco Nexus N9K-C93180YC-FX3S and N9K-C93108TC-FX3P platform switches support vPC fabric peering.
-
Cisco Nexus 9300-EX, and 9300-FX/FXP/FX2/FX3/GX/GX2 platform switches support vPC Fabric Peering. Cisco Nexus 9200 and 9500 platform switches do not support vPC Fabric Peering. For more information, see Guidelines and Limitations for vPC Fabric Peering section in Cisco Nexus 9000 Series NX-OS VXLAN Configuration Guide.
-
If you use other Cisco Nexus 9000 Series Switches, a warning will appear during Recalculate & Deploy. A warning appears in this case because these switches will be supported in future releases.
-
If you try pairing switches that do not support vPC fabric peering, using the Use Virtual Peerlink option, a warning will appear when you deploy the fabric.
-
You can convert a physical peer link to a virtual peer link and vice-versa with or without overlays.
-
Switches with border gateway leaf roles do not support vPC fabric peering.
-
vPC fabric peering is not supported for Cisco Nexus 9000 Series Modular Chassis and FEXs. An error appears during Recalculate & Deploy if you try to pair any of these.
-
Brownfield deployments and greenfield deployments support vPC fabric peering in Cisco Nexus Dashboard.
-
However, you can import switches that are connected using physical peer links and convert the physical peer links to virtual peer links after Recalculate & Deploy. To update a TCAM region during the feature configuration, use the hardware access-list tcam ingress-flow redirect512 command in the configuration terminal.
QoS for fabric vPC-peering
In the Data Center VXLAN EVPN fabric settings, you can enable QoS on spines for guaranteed delivery of vPC Fabric Peering communication. Additionally, you can specify the QoS policy name.
Note the following guidelines for a greenfield deployment:
-
If QoS is enabled and the fabric is newly created:
-
If spines or super spines neighbor is a virtual vPC, make sure neighbor is not honored from invalid links, for example, super spine to leaf or borders to spine when super spine is present.
-
Based on the Cisco Nexus 9000 Series Switch model, create the recommended global QoS config using the switch_freeform policy template.
-
Enable QoS on fabric links from spine to the correct neighbor.
-
-
If the QoS policy name is edited, make sure policy name change is honored everywhere, that is, global and links.
-
If QoS is disabled, delete all configuration related to QoS fabric vPC peering.
-
If there is no change, then honor the existing PTI.
For more information about a greenfield deployment, see Creating LAN and ACI Fabrics and Fabric Groups.
Note the following guidelines for a brownfield deployment:
Brownfield Scenario 1:
-
If QoS is enabled and the policy name is specified:
You need to enable only when the policy name for the global QoS and neighbor link service policy is same for all the fabric vPC peering connected spines.
-
Capture the QoS configuration from switch based on the policy name and filter it from unaccounted configuration based on the policy name and put the configuration in the switch_freeform with PTI description.
-
Create service policy configuration for the fabric interfaces as well.
-
Greenfield configuration should make sure to honor the brownfield configuration.
-
-
If the QoS policy name is edited, delete the existing policies and brownfield extra configuration as well, and follow the greenfield flow with the recommended configuration.
-
If QoS is disabled, delete all the configuration related to QoS fabric vPC peering.
No cross check for possible or error mismatch user configuration, and user might see the diff.
Brownfield Scenario 2:
-
If QoS is enabled and the policy name is not specified, QoS configuration is part of the unaccounted switch freeform config.
-
If QoS is enabled from fabric settings after Recalculate & Deploy for brownfield, QoS configuration overlaps and you will see the diff if fabric vPC peering config is already present.
For more information about a brownfield deployment, see Creating LAN and ACI Fabrics and Fabric Groups].
To view the vPC pairing window of a switch, from the fabric topology window, right-click the switch and choose vPC Pairing. The vPC pairing window for a switch has the following fields:
| Field | Description |
|---|---|
|
Use Virtual Peerlink |
Allows you to enable or disable the virtual peer linking between switches. |
|
Switch name |
Specifies all the peer switches in a fabric.NOTE: When you have not paired any peer switches, you can see all the switches in a fabric. After you pair a peer switch, you can see only the peer switch in the vPC pairing window. |
|
Recommended |
Specifies if the peer switch can be paired with the selected switch. Valid values are true and false. Recommended peer switches will be set to true. |
|
Reason |
Specifies why the vPC pairing between the selected switch and the peer switches is possible or not possible. |
|
Serial Number |
Specifies the serial number of the peer switches. |
You can perform the following with the vPC Pairing option:
Create a virtual peer link
To create a virtual peer link from the Cisco Nexus Dashboard Web UI, perform the following steps:
-
Choose Home > Topology.
-
Choose a fabric with the Data Center VXLAN EVPN or BGP Fabric fabric type.
-
Right-click a switch and choose vPC Pairing from the drop-down list.
The window to choose the peer appears.
Alternatively, you can also navigate to the fabric Overview window. Choose a switch in the Inventory > Switches tab and click on Actions > vPC Pairing to create, edit, or unpair a vPC pair. However, you can use this option only when you choose a Cisco Nexus switch.
You will get the following error when you choose a switch with the border gateway leaf role.
<switch-name> has a Network/VRF attached. Please detach the Network/VRF before vPC Pairing/Unpairing -
Check the Use Virtual Peerlink check box.
-
Choose a peer switch and check the Recommended column to see if pairing is possible.
If the value is true, pairing is possible. You can pair switches even if the recommendation is false. However, you will get a warning or error during Recalculate & Deploy.
-
Click Save.
-
In the Topology window, choose Recalculate & Deploy.
The Deploy Configuration window appears.
-
Click the field against the switch in the Preview Config column.
The Config Preview window appears for the switch.
-
View the vPC link details in the pending configuration and side-by-side configuration.
-
Close the window.
-
Click the pending errors icon next to Recalculate & Deploy icon to view errors and warnings, if any.
If you see any warnings that are related to TCAM, click the Resolve icon. A confirmation dialog box about reloading switches appears. Click OK. You can also reload the switches from the topology window. For more information, see Guidelines and Limitations for vPC Fabric Peering and Migrating from vPC to vPC Fabric Peering sections in Cisco Nexus 9000 Series NX-OS VXLAN Configuration Guide.
The switches that are connected through vPC fabric peering, are enclosed in a gray cloud.
Convert a physical peer link to a virtual peer link
Before you begin
-
Perform the conversion from physical peer link to virtual peer link during the maintenance window of switches.
-
Ensure the switches support vPC fabric peering. Only the following switches support vPC fabric peering:
-
Cisco Nexus N9K-C9332C Switch, Cisco Nexus N9K-C9364C Switch, and Cisco Nexus N9K-C9348GC-FXP Switch.
-
Cisco Nexus 9000 Series Switches that ends with FX, FX2, and FX2-Z.
-
Cisco Nexus 9300-EX, and 9300-FX/FXP/FX2/FX3/GX/GX2 platform switches. For more information, see Guidelines and Limitations for vPC Fabric Peering section in Cisco Nexus 9000 Series NX-OS VXLAN Configuration Guide.
-
To convert a physical peer link to a virtual peer link from the Cisco Nexus Dashboard Web UI, perform the following steps:
-
Choose Home > Topology.
-
Choose a fabric with the Data Center VXLAN EVPN or BGP Fabric fabric type.
-
Right-click the switch that is connected using the physical peer link and choose vPC Pairing from the drop-down list.
The window to choose the peer appears.
Alternatively, you can also navigate to the fabric Overview window. Choose a switch in the Inventory > Switches tab and click on Actions > vPC Pairing to create, edit, or unpair a vPC pair. However, you can use this option only when you choose a Cisco Nexus switch.
You will get the following error when you choose a switch with the border gateway leaf role.
<switch-name> has a Network/VRF attached. Please detach the Network/VRF before vPC Pairing/Unpairing -
Check the Recommended column to see if pairing is possible.
If the value is true, pairing is possible. You can pair switches even if the recommendation is false. However, you will get a warning or error during Recalculate & Deploy.
-
Check the Use Virtual Peerlink check box.
The Unpair icon changes to Save.
-
Click Save.
After you click Save, the physical vPC peer link is automatically deleted between the switches even without deployment.
-
In the Topology window, choose Recalculate & Deploy.
The Deploy Configuration window appears.
-
Click the field against the switch in the Preview Config column.
The Config Preview window appears for the switch.
-
View the vPC link details in the pending configuration and the side-by-side configuration.
-
Close the window.
-
Click the pending errors icon next to the Recalculate & Deploy icon to view errors and warnings, if any.
If you see any warnings that are related to TCAM, click the Resolve icon. A confirmation dialog box about reloading switches appears. Click OK. You can also reload the switches from the fabric topology window.
The physical peer link between the peer switches turns red. Delete this link. The switches are connected only through a virtual peer link and are enclosed in a gray cloud.
Convert a virtual peer link to a physical peer link
Before you begin
Connect the switches using a physical peer link before disabling the vPC fabric peering.
To convert a virtual peer link to a physical peer link from the Cisco Nexus Dashboard Web UI, perform the following steps:
-
Choose Home > Topology.
-
Choose a fabric with the Data Center VXLAN EVPN or BGP Fabric fabric type.
-
Right-click the switch that is connected through a virtual peer link and choose vPC Pairing from the drop-down list.
The window to choose the peer appears.
Alternatively, you can also navigate to the fabric Overview window. Choose a switch in the Inventory > Switches tab and click on Actions > vPC Pairing to create, edit, or unpair a vPC pair. However, you can use this option only when you choose a Cisco Nexus switch.
-
Uncheck the Use Virtual Peerlink check box.
The Unpair icon changes to Save.
-
Click Save.
-
In the Topology window, choose Recalculate & Deploy.
The Deploy Configuration window appears.
-
Click the field against the switch in the Preview Config column.
The Config Preview window appears for the switch.
-
View the vPC peer link details in the pending configuration and the side-by-side configuration.
-
Close the window.
-
Click the pending errors icon next to the Recalculate & Deploy icon to view errors and warnings, if any.
If you see any warnings that are related to TCAM, click the Resolve icon. The confirmation dialog box about reloading switches appears. Click OK. You can also reload the switches from the fabric topology window.
The virtual peer link, represented by a gray cloud, disappears and the peer switches are connected through a physical peer link.
Deploying Fabric Underlay eBGP Policies
To deploy fabric underlay eBGP policy, you must manually add the leaf_bgp_asn policy on each leaf switch to specify the BGP AS number used on the switch. Implementing the Recalculate & Deploy operation afterwards will generate eBGP peering over the physical interface between the leaf and spine switches to exchange underlay reachability information. If Same-Tier-AS mode is used, you can deploy the leaf_bgp_asn policy on all leafs at the same time as they share the same BGP ASN.
In a Multi-AS fabric, add the the leaf_bgp_asn policy on each leaf node and the fabric. In a vPC switch pair, they share the same AS number.
To add a policy to the required switch, see the section "Add a policy" in Working with Configuration Policies for Your Nexus Dashboard LAN or IPFM Fabrics.
Deploying Fabric Overlay eBGP Policies
You must manually add the eBGP overlay policy for overlay peering. Nexus Dashboard provides the built-in eBGP leaf and spine overlay peering policy templates that you must manually add to the eBGP leaf and spine switches to form the EVPN overlay peering.
Deploying Spine Switch Overlay Policies
Add the ebgp_overlay_spine_all_neighbor policy on the spine or super spine switches. This policy can be deployed on all the spine switches at once, since they share the same field values. If the network contains spine switches and super spine switches, you must deploy the policy only on the super spine switches.
-
Navigate to Manage > Fabrics and double-click on the fabric.
The Fabric Overview window appears.
-
On the Policies tab, choose Actions > Add policy.
-
Select all the spine switches to which you want to add the ebgp_overlay_spine_all_neighbor policy and click Next.
The Create Policy window appears.
-
Click Choose Template and select the ebgp_overlay_spine_all_neighbor policy.
-
Enter the necessary field values for the following fields, as required and click Save.
| Field | Description |
|---|---|
|
Leaf IP List |
Specifies the IPv6 or the IPv4 address of the connected leaf switch routing loopback interface. If you have enabled IPv6 underlay, ensure you enter the IPv6 address in this field. |
|
Leaf BGP ASN |
The BGP AS numbers of the leaf switches. |
|
BGP Update-Source Interface |
This is the source interface for BGP updates. Underlay routing loopback (loopback0) is used by default. |
-
At the top-right of the Fabric Overview window, choose Actions > Recalculate and deploy.
-
After the configuration deployment is complete, click Close.
You can use the Edit policy option to edit the policy and click Push Configuration to deploy the configuration.
Deploying Leaf Switch Overlay Policies
Add the ebgp_overlay_leaf_all_neighbor policy on all the leaf switches, to establish eBGP overlay peering towards the spine switch. This policy can be deployed on all leaf switches at once, since they share the same field values.
-
Navigate to Manage > Fabrics and double-click on the fabirc.
The Fabric Overview window appears.
-
On the Policies tab, choose Actions > Add policy.
-
Select all the spine switches to which you want to add the ebgp_overlay_leaf_all_neighbor policy and click Next.
The Create Policy window appears.
-
Click Choose Template and select the ebgp_overlay_leaf_all_neighbor policy.
-
Enter the necessary field values for the following fields, as required and click Save.
Field Description Spine/Super Spine IPv4/IPv6 List
Specifies the IPv4 or IPv6 addresses of the routing loopback interfaces of spine or super spine switches for BGP peering. If you have enabled IPv6 underlay, enter the IPv6 address in this field.
If the fabric has any super spine or border super spine, provide the IP addresses of the super spines or border super spines.
BGP Update-Source Interface
This is the source interface for BGP updates. Underlay routing loopback (loopback0) is used by default.
-
At the top-right of the Fabric Overview window, choose Actions > Recalculate and deploy.
-
After the configuration deployment is complete, click Close.
You can use the Edit policy option to edit the policy and click Push Configuration to deploy the configuration.
Adding a Super Spine Switch to an Existing VXLAN BGP EVPN Fabric
If your fabric contains both spine and super spine switches, you must reconfigure the fabric to use the super spine for deploying the overlay between the leaf and the border devices. This topic describes steps to integrate a super spine switch to your existing fabric which has a leaf switch and a spine switch with an overlay between them.
-
To add the ebgp_overlay_spine_all_neighbor policy to super spine switches that are newly added to an existing VXLAN BPG EVPN fabric:
-
Navigate to the Fabric Overview window for your fabric and click the Policies tab.
-
Select the super spine switches to which you want to add the ebgp_overlay_spine_all_neighbor policy and click Next.
The Create Policy window appears.
-
Click Choose Template and select the ebgp_overlay_spine_all_neighbor policy.
-
Enter the IPv4 or IPv6 addresses of the leaf switches in the Leaf IP List field.
-
Enter the AS numbers for the leaf switches in the Leaf BGP ASN field and click Save.
-
-
To modify the existing ebgp_overlay_leaf_all_neighbor policy on each leaf node:
-
Find the existing policy by filtering based on ebgp_overlay_leaf_all_neighbor template name.
Ensure you modify only one policy at a time.
-
Select a policy and choose Action > Edit policy.
-
Enter the IP addresses of the super spine routing loopback interfaces in the Spine/Super Spine IP List field and click Save.
-
-
Select the leaf and the super spine switches that you have added in step 2 and choose Actions > Deploy.
-
On the Links tab, click on Protocol View and verify that eBGP peering between the super spine and leaf switches are established.
-
Remove the existing overlay between the leaf and the spine switches as follows:
-
On the spine switch, select the ebgp_overlay_spine_all_neighbor policy and choose Actions > Delete policy.
-
On the leaf switch, select the ebgp_overlay_leaf_all_neighbor policy and choose Actions > Edit policy.
-
Remove the IP address of the spine switch in the Spine/Super Spine IPv4/IPv6 List field and click Save.
-
-
To deploy the updated configuration on spine and leaf switches , choose Actions > Recalculate and deploy at the top-right of the Fabric Overview window.
or
Select the leaf and the spine switches and choose Actions > Deploy.
First Published: 2025-01-31
Last Modified: 2025-01-31