
New and changed information
The following table provides an overview of the significant changes up to this current release. The table does not provide an exhaustive list of all changes or of the new features up to this release.
| Release Version | Feature | Description |
|---|---|---|
|
Nexus Dashboard 4.1.1 |
Improved navigation and workflow when working with system settings |
Beginning with Nexus Dashboard 4.1.1, the navigation and workflow when working with system settings have been enhanced. |
Navigate to System Settings
To navigate to the System Settings page, click Admin > System Settings.
These tabs are available under the System Settings page:
General
The General page under System Settings has these areas:
Cluster details
Use the Cluster details area to view these cluster details:
-
Name
-
App subnet
-
Service subnet
-
App subnet IPv6
-
Service subnet IPv6
DNS
Use the DNS area to configure DNS for the system.
Guidelines and limitations: DNS
-
The DNS server must work for both UDP and TCP in order to successfully add it in the Providers area, as described in Configure DNS.
Configure DNS
To configure DNS:
-
Click General.
-
In the DNS area, click Edit.
-
Add DNS search domains.
-
Under Search domains, click + Add DNS search domain.
-
Enter the DNS search domain in the field, then click the checkmark on that row.
-
Repeat these steps to add additional DNS search domains.
-
-
Add DNS providers.
-
Under Providers, click + Add DNS provider.
-
Enter the DNS provider in the field, then click the checkmark on that row.
-
Repeat these steps to add additional DNS providers.
-
-
Click Save.
NTP
Use the NTP area to configure NTP for the system.
-
Click General.
-
In the NTP area, click Edit.
-
Add NTP ID keys.
-
Under ID, click + Add key.
-
Enter the necessary information or enable options in these fields:
-
ID
-
Key
-
Trusted checkbox
-
Authentication type
-
-
Click the checkmark on that row when you have completed the NTP ID configuration.
-
Repeat these steps to add additional NTP ID keys.
-
-
Add NTP hostname/IP addresses.
-
Under NTP hostname/IP address, click + Add NTP hostname/IP address.
-
Enter the necessary information or enable options in these fields:
-
NTP hostname/IP address
-
Key
-
Preferred checkbox
-
-
Click the checkmark on that row when you have completed the NTP hostname/IP address configuration.
-
Repeat these steps to add additional NTP hostname/IP address configurations.
-
-
Click Save.
Proxy configuration
Use the Proxy configuration area to configure a proxy server.
Add a proxy server
In certain deployment scenarios, you may have to access the Internet through a proxy.
Note that Nexus Dashboard uses two main route tables — one for the Management network and one for the Data network — and by default, it will use the routing table of the originating IP address. In other words, Nexus Dashboard will attempt to reach the proxy from the routing table of the POD/Service that is trying to use the proxy.
For example, if you configure a proxy and establish Intersight connectivity from your Nexus Dashboard and then attempt to configure the AppDynamics integration from the Insights service running in the cluster, you may get an error stating that the AppDynamics host is not reachable. This happens because the proxy is only accessible from the management interface, so in such cases you also need to add a management network route for the proxy IP address.
To add a proxy server:
-
Navigate to Admin > System Settings > General.
-
In the Proxy configuration area, click Edit.
-
Click + Add HTTP Server in the proxy configuration window.
-
From the Type dropdown, select the type of traffic that you want to be proxied.
-
In the Server field, provide the full address for the proxy server, including the port if required.
For example 'http://proxy.company.com:80'.
-
If the server requires login credentials, provide the Username and Password.
-
(Optional) Click + Add Ignore Host to provide any hosts that will ignore the proxy.
You can add one or more hosts with which the cluster will communicate directly bypassing the proxy.
Routes
Configure management and data network routes through Routes. You might configure management or data network routes for several reasons, such as:
-
When using inband POAP, you will have to configure the appropriate data network routes for reachability to the switch inband interfaces. For more information, see Configuring Inband Management and Out-of-Band PnP.
-
Configuring your Git IP route in order to import a template from Git. For more information, see Managing the Template Library for LAN Fabrics.
To configure management and data network routes:
-
Click General.
-
In the Routes area, click Edit.
The Routes page appears, with the configured management and data network routes displayed.
-
To configure additional management network routes, in the Management network routes area, click + Add management network routes. Enter the IP address for the management network route, then click the checkmark in that row.
-
To configure additional data network routes, in the Data network routes area, click + Add data network routes. Enter the IP address for the data network route, then click the checkmark in that row.
-
External pools
Configure persistent IP addresses through External pools.
-
Click General.
-
In the External Pools area, click Edit.
The External Service Pools page appears.
-
In the Persistent data IPs area, click + Add IP Address and enter the necessary persistent IP addresses. Click the checkmark for each IP address that you enter.
Change persistent IP address
You can change the persistent IP addresses that are assigned for mandatory pods, such as POAP-SCP and SNMP traps.
To change the persistent IP address, perform the following steps:
-
On the Nexus Dashboard Web UI, navigate to Admin > System Settings > Fabric Management.
-
Under Advanced Settings, click Admin.
-
In the LAN Device Management Connectivity field, change Management to Data or vice versa.
Changing the option results in a migration of SNMP and POAP-SCP pods to the persistent IP addresses associated with External Service Pool on Nexus Dashboard associated with the new LAN Device Management Connectivity option. After the completion of this process, the following message is displayed:
Some features have been updated. Reload the page to see latest changes.Click Reload the page.
-
On the Nexus Dashboard Web UI, navigate to Admin > System Settings > General.
-
In the External pools card, click Edit to change the required IP addresses for Persistent management IPs or Persistent data IPs.
-
Navigate back to Admin > System Settings > Fabric Management > Advanced Settings > Admin, then change the option in LAN Device Management Connectivity drop-down list to its initial selection.
Restoring this option to initial settings results in migration of the SNMP and POAP-SCP pods to use the updated persistent IP address from the appropriate external Service IP pool.
Advanced settings
You can configure these areas under Advanced settings:
Fabric snapshot creation
To enable the snapshot feature at the system level.
-
Navigate to Admin > System Settings.
-
With the General tab selected, locate the Advanced Settings area.
-
Determine if the Fabric snapshot creation feature is enabled or not.
-
If you see Enabled under the Fabric snapshot creation field, this feature has already been enabled.
-
If you see Disabled under the Fabric snapshot creation field:
-
Click Edit in the Advanced Settings area.
The Advanced settings slide-in pane appears.
-
Click the checkbox next to Enable fabric snapshot creation to enable this feature, then click Save.
You will now see Enabled under the Fabric snapshot creation field.
-
-
See the section "Onboard snapshot LAN fabrics" in Creating LAN and ACI Fabrics and Fabric Groups for more information.
Display advanced settings and options for TAC support
To display advanced settings and options for TAC support.
-
Navigate to Admin > System Settings.
-
With the General tab selected, locate the Advanced Settings area.
-
Determine if the Display advanced settings and options for TAC support feature is enabled or not.
-
If you see Enabled under the Display advanced settings and options for TAC support field, this feature has already been enabled.
-
If you see Disabled under the Display advanced settings and options for TAC support field:
-
Click Edit in the Advanced Settings area.
The Advanced settings slide-in pane appears.
-
Click the checkbox next to Display advanced settings and options for TAC support to enable this feature, then click Save.
You will now see Enabled under the Display advanced settings and options for TAC support field.
-
-
Remote storage
The remote storage location information is referenced by any feature that uses remote storage location, including the unified backup and restore.
-
In the Nexus Dashboard GUI, navigate to Admin > System Settings.
The General tab is chosen by default.
-
Locate the Remote storage area in General.
-
If you do not have any remote storage locations already created, you will see the message
No remote storage addeddisplayed on the page. -
If you have remote storage locations already created, you’ll see those remote storage locations listed with the following values:
Field Description Name
The name of the remote storage location.
Description
A description of the remote storage location, if necessary.
IP Address
The IP address of the remote storage location.
Protocol
The remote storage location type:
-
NAS Storage
-
SFTP
Status
The status of the remote storage location.
-
-
-
If there are no remote storage locations created yet, click Edit in the Remote storage area.
The Remote storage page appears.
-
Click + Add Remote Storage Locations to create a remote storage location.
The Create Remote Storage Location page appears.
-
In the Create Remote Storage Location window, enter the necessary information to configure the remote storage location.
Field Description Name
Enter the name of the remote storage location.
Description
(Optional) Enter a description of the remote storage location.
Remote Storage Location Type
Choose SFTP/SCP Server as the remote storage location type.

As mentioned earlier, any feature that uses a remote storage location references the remote storage location information, not just unified backup and restore. Even though the Create Remote Storage Location shows NAS Storage as an option, it is not supported with the unified backup and restore feature.
Enter the necessary information when choosing the SFTP/SCP Server option in the Remote Storage Location Type field.
Field Description Protocol
Choose the protocol to use for the remote storage location file transfer:
-
SFTP
-
SCP
Hostname or IP Address
Enter the hostname or IP address of the remote storage location.
Default Path
Enter the path to the directory where the backup file is to be saved on the remote server.
-
The path can be an absolute path, which would start with a slash character (/), such as:
/backups/multisite -
Or the path can be a path relative to your home directory, such as:
Users/backups/multisite
Remote Port
Enter the remote port for the remote host location. This field is pre-populated with a default value of
22.Authorization Type
Choose the authorization type:
-
Password
-
SSH Public Types
-
CyberArk
Username
Enter the authorization username.
Password
Available if you chose Password in the Authorization Type field above. Enter the authorization password.
SSH Key
The SSH Key and Passphrase fields are available if you chose SSH Public Types in the Authorization Type field.
To use SSH keys, follow these steps:
-
Generate the private/public key pairs, with or without a passphrase.
-
Authorize the generated public key on the remote storage location.
-
Enter the private key in the SSH Key field.
-
If you used a passphrase in step 1, enter the passphrase in the Passphrase field.
Passphrase
Credential Store key
The Credential Store key field is available if you choose CyberArk in the Authorization Type field.
You will see the CyberArk tab only if you configured system certificate and mapped to CyberArk feature. For more information on CA certificates and credential store, see Managing Certificates in your Nexus Dashboard and Configuring Users and Security.
-
-
Click Save.
You are returned to the Remote storage page with the newly-created remote storage location listed in the table.
-
To edit a remote storage location entry, click on the ellipsis (…) at the end of the row in the table for that remote storage location and click Edit.
-
To delete a remote storage location entry, click on the ellipsis (…) at the end of the row in the table for that remote storage location and click Delete.
-
-
Click Save in the Remote storage page.
You are returned to the System Settings/General page.
Add network attached storage to export flow records
The workflow to add Network Attached Storage (NAS) to export flow records includes the following steps:
-
Add NAS to Nexus Dashboard.
-
Add the onboarded NAS to Nexus Dashboard to enable export of flow records.
Add NAS to Nexus Dashboard
Follow these steps to add NAS to Nexus Dashboard.
-
Navigate to Admin > System Settings > General.
-
In the Remote storage area, click Edit.
-
Click Add Remote Storage Locations.
-
Complete the following fields to add NAS to Nexus Dashboard.
-
Enter the name of the Network Attached Storage and a description, if desired.
-
In the Remote storage location type field, click NAS Storage.
-
In the Type field, choose Read Write.
Nexus Dashboard requires read and write permission to export the flow record to NAS. A system issue is raised if Nexus Dashboard fails to write to NAS.
-
In the Hostname field, enter the IP address of the Network Attached Storage.
-
In the Port field, enter the port number of the Network Attached Storage.
-
In the Export path field, enter the export path.
Using the export path, Nexus Dashboard creates the directory structure in NAS for exporting the flow records.
-
In the Alert threshold field, enter the alert threshold time.
Alert threshold is used to send an alert when the NAS is used beyond a certain limit.
-
In the Limit (Mi/Gi) field, enter the storage limit in Mi/Gi.
-
Click Save.
-
Add the onboarded NAS to Nexus Dashboard
Follow these steps to add the onboarded NAS to Nexus Dashboard.
-
Navigate to the Fabrics page:
Manage > Fabrics
-
Choose the fabric with the telemetry feature enabled.
-
Choose Actions > Edit Fabric Settings.
-
Click Telemetry.
-
Click the NAS tab in the Telemetry page.
-
Make the necessary configurations in the General settings area.
-
Enter the name in the Name field.
-
In the NAS server field, choose the NAS server added to Nexus Dashboard from the drop-down list.
-
-
In the Collection settings area, choose the flow from the Flows drop-down list.
-
In Base mode, only 5-tuple data for the flow record is exported.
-
In Full mode, the entire data for the flow record is exported.
-
-
Click Save.
The traffic from the flows displayed in the Flows page is exported as a JSON file to the external NAS in the following directory hierarchy.
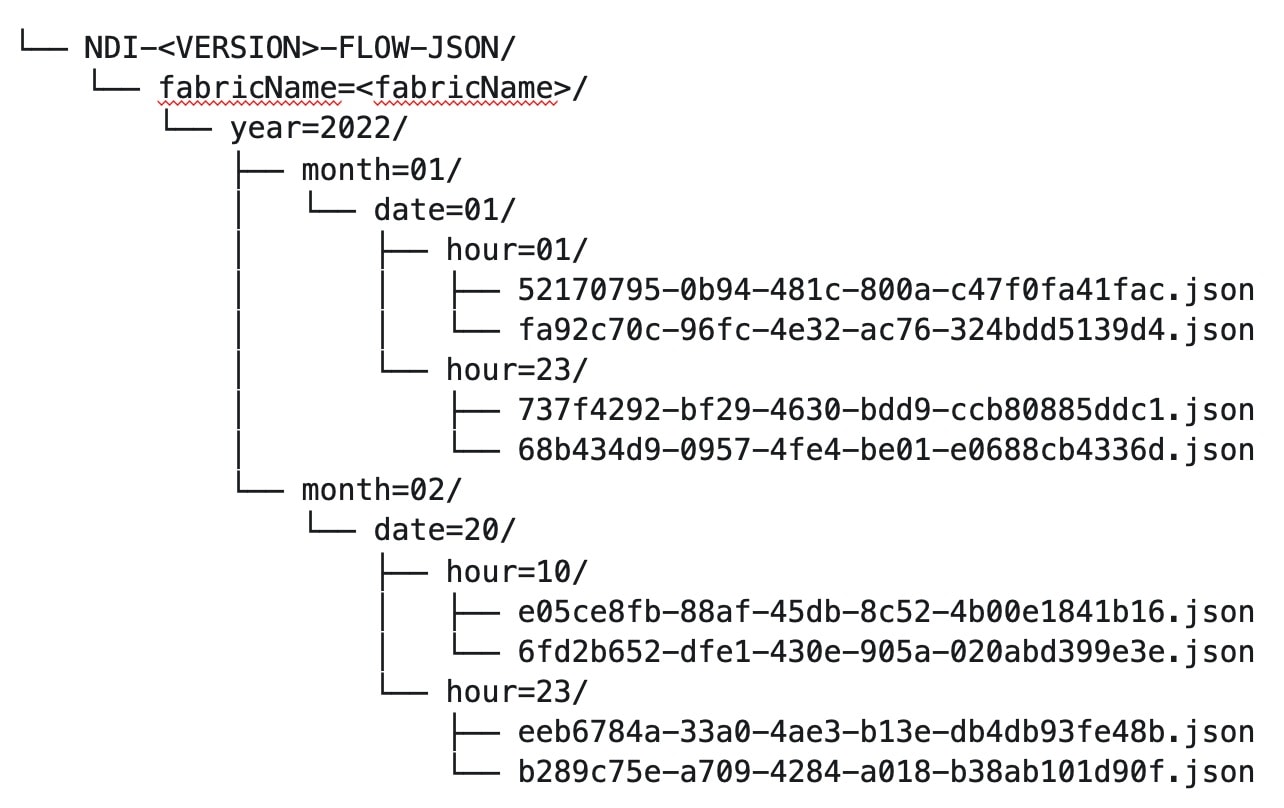
Navigate to Analyze > Flows to view the flows that will be exported.
Each flow record is written as a line delimited JSON.
JSON output file format for a flow record in base mode
{"fabricName":"myapic","terminalTs":1688537547433,"originTs":1688537530376,"srcIp":"2000:201:1:1::1","dstIp":"2000:201:1:1::3","srcPort":1231,"dstPort":1232,"ingressVrf":"vrf1","egressVrf":"vrf1","ingressTenant":"FSV1","egressTenant":"FSV1","protocol":"UDP"}

{"fabricName":"myapic","terminalTs":1688537547378,"originTs":1688537530377,"srcIp":"201.1.1.127","dstIp":"201.1.1.1","srcPort":0,"dstPort":0,"ingressVrf":"vrf1","egressVrf":"","ingressTenant":"FSV2","egressTenant":"","protocol":"ANY-HOST"}
JSON output file format for a flow record in full mode
{"fabricName":"myapic","terminalTs":1688538023562,"originTs":1688538010527,"srcIp":"201.1.1.121","dstIp":"201.1.1.127","srcPort":0,"dstPort":0,"ingressVrf":"vrf1","egressVrf":"vrf1","ingressTenant":"FSV2","egressTenant":"FSV2","protocol":"ANY-HOST","srcEpg":"ext-epg","dstEpg":"ext-epg1","latencyMax":0,"ingressVif":"eth1/15","ingressVni":0,"latency":0,"ingressNodes":"Leaf1-2","ingressVlan":0,"ingressByteCount":104681600,"ingressPktCount":817825,"ingressBurst":0,"ingressBurstMax":34768,"egressNodes":"Leaf1-2","egressVif":"po4", "egressVni":0,"egressVlan":0,"egressByteCount":104681600,"egressPktCount":817825,"egressBurst":0,"egressBurstMax":34768,"dropPktCount":0,"dropByteCount":0,"dropCode":"","dropScore":0,"moveScore":0,"latencyScore":0,"burstScore":0,"anomalyScore":0,"hashCollision":false,"dropNodes":"[]","nodeNames":"[\"Leaf1-2\"]","nodeIngressVifs":"[\"Leaf1-2,eth1/15\"]","nodeEgressVifs":"[\"Leaf1-2,po4\"]“ ,"srcMoveCount":0,"dstMoveCount":0,"moveCount":0,"prexmit":0,"rtoOutside":false,"events":"[[\\\"1688538010527,Leaf1-2,0,3,1,no,no,eth1/15,,po4,po4,,,,,0,64,0,,,,,,,,\\\"]]"}
Remote streaming servers
Use the Remote streaming servers area to add remote streaming servers.
Add remote streaming servers
You might need remote streaming servers to be configured when you deal with various areas in Nexus Dashboard, such as tech support, anomalies, and history and logs.
To add remote streaming servers:
-
Choose Admin > System Settings.
The General tab is selected by default.
-
Locate the Remote streaming servers tile and click Edit.
A table showing any already-configured remote streaming servers appears.
-
Click Add Server.
The Add Server dialog box opens.
-
Determine the service where you want to add remote streaming servers.
Splunk
-
In the Protocol field, choose HTTP or HTTPS based on the Splunk URL that you use.
For example:
-
Choose HTTP, if your login URL is
http://splunk.mycompany.com:8000. -
Choose HTTPS, if your login URL is
https://mycompany.splunkcloud.com/,https://mycompany.splunkcloud.com:443, orhttps://splunk.mycompany.com.
Before enabling HTTP or HTTPS, you must upload the CA certificate for the Splunk destination host to Nexus Dashboard.
-
-
Enter a name for the Splunk remote streaming server in the Name field.
-
In the Hostname/IP Address, enter the hostname or IP address.
-
In the Port field, enter the HTTP event collector (HEC) port number.
The HEC port number for Splunk deployments over HTTP or HTTPS protocols can be one of the following:
-
8088 on Splunk Cloud free trials
-
443 by default on Splunk Cloud Platform instances
-
-
In the Token field, enter the HEC token.
For more information on Splunk deployment guidelines, see the https://docs.splunk.com/Documentation/Splunk/9.4.0/Data/UsetheHTTPEventCollector [Set up and use HTTP Event Collector in Splunk Web].
-
In the Index field, enter the necessary index information for the Splunk remote streaming server.
The index details on the Nexus Dashboard should match with the Splunk index.
-
Click Save in the Add Server page.
You are returned to the Remote streaming server page.
-
In the Remote streaming server page, click Add Server to add another remote streaming server or click Save to save the configured remote streaming servers.
Syslog
-
In the Protocol field, choose either TCP or UDP.
-
Enter a name for the Syslog remote streaming server in the Name field.
-
In the Hostname/IP Address and Port fields, enter the hostname or IP address and port details.
-
Check the box next to the TLS field to enable this option.
Before enabling TLS, you must upload the CA certificate for the Syslog destination host to Nexus Dashboard. See Managing Certificates in your Nexus Dashboard for more information.
-
Click Save in the Add Server page.
You are returned to the Remote streaming server page.
-
In the Remote streaming server page, click Add Server to add another remote streaming server or click Save to save the configured remote streaming servers.
The CA certificate you upload is used to sign the certificate that Splunk and Syslog uses. The certificate for Splunk and Syslog should contain the IP address or DNS name in the Subject Alternative Name (SAN) section.
History and log settings
Use the History and log settings area to enable history and log setting and set the maximum audit record retention duration for your Nexus Dashboard.
To enable history and log setting and set the maximum audit record retention duration for your Nexus Dashboard:
-
Go to Admin > System Settings > General.
-
Under History and logs settings, click Edit.
The History and logs settings dialog box opens.
-
Check the box in the Enable audit logs streaming field to enable that feature, then choose a remote streaming server from the drop-down list.
See Add remote streaming servers for more information on adding remote streaming servers.
-
In the Maximum Number Record Retention duration field, enter the number of months as the duration that you want to have the records retained.
Valid entries are from
1-12. The default duration is 12 months. -
In the Maximum Number of Audit Records field, enter the maximum number of audit records that you want to retain.
Valid entries are from
0-2147483647. The default value for maximum number of audit records is 100K for virtual cluster setup and 500K for a physical cluster. NOTE: When a network reachability issue occurs between Nexus Dashboard and Splunk or Syslog, logs generated during the outage are typically not replayed after the connectivity is restored. Instead, log streaming resumes from the point of recovery, resulting in the loss of any log data produced during the downtime. This means that any log data generated during the downtime is lost and not backfilled or retransmitted after the network is re-established.
Stream system anomalies
Use the Stream system anomalies area to configure destination syslog servers for streaming anomaly records. For more information, see Detecting Anomalies and Identifying Advisories in Your Nexus Dashboard.
-
Click General.
-
In the Stream system anomalies area, click Edit.
-
In the Remote streaming servers area, choose a remote streaming server from the drop-down list.
-
In the Anomalies area, choose the anomaly level, or click Select all to choose all of the anomaly levels.
Anomaly levels include critical, major, and minor.
-
Click Save.
Metadata
To view or configure metadata information:
-
Navigate to Admin > System Settings.
-
With the General tab selected, locate the Metadata area.
Metadata support
Nexus Dashboard uses metadata bundles to detect new bugs, PSIRTs, Field Notices, and End of Life Notices. Metadata packages are constantly updated by us and posted to the Cisco Intersight Cloud after validation. Nexus Dashboard connects to the Cisco Intersight Cloud through a device connector that is embedded in the Nexus Dashboard platform and that pulls periodically updated metadata packages. With metadata support for air-gap environment, if Nexus Dashboard is not connected to Cisco Intersight Cloud, you can manually upload the latest metadata to Nexus Dashboard in a secure and trusted way. You can download the bundle updates from the Cisco DC App Center.
Navigate to Admin > System Settings > Metadata to view the metadata version.
-
In the General area, the Metadata Version is displayed.
-
In the Update Metadata Version area, you can upload metadata for air-gapped environments.
Metadata support for an air-gap environment
With metadata support for air-gap environment, if Nexus Dashboard is not connected to Cisco secure cloud, you can upload the latest metadata to Nexus Dashboard periodically in a secure and trusted way.
You can download the encrypted metadata file from the Cisco DC App Center and upload it to Nexus Dashboard to get decrypted updates on exposure to Bugs, PSIRTs, Defects, Field Notices, and End of Life Notices.
Update metadata version
Use this procedure to update the latest metadata version in an Air-Gap or offline environment.
-
Log in to Cisco DC App Center.
-
From the User drop-down menu, select My Account.
-
Click Config Files Requests tab.
-
Click Request Config File.
-
From the Choose App ID drop-down list, select Nexus Dashboard.
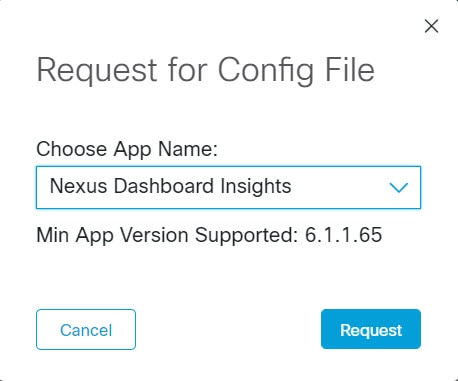
-
Verify the minimum supported app version and click Request.
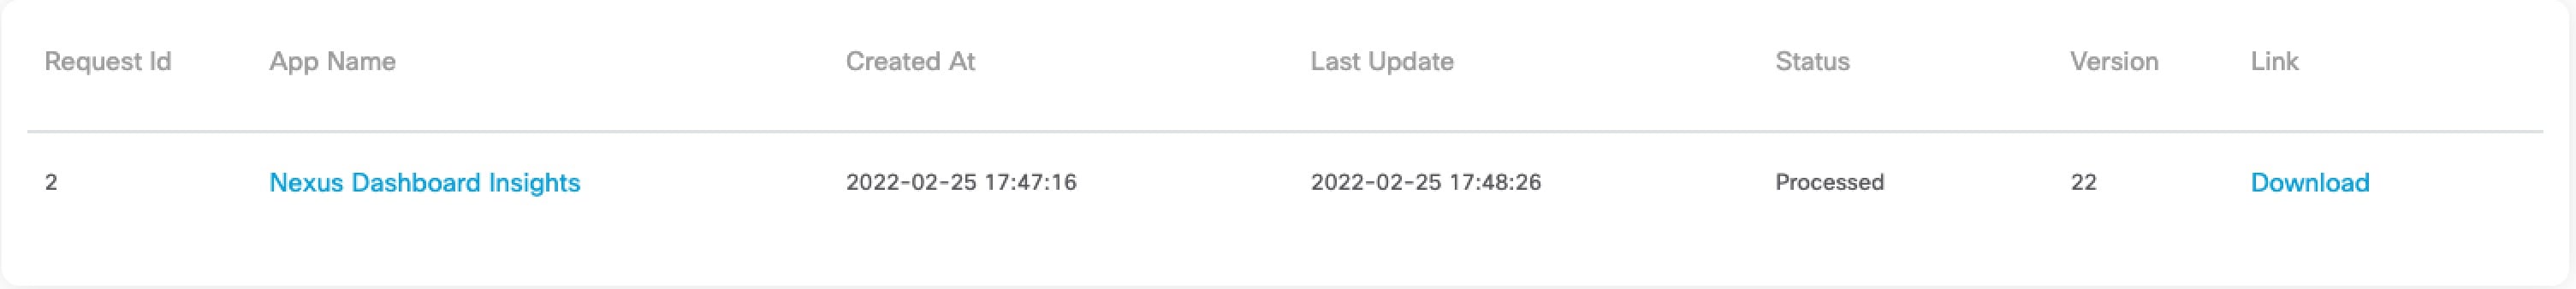
It takes approximately 15 minutes for the request to be completed. In the Config Files Request page, the generated file is displayed in the table below.
-
Select the file and click Download to download the file locally.
-
Log in to Nexus Dashboard.
-
Navigate to Admin > System Settings > Metadata to view the metadata version.
-
In the Update Metadata Version area, upload the file you have downloaded from the Cisco DC App Center.
-
Click Begin Upload to upload the latest metadata.
Message bus configuration
You might configure a message bus for various reasons, such as when you add a Kafka broker configuration. For more information, see the section "Add Kafka broker configuration" in the Editing Fabric Settings article for your fabric type (for example, Editing Data Center VXLAN Fabric Settings.
To configure the message bus at the System Settings level.
-
Navigate to Admin > System Settings > General.
-
In the Message bus configuration area, click Edit.
The Message bus configuration dialog box opens.
-
Click Add message bus configuration.
The Add message bus configuration dialog box opens.
-
In the Name field, enter a name for the configuration.
-
In the Hostname/IP address and Port fields, enter the IP address of the message bus consumer and the port that is listening on the message bus consumer.
-
In the Topic name field, enter the name of the Kafka topic to which Nexus Dashboard must send the messages.
-
In the Mode field, choose the security mode.
The supported modes are Unsecured, Secured SSL and SASLPLAIN. The default value is Unsecured.
-
For Unsecured, no other configurations are needed.
-
For Secured SSL, fill out the following field:
Client certification name — The System Certificate name configured at the Certificate Management level. The CA certificate and System Certificate (which includes Client certificate and Client key) are added at the Certificate Management level.
Refer to Step 2 for step-by-step instructions on managing certificates. Navigate to Admin > Certificate Management to manage the following certificates:
-
CA Certificate — The CA certificate used for signing consumer certificate, which will be stored in the trust-store so that Nexus Dashboard can trust the consumer.
-
Client Certificate — The CA signed certificate for Nexus Dashboard. The certificate is signed by the same CA, and the same CA certificate will be in the truststore of the consumer. This will be stored in Nexus Dashboard’s Kafka keystore that is used for exporting.
-
Client Key — A private key for the Kafka producer, which is Nexus Dashboard in this case. This will be stored in Nexus Dashboard’s Kafka keystore that is used for exporting.
-
-
For SASLPLAIN, fill out these fields:
-
Username — The username for the SASL/PLAIN authentication.
-
Password — The password for the SASL/PLAIN authentication.
-
-
-
Click Save.
Follow these steps to configure email at the system settings level.
-
Navigate to Admin > System Settings > General.
-
In the Email area, click Edit.
The Email configuration page appears.
-
Click Add email configuration.
The Add email configuration page appears.
-
Enter the necessary information to add the email configuration.
Field
Description
Name
Enter the name for the email configuration.
SMTP host
Enter the SMTP host information.
This setting is used as an email out-of-band notification for programmable reports and alarms. The SMTP host address must be reachable through the Nexus Dashboard management interface. If the Nexus Dashboard management interface and SMTP host are part of different IP subnets, then you must create a static route entry in the Nexus Dashboard Cluster configuration.
To initiate alarms to an external receiver, provide the IP address of the SNMP listener and the port that it is listening on.
SMTP host port
Enter the SMTP host port.
Enable SMTP authentication
Check the box to enable SMTP authentication. The default is enabled (box is checked).
Enable this option only if your SMTP server requires credential-based authentication. If SMTP authentication is enabled for an SMTP server that does not require or support SMTP AUTH, email delivery can fail.
SMTP authentication username
Enter the SMTP authentication username.
SMTP authentication password
Enter the SMTP authentication password.
Source email
Enter the From Email address for reports.
-
Click Save in the Add email configuration page.
You are returned to the Email configuration page, with your new email configuration listed in the table.
-
Click Save in the Email configuration page.
You are returned to the System Settings page.
After you add email configurations at the system settings level, those email configurations become available as a drop-down list in the appropriate pages.
Fabric management
The Fabric management page under System Settings has these areas:
Management
Use the Management page to make these configurations:
AAA remote authentication passthrough
The authentication, authorization, and accounting (AAA) remote authentication passthrough feature allows authentication for remote users and eliminates the need to update user credentials manually. When the AAA remote authentication passthrough feature is enabled, it automatically saves discovery and device credentials for remote users after successful login. This feature enhances the workflow for managing fabrics and switches, as users no longer need to change credentials every time a password is changed or updated in the remote server.
The AAA remote passthrough feature is disabled by default.
Before enabling this feature, ensure that the Nexus Dashboard and switches are configured with the same remote authentication server.
Follow these steps to enable the AAA remote passthrough:
-
Navigate to Admin > System Settings > Fabric Management > Management.
-
Check the Enable AAA Passthrough of device credentials checkbox.
-
Click Save to close the Switch bootstrap page.
-
Choose Discovery in Advance settings and check the Enable AAA Passthrough feature checkbox.
-
Choose a value for the auth privacy type in the AAA Passthrough Authentication / Privacy field.
-
Click Save.
ACI Proxy Mode
Follow these steps to enable the ACI proxy mode:
-
Navigate to Admin > System Settings > Fabric Management > Management.
-
In the ACI proxy mode area, choose the appropriate option:
-
Proxy with ND Service User
-
Disable
-
Proxy with remote users credential
-
Topology snapshots
Use the Topology snapshots area to enable topology snapshots.
-
Click Fabric management.
-
In the Topology snapshots area, click Edit.
-
Check the box in the Enable topology snapshots field to enable this feature.
-
Click Save.
Switch bootstrap
You might make configurations in the Switch bootstrap area as a prerequisites for secure POAP. Secure POAP is supported from Cisco NX-OS 9000 Release 10.2.3 or higher version switches. For more information, see Configuring Inband Management and Out-of-Band PnP.
-
Click Fabric management.
-
In the Switch bootstrap area, click Edit.
-
Choose http, https, or tftp from the drop-down list for Bootstrap script download protocol field.
-
For the http option, you must enter the IP address of the bench router (BR), port number, and name for certificate bundle in Bench Router URL with port and certificate file name field. Ensure that the certificates are uploaded on Nexus Dashboard server for values to autopopulate in this field.
-
By default, for the http option, the Bench router URL with port field in the Switch bootstrap window will be blank. After you install the Root CA Certificate bundle on Bench routers, this field will be autopopulated.
If these fields are autopopulated, with default port number 29151 and URL https://10.10.10.1:29151/PoapCACertBundle.pem, you must configure this URL before you install the BR with the Root CA certificate bundle.
-
Make sure that the fabric is in managed mode before configuring the BR.
-
Ensure that you configure the DHCP option if the DHCP server is used.
-
You must upload CA signed POAP server certificate on Nexus Dashboard and upload the corresponding CA certificate bundle for the BR. On Nexus Dashboard, navigate to Admin > Certificate Management > Fabric certificates to upload the relevant certificates.
-
You might also make configurations in the Switch bootstrap area when configuring an automatic import of a pre-provisioned device. For more information, see the section "Pre-provision a device" in Working with Inventory in Your Nexus Dashboard LAN and IPFM Fabrics.
-
Navigate to the Admin > System Settings > Fabric management > Switch bootstrap dashlet.
-
Check the Auto admit pre-provisioned switches during re-poap check box.
By default, the Auto admin pre-provisioned switches during re-poap option is not enabled.
-
Click Save.
Advanced settings
The Advanced settings area under System Settings > Fabric management provides multiple advanced configurations that sometimes differ between fabric types. In addition, you might be directed to the Advanced settings area as part of a procedure, where you might have to make a system-level configuration before fabric-level configurations can take effect.
Change control
For more information on change control, see Using Change Control and Rollback in Your Nexus Dashboard.
The change control feature is disabled by default.
To enable the change control feature:
-
Navigate to the Fabric Management page in Nexus Dashboard:
Admin > System Settings > Fabric Management
-
Locate the Change control feature box in the Fabric Management page and click Edit in that box.
-
Click the box next to Enable change control to enable the change control feature.
-
Determine if there are other configuration settings that you want for change control:
-
Enable for Orchestration: Check the box to enable change control for orchestration for ACI fabrics. The orchestration options are not supported for NX-OS fabrics.
The following options become available if you check the Enable for Orchestration option:
-
Required number of approvers: Enter the number of approvers required for change control tickets. Default is 1 approver.
-
Allow self approval: This field is enabled by default. Check the box to allow users who select or create a change control ticket for an action to also approve that change control ticket.
-
-
Enable for ND Managed Fabrics: Check the box to enable change control for Nexus Dashboard-managed fabrics.
The following options become available if you check the Enable for ND Managed Fabrics option:
-
Enable bypass change control for telemetry: Check the box to enable bypass change control for telemetry.
If there are any system-triggered changes to configuration settings related to telemetry, a ticket approval or deployment process is not required, as these changes will be automatically approved and deployed if the Enable bypass change control for telemetry option is enabled.
You can also disable Enable bypass change control for telemetry option, if you want to create a ticket to approve/deploy. The disable option will not work for colocation fabrics.
-
Ticket name prefix: Change the Ticket ID prefix string from the default
TICKET_, if necessary. See [Configuring the Auto Generated Ticket ID] for more information.
-
-
-
Click Save.
Once you have enabled the change control feature, all areas that are supported with change control are now tracked with a ticket. See [Guidelines and Limitations: Change Control] for a list of areas that are tracked with a ticket when change control is enabled, and see [Typical Change Control Workflow] to understand how having the change control feature enabled affects the Nexus Dashboard operations that are supported with change control.
You can return to the Fabric Management page to disable the change control feature; however, disabling the change control feature after you have enabled it is not supported when active tickets (works in progress) are detected. You must complete the change control process on any active tickets before you can disable the change control feature in this case.
Once you have successfully disabled the change control feature, the change operations will no longer be tracked with change control tickets. Completed tickets and associated data remains, but you cannot perform any actions against those areas.
Event analytics
To enable the event analytics feature:
-
Navigate to the Fabric Management page in Nexus Dashboard:
Admin > System Settings > Fabric Management
-
Locate the Event analytics feature box in the Fabric Management page and click Edit in that box.
Events
This tab displays the events that are generated for the switches. You can select one or more events and then acknowledge or unacknowledge their status using the Change Status drop-down list. In addition, you can select one or more alarms and then click the Delete button to delete them. If you want to delete all events, click the Delete All button.
The following table describes the fields that appear on Analyze > Event Analytics > Events.
| Field | Description |
|---|---|
|
Group |
Specifies the Fabric |
|
Switch |
Specifies the hostname of the switch |
|
Severity |
Specifies the severity of the event |
|
Facility |
Specifies the process that creates the events. The event facility includes two categories: Nexus Dashboard and syslog facility. Nexus Dashboard facility represents events generated by Nexus Dashboard internal services and SNMP traps generated by switches. Syslog facility represents the machine process that created the syslog messages. |
|
Type |
Specifies how the switch/fabric are managed |
|
Count |
Specifies the number of times the event has occurred |
|
Creation Time |
Specifies the time when the event was created |
|
Last Seen |
Specifies the time when the event was run last |
|
Description |
Specifies the description provided for the event |
The following table describes the action items in the Actions menu drop-down list that appear in Events.
| Action Item | Description |
|---|---|
|
Acknowledge |
Select one or more events from the table and choose Acknowledge icon to acknowledge the event information for the fabric. After you acknowledge the event for a fabric, the acknowledge icon is displayed in the Ack column next to the Group. |
|
Unacknowledge |
Select one or more events from the table and choose Unacknowledge icon to acknowledge the event information for the fabric. |
|
Delete |
Select an event and choose *Delete*to delete the event. |
|
Add Suppressor |
Select an event and choose Add Suppressor to add a rule to the event. You can provide name to the rule. Using the Scope options, you can add this rule to all the Fabrics, or particular elements or all elements. |
Setting Up Events
To setup an event using the Cisco Nexus Dashboard Web UI, perform the following steps:
-
Click Receiver.
The Receiver tab displays the following details:
-
Syslog Receiver enabled: Displays the status of the syslog server.
-
SNMP Trap Receiver: Displays the details of SNMP traps received, processed and dropped.
-
Syslog Receiver: Displays the details of syslog messages received, processed and dropped.
-
Ensure that you allow access to the SMTP service from the cisco-ndfc-dcnm-syslog-trap interface for forwarding of event email notifications. The cisco-ndfc-dcnm-syslog-trap interface also provides access to the switches for SNMP queries. For more information, see the section "Nexus Dashboard persistent IP addresses" in Cisco Nexus Dashboard Deployment and Upgrade Guide.
-
The cisco-ndfc-dcnm-syslog-trap interface also provides access to the switches for SNMP. Ensure that you allow access to the SNMP destination port 161 on the switches for the cisco-ndfc-dcnm-syslog-trap interface. For more information, see the section “Communication Ports for LAN deployments in Cisco Nexus Dashboard Deployment and Upgrade Guide.
-
-
-
Click the Sources tab to view a list of fabrics and their associated switches.
The Sources tab displays all the fabrics and the associated switches in tabular format. It also displays if traps and syslogs have been configured on the switches.
-
Perform the following steps to create rules for forwarding email notifications or traps for events:
Cisco Nexus Dashboard Web UI forwards fabric events through email or SNMPv1 or SNMPv2c traps. Some SMTP servers require SMTP authentication parameters, while others do not support or require SMTP AUTH. Enable SMTP authentication in Nexus Dashboard only when the target SMTP server requires it. If SMTP authentication is enabled for a server that does not require or support it, event email notifications can fail to be delivered.
-
Ensure that you have configured SMTP parameters before configuring rules for forwarding event notifications through emails.
To verify SMTP configuration, navigate to Admin > System Settings > General > Email and verify that you have configured the required fields.
-
To configure rules, click the Forwarding tab and choose Actions > Add Rule and configure the fields as described in the following table.
Configure Rules Field Description Forwarding Method
Chooose one of the forwarding methods:
-
E-Mail
-
Trap
Email Address
This field appears if you select E-mail as the forwarding method.
Enter an email address for forwarding the event notifications.
Fabric
Select All LAN Groups or a specific fabric for notification.
Source
Select NDFC or Syslog. If you select DCNM, do the following:
-
From the Type drop-down list, choose an event type.
-
Check the Storage Ports Only check box to select only the storage ports. This check box is enabled only for port related events.
If you select Syslog, do the following:
-
In the Facility list, select the syslog facility.
-
In the Type field, enter the syslog type.
-
In the Description Regex field, enter a description that matches with the event description.
-
-
From the Minimum Severity drop-down list, select the severity level of the messages to receive.
The traps that are transmitted by Cisco Nexus Dashboard correspond to the severity type. A text description is also provided with the severity type.
trap type(s) = 40990 (emergency) 40991 (alert) 40992 (critical) 40993 (error) 40994 (warning) 40995 (notice) 40996 (info) 40997 (debug) textDescriptionOid = 1, 3, 6, 1, 4, 1, 9, 9, 40999, 1, 1, 3, 0 -
Click Add Rule.
-
-
Perform the following steps to create rules for suppressing events:
Nexus Dashboard allows you to suppress specified events based on user-specified rules. Such events will not be displayed on the Nexus Dashboard Web UI and client. The events will neither be added to the Nexus Dashboard database, nor forwarded via email or as SNMP traps.
You can view, add, modify, and delete rules from the table. You can create a rule from the existing events. Select an existing event as the template and open the Add Rule window by navigating to Events page, select the event and choose Actions > Add Suppressor. The details are automatically ported from the selected event in the events table to the fields of the Add Rule window.
-
In the Name field, enter a name for the rule.
-
In the Scope field, select one of the following options - SAN, Port Groups or Any.
In the Scope field, the LAN/SAN groups and the port groups are listed separately. For SAN and LAN, select the scope of the event at the fabric or group or switch level. You can only select groups for port group scope. If use select Any as the scope, the suppression rule is applied globally.
-
In the Facility field, enter the name or choose from the SAN/LAN switch event facility list.
If you do not specify a facility, a wildcard is applied.
-
In the Type field, enter the event type.
If you do not specify the event type, wildcard is applied.
-
In the Description Matching field, specify a matching string or regular expression.
The rule matching engine uses regular expression that is supported by Java Pattern class to find a match against an event description text.
-
Check the Active Between check box and select a valid time range during which the event is suppressed.
By default, the time range is not enabled.
In general, you must not suppress accounting events. Suppression rule for Accounting events can be created only for certain situations where accounting events are generated by actions of Nexus Dashboard or switch software. For example, 'sync-snmp-password' AAA syslog events are automatically generated during the password synchronization between Nexus Dashboard and managed switches. To suppress accounting events, navigate to the Events page, select the event and choose Actions > Add Suppressor.
-
Click Add Rule.
-
Multi-cluster connectivity
Use the Multi-cluster connectivity page to connect to another Nexus Dashboard cluster for a single pane of glass view into all cluster’s fabrics and services.
You might use multi-cluster connectivity in several situations, such as:
-
Connecting Nexus Dashboard clusters. See Connecting Nexus Dashboard clusters for more information.
-
Connecting APIC clusters. See [Connecting APIC clusters] for more information.
-
Configuring a primary cluster as the default authentication domain. See the section "Configure primary cluster as the default authentication domain" in Configuring Users, Roles, and Security for more information.
Connecting Nexus Dashboard clusters
These sections provide the necessary information to connect Nexus Dashboard clusters:
Guidelines and limitations: Nexus Dashboard cluster connectivity
The following guidelines apply when configuring Nexus Dashboard multi-cluster connectivity:
-
Only users with a Fabric Administrator role and the
allsecurity domain access can add and delete Nexus Dashboard clusters. See Configuring Users and Security for more information. -
When configuring multi-cluster connectivity in Nexus Dashboard 4.1.1, you can only connect clusters running on Nexus Dashboard 4.1.1 and later. If any cluster that is part of the multi-cluster connectivity configuration is running on Nexus Dashboard 4.1.1, the other clusters in that multi-cluster connectivity configuration must also be running on Nexus Dashboard 4.1.1 or later.
-
For supported scale limits, such as number of clusters that can be connected together and number of fabrics across all clusters, see the Nexus Dashboard Release Notes for your release.
-
Connectivity (HTTPS) must be established between the management interfaces of all the nodes of all the clusters, which will be connected via multi-cluster connectivity.
-
When onboarding multiple fabrics to a Nexus dashboard cluster (single or multi-cluster federation), the user-assigned fabric name of each fabric onboarded must be unique across the cluster(s). You cannot reuse the same fabric name for different physical fabrics.
Duplicate fabric names across different clusters may result in DNS resolution failures.
-
If you have multiple Nexus Dashboard clusters with the same physical fabric onboarded to each, and you want to establish multi-cluster connectivity between them, the user-assigned fabric name on both clusters must match. If the fabric names differ, the multi-cluster connectivity configuration will fail and return an error.
For example, if "ND-Cluster1" is providing telemetry services to an ACI fabric referenced as “ACI1”, and a separate "ND-Cluster2" is providing orchestration services to the same ACI fabric but references it as “ACI-01”, the multi-cluster connection attempt between the two clusters will fail and return an error.
-
You can create Nexus Dashboard fabrics on any cluster within the federation; however, fabric names must be unique across the entire federation, including both newly created and onboarded fabrics. All fabric objects are synchronized and available across the federation.
-
The primary cluster, which you use to establish multi-cluster connectivity, must be running the same or a later release of Nexus Dashboard than any other cluster in the group.
In other words, you cannot connect a Nexus Dashboard cluster running release 2.3.1 from a primary cluster that is running release 3.0.1.
-
Multi-cluster connectivity between SAN and LAN clusters is not supported. You can only connect clusters of the same network type.
-
If you are upgrading multiple clusters that are connected together, you must upgrade the primary cluster first.
-
From any cluster in the connected clusters group, you can view other clusters only if they are running the same or earlier version of Nexus Dashboard.
In other words, if
cluster1is running release 2.3.1 andcluster2is running release 2.2.1, you can viewcluster2fromcluster1but not vice versa.
-
You can either use the primary cluster as an authentication domain, see the "Multi-cluster primary as an authentication domain" section in Configuring Users and Security, or you can use a remote user.
If you connect multiple clusters but login to one of the clusters as a local
adminuser, you will only be able to view and manage the local cluster into which you logged in.To view and manage all clusters in the group, you must login as a remote user configured on all clusters.
Connect multiple Nexus Dashboard clusters
-
You must have familiarized yourself with the information provided in the [Guidelines and limitations] section.
-
You must have set up remote authentication and users on all clusters which you plan to connect.
Multi-Cluster connectivity is supported for remote users only, so you must configure the same remote user with
adminprivieleges for all clusters. For additional details, see the "Remote authentication" section in link:../articles-411/configuring-users-and-security.html [Configuring Users and Security].
To connect another cluster:
-
Log in to the Nexus Dashboard GUI of the cluster which you want to designate as the primary.
-
Add the second cluster.
-
From the main navigation menu, choose Admin > System Settings.
-
In the main pane, click Multi-cluster connectivity.
-
Click Connect Cluster.
-
In Select type, choose Nexus Dashboard.
-
Click Next.
You advance to the Settings step in the Connect Cluster workflow.
-
-
Provide the necessary cluster information.
-
In the information fields, provide the hostname or IP address and the authentication information for the cluster you are adding.
You only need to provide the management IP address of one of the nodes in the target cluster. Other nodes' information will be automatically synced after connectivity is established.
-
The user you provide must have administrative rights on the cluster you are adding. The user credentials are used once when you are first establishing connectivity to the additional cluster. After initial connectivity is established, all subsequent communication is done through secure keys. The secure keys are provisioned to each cluster while adding it to the group.
-
The cluster you are adding must not be part of an already existing group of clusters.
-
-
When you have entered all of the necessary configuration information, click Next.
You advance to the Summary step in the Connect Cluster workflow.
-
-
Verify all of the information that is shown in the summary page is correct.
-
If all of the information shown in the page looks correct, click Submit.
-
Repeat the procedure for any additional Nexus Dashboard cluster which you want to add to the group.
After multiple clusters are added to the group, you can see their status in the Cluster Configuration > Multi-cluster connectivity page.
Note that while you can view and manage any cluster from any other cluster as long as they are part of the same multi-cluster group, you can only add and remove clusters from the group when viewing the
primarycluster.
The Multi-cluster connectivity page displays all clusters that are part of the multi-cluster group. The Connect Cluster button is shown only when viewing the primary cluster. To modify the cluster group, you need to navigate to the primary cluster, at which point the Connect Cluster button becomes available:
-
The Cluster: <name> dropdown in the main navigation menu shows the cluster you are currently viewing.
You can select a different cluster from this dropdown, which opens a new page allowing you to navigate to another cluster in the same group.
While the 2.x releases of Nexus Dashboard allowed you to view and manage any cluster from any other cluster as long as they were part of the same multi-cluster group, relese 3.0.1 changed this behavior. You can now easily navigate between clusters by picking a specific cluster from the Cluster dropdown in the main navigation pane, but you cannot manage or configure another cluster directly from the one where you are logged in.
-
The
Primarylabel indicates the group’s primary cluster.You must be viewing this cluster to make any changes to the cluster group, such as adding or removing clusters.
-
The
Locallabel indicates the cluster you logged into.This is the cluster whose address is displayed in the browser’s URL field. If you navigate to a different cluster as mentioned above, the browser URL and the
Locallabel will not change. -
The
Connectivity Status: Shows the status of the uplink to the cluster. -
The
URLshows the list of IP adresses of the cluster. -
The Actions (
…) menu for each cluster allows you to Re-Register and Disconnect Cluster
-
-
The Connect Cluster allows you to add a new cluster.
Disconnect Nexus Dashboard clusters
To disconnect a cluster from an existing group:
-
Log in to the Nexus Dashboard GUI of the primary cluster.
Adding and removing clusters from the group must be done from the primary cluster.
-
From the main navigation menu, select Admin > System Settings.
-
In the main pane, select Multi-cluster connectivity.
-
From the Actions (
…) menu for the cluster you want to remove, select Disconnect Cluster. -
If the cluster status is still shown as
Upat this time, you will be given an option to forcefully remove the member. This option should be used only if previous removal attempts were unsuccessful. -
In the confirmation page, click Ok.
-
You can disconnect nodes from the multi-cluster group only through the main cluster. If the primary cluster is unavailable, then adding, editing, or removing nodes in a secondary cluster is not possible. To remove a secondary cluster from the group when the primary cluster is unavailable, you must use the
/api/v1/infra/clusters/<primary_cluster_name>/removeAPI call on the secondary cluster. For more information, see the API Reference.
-
In previous releases, a Delete Federation button was available to delete the federation from the primary cluster. This Delete Federation button is no longer available or necessary beginning with Nexus Dashboard release 4.1.1. Now, you can disconnect a Nexus Dashboard cluster from an existing group using the instructions provided in this section without having to delete federations using the Delete Federation button.
-
In previous releases, when you disconnected all member clusters, the primary cluster would also remove itself from a multi-cluster group. Beginning with Nexus Dashboard release 4.1.1, you must now manually remove the primary cluster from a multi-cluster group.
Connecting ACI clusters
These sections provide the necessary information to connect Cisco Application Centric Infrastructure (ACI) clusters:
Guidelines and limitations: ACI cluster connectivity
-
Even though you can have multiple Nexus Dashboard clusters with the same name, you cannot have a single ACI fabric in multiple Nexus Dashboard clusters if those clusters have the same name. For example, if you have two Nexus Dashboard clusters where both Nexus Dashboard clusters are named
nexus, you cannot add the same ACI fabric to both of thosenexusNexus Dashboard clusters. -
Only users with a Fabric Administrator role and the
allsecurity domain access can add and delete ACI clusters. See Configuring Users and Security for more information. -
When you onboard an ACI cluster to Nexus Dashboard, the APIC might detect previous Nexus Dashboard cluster registrations that conflict with your current local Nexus Dashboard cluster. This conflict can happen if a previous Nexus Dashboard cluster was registered with a node serial number or in-band IP address that matches one from your current local Nexus Dashboard cluster.
If you are unable to onboard an ACI cluster due to this issue, the system will return the names of all conflicting Nexus Dashboard clusters. This issue should resolve automatically when you onboard ACI through the Nexus Dashboard GUI using the procedures in Connect ACI clusters, where Nexus Dashboard will help to clean up conflicting ACI registrations. However, if the Nexus Dashboard GUI access is unavailable, use the following procedures to manually clean up conflicting APIC registrations.
For each cluster name returned, take action based on the applicable scenario:
-
The conflicting cluster is an active Nexus Dashboard cluster with an IP overlap with the current local Nexus Dashboard cluster, do one of the following:
-
if that Nexus Dashboard cluster does not need access to the ACI cluster, you can unregister the ACI cluster with that Nexus Dashboard cluster.
or
-
Redeploy the current Nexus Dashboard cluster with different in-band IP addresses.
-
-
The conflicting cluster is permanently inactive. This can happen if a cluster is re-deployed with a new cluster name without deleting its ACI fabrics first.
-
The conflicting cluster registration must be deleted from the ACI cluster using the following REST calls:
POST https://<APIC>/api/aaaLogin.json
payload:
{
    "aaaUser": {
        "attributes": {
            "name": "admin",
            "pwd": "myPassword"
        }
    }
}
The response body will contain a token. Pass this token as the Cookie header in the next request, using the key
Cookieand valueAPIC-Cookie=token. -
To delete each cluster:
DELETE https://<APIC>/api/mo/uni/userext/snclstr-<ND_CLUSTER_NAME_TO_BE_REMOVED>.json
-
-
-
Fabric connectivity must be already configured as described in the section "Fabric Connectivity" in the Cisco Nexus Dashboard and Services Deployment and Upgrade Guide.
-
EPG/L3Out for Nexus Dashboard data network IP connectivity must be already configured as described in the section "Fabric Connectivity" in the Cisco Nexus Dashboard and Services Deployment and Upgrade Guide.
-
IP connectivity from Nexus Dashboard to ACI cluster in-band IP over the data network must be already configured.
-
IP connectivity from Nexus Dashboard to the leaf nodes' and spine nodes' in-band IPs over the data network must be already configured.
Connect ACI clusters
To connect one or more Cisco ACI fabrics or clusters to your Nexus Dashboard:
-
Log in to the Nexus Dashboard GUI.
-
Add the ACI fabric or cluster.
-
From the main navigation menu, select Admin > System Settings.
-
In the main pane, select Multi-cluster connectivity.
-
Click Actions > Connect cluster.
The Connect Cluster page appears.
You are also redirected to this Connect Cluster page if you are creating an ACI fabric through Manage > Fabrics > Local > Create Fabric > Onboard ACI Fabric.
-
In the Select type page, choose ACI.
-
Click Next.
You advance to the Settings step in the Connect Cluster workflow.
-
-
Provide the necessary ACI fabric or cluster information.
-
Host Name/IP Address — Provide the IP address used to communicate with the Cisco ACI.
When providing the address, do not include the protocol (http:// or https://) as part of the URL string or fabric onboarding will fail.
-
User Name and Password — Login credentials for a user with admin privileges on the fabric you are adding.
-
(Optional) Login Domain — If you leave this field empty, the fabric’s local login is used.
-
(Optional) Validate peer certificate — Allows Nexus Dashboard to verify that the certificates of hosts to which it connects (such as fabric controllers) are valid and are signed by a trusted Certificate Authority (CA).
You must have the certificate for this fabric already imported into your Nexus Dashboard before you can add a fabric using this option. If you have not yet added the certificates, cancel the onboarding workflow and follow the instructions described in the "Administrative Tasks" article in the Nexus Dashboard documentation library; then after you have imported the certificates, add the fabric as described here. If you enable the Verify Peer Certificate option but don’t import the valid certificate, fabric onboarding will fail.
-
-
When you have entered all of the necessary configuration information, click Next.
You advance to the Onboard fabric step in the Connect Cluster workflow.
-
Configure the parameters and capabilities of the ACI fabric.
Field Description Fabric Name
Enter a unique name for the fabric.
Location
Choose the location for the fabric.
License tier
Choose the licensing tier for the fabric:
-
Essentials
-
Advantage
-
Premier
Click on the information icon (i) next to License tier to see what functionality is enabled for each license tier.
Enable telemetry
Check the box to enable Telemetry for the fabric. This is the equivalent of enabling the Nexus Dashboard Insights service in previous releases.
Telemetry collection
This option becomes available if you choose to enable Telemetry in the Enabled features field above.
Choose either Out-of-band or In-band for telemetry collection.
Regardless of the option that you choose for telemetry collection, reachability to the ACI IP address must be through the Nexus Dashboard data interface.
Telemetry streaming
This option becomes available if you choose to enable Telemetry in the Enabled features field above.
Choose either IPv4 or IPv6 for telemetry streaming.
Security domain
Choose the security domain for the fabric.
-
-
When you have entered all of the necessary configuration information, click Next.
You advance to the Summary step in the Connect Cluster workflow.
-
Verify all of the information that is shown in the summary page is correct.
-
If all of the information shown in the page looks correct, click Connect.
-
Repeat the procedure for any additional ACI fabric or cluster which you want to add to the group.
After you have added all of the ACI fabrics or clusters to the group, you can see their status in the Admin > System Settings > Multi-cluster connectivity page. You can also cross-launch these onboarded ACI clusters from the Nexus Dashboard GUI by clicking on the onboarded ACI fabric through Manage > Fabrics in the Nexus Dashboard GUI, and then clicking on Open fabric in that ACI fabrics Overview page.
Beginning with Nexus Dashboard release 4.1.1, when you are in an ACI cluster that has been onboarded to Nexus Dashboard, if that ACI is running on release 6.1.4 or later, you can also cross-launch from that ACI’s GUI back to the Nexus Dashboard where it’s onboarded. For more information, see Nexus Dashboard cluster from APIC GUI.
Re-register clusters
If you upgrade your Nexus Dashboard from an earlier release to Nexus Dashboard release 4.1.1, after the Nexus Dashboard upgrade to release 4.1.1 is complete, you will have to re-register the onboarded ACIs to use the ACI-to-Nexus Dashboard cross-launch functionality introduced in Nexus Dashboard release 4.1.1.
To re-register clusters:
-
Navigate to Admin > System Settings > Multi-cluster connectivity.
-
Choose the appropriate ACI cluster, then click Actions > Re-register cluster.
Disconnect ACI clusters
To disconnect a cluster from an existing group:
-
Log in to the Nexus Dashboard GUI of the primary cluster.
Adding and removing clusters from the group must be done from the primary cluster.
-
From the main navigation menu, select Admin > System Settings.
-
In the main pane, select Multi-cluster connectivity.
-
From the Actions (
…) menu for the cluster you want to remove, select Disconnect Cluster -
If the cluster status is still shown as
Upat this time, you will be given an option to forcefully remove the member. This option should be used only if previous removal attempts were unsuccessful. -
In the confirmation page, click Ok.
-
You can disconnect nodes from the multi-cluster group only through the main cluster. If the primary cluster is unavailable, then adding, editing, or removing ACI fabrics onboarded in a secondary cluster is not possible. To remove a secondary cluster from the group when the primary cluster is unavailable, you must use the
/api/v1/infra/clusters/<primary_cluster_name>/removeAPI call on the secondary cluster. For more information, see the API Reference.
-
In previous releases, when you disconnected all member clusters, the primary cluster would also remove itself from a multi-cluster group. Beginning with Nexus Dashboard release 4.1.1, you must now manually remove the primary cluster from a multi-cluster group.
Flow collection
The Flow collection page under System Settings has these areas:
Flow collection mode
Enabling Flow Telemetry automatically activates Flow Telemetry Events. Whenever a compatible event takes place, an anomaly will be generated, and the What’s the impact? section in the Anomaly page will display the associated flows. You must manually configure a Flow Telemetry rule to acquire comprehensive end-to-end information about the troublesome flow.
These cards are available under Flow collection mode:
Traffic analytics
Use traffic analytics to automatically discover services and visualize flows based on Layer 4 ports, identifying congestion, latency, drops and more. Flow collection jobs are not supported on fabrics with out-of-band streaming.
You must disable Flow Telemetry at the fabric level for every fabric before you can modify these settings. Even though Flow Telemetry and Flow Telemetry Events are enabled at the fabric level, the settings are applied cluster-wide. See the editing fabric settings article for your fabric type for those procedures.
To enable traffic analytics:
-
Click Flow collection.
-
Click Traffic analytics under Flow collection mode.
Changing the Flow collection mode will erase all flow records previously collected on all fabrics. In the Change Flow collection mode popup, click Change and save.
For information, see Analyzing and Troubleshooting Your Network.
Flow telemetry
Follow these steps to configure flow collection modes.
-
Navigate to Admin > System Settings > Flow collection.
-
In the Flow collection mode area, choose Flow telemetry.
Flow rate status
Follow these steps to view the flow rate status.
-
Navigate to Admin > System Settings > Flow collection.
-
Review the upper-level information provided in the Flow rate status area.
Click the box next to the Flow rate status heading to change the time selection for flow rate status.
-
Click View all flow rate statistics to view all of the flow rate statistics.
Click the box next to the Flow rate statistics heading to change the time selection for flow rate statistics.
PTP
This section explains the functionality of the Precision Time Protocol (PTP).
Precision Time Protocols (PTP) is an industry-standard protocol used to synchronize clocks of multiple devices in a network with sub-microsecond accuracy. PTP is crucial in applications where time accuracy is critical and is designed to provide accurate time synchronization for devices in both local area networks (LANs) and wide area networks (WANs), including the Internet. PTP is a critical requirement for the telemetry functions of Nexus Dashboard to provide accurate metrics on latency, congestion and performance.
Properly configuring PTP on your system allows you to avoid having inaccurate traffic analytics monitoring, which might provide false alarms and false calculations of latencies. For this reason, you must enable PTP on the fabric before you can enable Flow telemetry or Traffic analytics under Admin > System Settings > Flow collection.
These sections give additional information on PTP:
Guidelines and limitations: PTP
-
PTP is required on any fabric where Nexus Dashboard monitors flow telemetry or traffic analytics.
-
Nexus Dashboard can monitor PTP configuration and telemetry for NX-OS fabrics only.
-
Nexus Dashboard strictly enforces a check for NX-OS fabrics. In order to enable flow telemetry or traffic analytics, you must enable PTP on the fabric. This check is enforced for the following fabric types:
-
Data Center VXLAN EVPN (with either iBGP or eBGP overlay routing protocol)
-
AI Data Center VXLAN
-
AI Routed
-
Classic LAN
-
Routed
-
-
Nexus Dashboard can monitor the status of PTP in NX-OS fabrics. The PTP status is visible in the Nexus Dashboard telemetry status page.
-
PTP monitoring through telemetry is supported in NX-OS release 9.3(7) and later.
-
Nexus Dashboard cannot monitor the status of PTP in ACI fabrics. Instead, only significant PTP correction events across the ACI fabric are detectable through APIC faults, which are then translated into Nexus Dashboard anomalies. In addition, for ACI fabrics, the PTP status is not visible in the Nexus Dashboard telemetry status page.
-
If you have a Nexus Dashboard running on release 3.2.x and you want to upgrade to Nexus Dashboard release 4.1.1:
-
If you have flow collection enabled without PTP also configured on your 3.2.1/3.2.2 system, when you upgrade to Nexus Dashboard release 4.1.1, the PTP data cannot be streamed correctly through telemetry until you properly configure and enable PTP on the physical fabric, either through the controller or manually.
-
If you do not have flow collection enabled on your 3.2.1/3.2.2 system, when you upgrade to Nexus Dashboard release 4.1.1, if you attempt to enable flow collection without also enabling PTP on your 4.1.1 system, you will see an error message and you will not be able to proceed until you properly configure and enable PTP.
-
Configure PTP
The procedures for configuring PTP differs, depending on the type of fabric being managed by Nexus Dashboard:
Configure PTP: NX-OS fabrics
To configure PTP in an NX-OS fabric:
-
Enable PTP at the fabric level.
-
Navigate to the main Fabrics window:
Manage > Fabrics
-
Locate the fabric that you want to edit.
-
Click the circle next to the fabric that you want to edit to select that fabric, then click Actions > Edit fabric settings.
The Edit fabric_name Settings window appears.
-
Click Fabric management > Advanced.
-
Locate the Enable Precision Time Protocol (PTP) field and click the checkbox.
This enables PTP across a fabric. When you check this check box, PTP is enabled globally and on core-facing interfaces.
-
Configure the associated PTP fields that became editable when you enabled the Enable Precision Time Protocol (PTP) option.
Field Description PTP Source Loopback Id
Specifies the loopback interface ID Loopback that is used as the Source IP Address for all PTP packets. The valid values range from 0 to 1023.
The PTP loopback ID cannot be the same as RP, Phantom RP, NVE, or MPLS loopback ID. Otherwise, an error will be generated. The PTP loopback ID can be the same as BGP loopback or user-defined loopback which is created from Nexus Dashboard.
If the PTP loopback ID is not found during Deploy Config, the following error is generated:
Loopback interface to use for PTP source IP is not found. Create PTP loopback interface on all the devices to enable PTP feature.
PTP Domain Id
Specifies the PTP domain ID on a single network. The valid values range from 2 to 127.
PTP Source VLAN Id
Specifies the SVI used for PTP source on ToRs. The valid values range from 2 to 3967.
-
Click Save to save the PTP configurations.
-
-
Enable PTP on the core-facing interfaces using the freeform config template.
We also recommend that you add the
ttag/ttag-stripentries to prevent any ttag frame drop in the core network. For more information, see the section "Enable freeform configurations on fabric switches" in Working with Inventory in Your Nexus Dashboard LAN or IPFM Fabrics.Following is an example configuration:
feature ptp
ptp source 100.100.100.10 // IP address of the loopback interface (loopback0) that is already created or user created loopback interface in the fabric settings
ptp domain 1 // PTP domain ID specified in fabric settings
interface Ethernet1/59 // Core facing interface ptp
interface Ethernet1/50 // Host facing interface
ttag
ttag-strip
-
Enable Flow telemetry or Traffic analytics at the system level and fabric level as you normally would.
-
At the system level:
-
Navigate to Admin > System Settings > Flow collection.
-
Enable Flow telemetry or Traffic analytics at the system level in this page.
See Analyzing and Troubleshooting Your Network for more information.
-
-
At the fabric level:
-
Navigate to Manage > Fabrics.
-
Choose the appropriate fabric and click Actions > Edit Fabric Settings.
-
Click Telemetry, then enable Flow telemetry or Traffic analytics at the fabric level and click Save.
See the editing fabric settings article for your fabric type for more information.
-
Once Flow telemetry or Traffic analytics is enabled, the switch will start streaming PTP information to Nexus Dashboard.
-
-
Review the PTP information provided in the Telemetry collection status page.
-
Click Manage > Fabrics.
-
Locate the fabric that you enabled PTP on and click that fabric.
The Overview page for that fabric appears.
-
In the General area, locate the Telemetry status field and click the status entry.
The Telemetry collection status page for that fabric appears, with the Fabric tab chosen by default.
PTP information will be displayed in the fabric’s Telemetry collection status page, such as the PTP status field, which will show In sync or Out of sync, and the PTP grand leader details, such as the switch in the fabric that is acting as the grand leader.
-
Click the Switches tab, click … > View details on a switch, then locate the PTP area to view PTP configuration information at the switch level.
-
If you configure the fabric with PTP using an internally-elected grand leader clock, you must also enable the ptp clock periodic-update configuration on the grand leader clock. This ensures that the hardware clock stays synchronized with the software clock. If you do not enable this configuration on the grand leader clock, then an anomaly will be triggered, as described below.
Configure PTP: ACI fabrics
Follow these steps to configure PTP in an ACI fabric.
If you plan to use the flow telemetry functions in Nexus Dashboard:
-
You must select Telemetry Priority in the ACI fabric node control policy.
In Cisco APIC, choose Fabric > Fabric Policies > Policies > Monitoring > Fabric Node Controls > <policy-name> > Feature Selection to select Telemetry Priority. Monitoring <policy-name> should be attached to Fabric > Fabric Policies > Switches > Leaf/Spine Switches > Profiles.
-
You must also enable Precision Time Protocol (PTP) on Cisco APIC so that Nexus Dashboard can correlate flows from multiple switches accordingly.
In Cisco APIC, choose System > System Settings > PTP and Latency Measurement > Admin State to enable PTP.
The quality of the time synchronization via PTP depends on the accuracy of the PTP Grandmaster (GM) clock which is the source of the clock, and the accuracy and the number of PTP devices such as ACI switches and IPN devices in between.
Although a PTP GM device is generally equipped with a GNSS/GPS source to achieve the nanosecond accuracy which is the standard requirement of PTP, microsecond accuracy is sufficient for Nexus Dashboard Insights and its flow telemetry, hence a GNSS/GPS source is typically not required.
For a single-pod ACI fabric, you can connect your PTP GM via leaf switches. Otherwise, one of the spine switches will be elected as a GM. For a multi-pod ACI fabric, you can connect your PTP GM via leaf switches or via IPN devices. Your IPN devices should be PTP boundary clocks or PTP transparent clocks so that ACI switch nodes can synchronize their clock across pods. To maintain the same degree of accuracy across pods, it is recommended to connect your PTP GM via IPN devices.
See the section "Precision Time Protocol" in the Cisco APIC System Management Configuration Guide for details about PTP connectivity options.
PTP-related anomalies
When either Traffic Analytics or Flow Telemetry are enabled for NX-OS fabrics, Nexus Dashboard monitors for PTP-related anomalies and will take the appropriate action, as described below.
-
When significant corrections occur in the fabric across switches, Nexus Dashboard will identify those corrections and will trigger an anomaly alert with the message
Ptp Clock High Correction. This alert will automatically clear if no high correction activity is detected during a continuous 20-minute period. The high correction threshold is set to 10000 nanoseconds. -
Nexus Dashboard will also trigger an anomaly if the switch clock and the Nexus Dashboard clock drift out of sync by 60 seconds or more, with the message
ND and Switch Clocks Not In Sync. This anomaly will automatically clear once the switch and the Nexus Dashboard clocks remain synchronized for a continuous 20-minute period. -
You must enable the
ptp clock periodic-updateconfiguration on the grand leader clock if you configure the fabric with PTP using an internally-elected grand leader clock, as described above. If you do not enable this configuration on the grand leader clock, then an anomaly will be triggered with the messagePtp Clock Missing Config.
For more information, see Detecting Anomalies and Identifying Advisories in Your Nexus Dashboard.