
New and Changed Information
The following table provides an overview of the significant changes up to this current release. The table does not provide an exhaustive list of all changes or of the new features up to this release.
| Release Version | Feature | Description |
|---|---|---|
|
Nexus Dashboard 4.1.1 |
Improved analysis and troubleshooting for your networks |
Beginning with Nexus Dashboard 4.1.1, the analysis and troubleshooting for your Nexus Dashboard networks has been enhanced. |
|
Nexus Dashboard 4.1.1 |
Policy CAM support for VXLAN iBGP and VXLAN external fabrics |
With this release, Nexus Dashboard Policy CAM feature is supported on VXLAN iBGP fabrics and VXLAN external fabrics. For more information, see Gathering fabric resource information using Policy CAM. |
|
Nexus Dashboard 4.1.1 |
Traffic analytics support for compatibility mode. |
You can choose to configure traffic analytics compatibility mode whenever traffic analytics full mode is not supported by the fabric. For more information, see Monitoring the latency, congestion, and drops for your network, using traffic analytics. |
|
Nexus Dashboard 4.1.1 |
Traffic analytics support for traffic redirection to L4-L7 services |
With this release, Nexus Dashboard added Traffic analytics support for traffic redirected to Layer 4 to Layer 7 (L4-L7) services. For more information, see View traffic analytics for endpoints. |
|
Nexus Dashboard 4.1.1 |
Traffic analytics support for north-south filters |
Beginning with Nexus Dashboard 4.1.1, you can apply filters to external interfaces. For more information, see Traffic analytics support for north-south filters. |
|
Nexus Dashboard 4.1.1 |
Traffic analytics support for UDP service endpoints |
You can now visualize the UDP service endpoints in the traffic analytics table. For more information, see Manage service categories. |
|
Nexus Dashboard 4.1.1 |
Endpoint Security Group (ESG) support for segmentation and security visibility |
With this release, Nexus Dashboard ESG enhances Segmentation and security, allowing you to view ESGs and their associated endpoints within the ACI fabric. For more information, see Viewing ESG and endpoint association. |
|
Nexus Dashboard 4.1.1 |
Traffic analytics flow troubleshoot feature supported over Out-of-band (OOB) |
With this release, Nexus Dashboard added support for traffic analytics flow troubleshoot feature supported over OOB. The flow troubleshoot support over OOB is only supported on NX-OS release 10.5(2) and later. |
Analyzing and troubleshooting your network using Analysis Hub
In the Analysis Hub area, you can analyze and troubleshoot your network using advanced analytics tools, which allows you to gain valuable insights into the performance and health of your network.
These sections provide more information on different ways that you can analyze and troubleshoot your network:
-
Defining communication and configuration rules using Compliance (ACI fabrics)
-
Understanding the hardware and software lifecycles for your network using Conformance
-
Monitoring the latency, congestion, and drops for your network using Traffic Analytics
-
Exploring the energy usage for your network using Sustainability
-
Comparing the configurations between two time periods for your fabric using Delta analysis
-
Viewing the impact of configuration changes using Pre-Change analysis (ACI fabrics)
-
Collecting and analyzing your device logs using Log Collector
-
Collecting information on bugs that might affect your network using Bug Scan
-
Tracking endpoints within a data center using Endpoint Locator (NX-OS fabrics)
Gathering fabric resource information using Policy CAM
The Policy CAM feature determines how and where resources in the fabric are used. Policy CAM provides information about the resource utilization in the network, and the amount of policy content-addressable memory (Policy CAM) utilization.
Navigate to Analyze > Analysis Hub > Policy CAM.
After you get to Policy CAM, choose a fabric, choose the appropriate snapshot of time within which to view the resource utilization, and click Apply.
With Nexus Dashboard 4.1.1, the Policy CAM feature is supported on VXLAN iBGP and VXLAN external fabrics in addition to ACI fabrics which were already supported in previous Nexus Dashboard releases. In the Nexus Dashboard UI, you can now view associations between Security groups, Contracts, and Filters on NX-OS switches. You can also view the rules created by each Contract and packet hit count for each rule on your fabric.
The Policy CAM feature for NX-OS fabrics requires the VXLAN Group Policy Option (GPO) security group configuration on your fabrics. For more information, see the "Working with security groups" section in Working with Segmentation and Security for Your Nexus Dashboard VXLAN Fabric. For VXLAN external fabrics, you must manually configure the security group configuration to see the Policy associations utilization in the Nexus Dashboard Analysis Hub UI.
The Policy CAM feature is supported on these platforms:
-
Cisco Nexus 9300-FX3, 9300-GX, and 9300-GX2 switches with NX-OS Release 10.4(3) and later releases.
-
Cisco Nexus 9000 FX/FX/H switches with NX-OS Release 10.5.2 and later releases.
-
Cisco Nexus 9000 C9408FX with NX-OS Release 10.5.1 and later releases.

There are some minor variations in how the latest snapshot report is generated for Cisco ACI and NX-OS fabric types:
-
In Cisco ACI fabrics, within the time range you choose, the last snapshot is considered for each of the fabrics included in the fabric. Therefore, you get the latest state of the application within the chosen time range.
-
In NX-OS fabrics, when you choose the time range, the report is based on the end time.
-
In NX-OS fabrics, the Resync button helps to detect any discrepancies between the NX-OS fabric and the intended configuration. This helps to make sure the latest policy changes are detected and reflected in the Nexus Dashboard UI.
-
TCAM utilization count for each policy is not supported for NX-OS fabrics in this release.
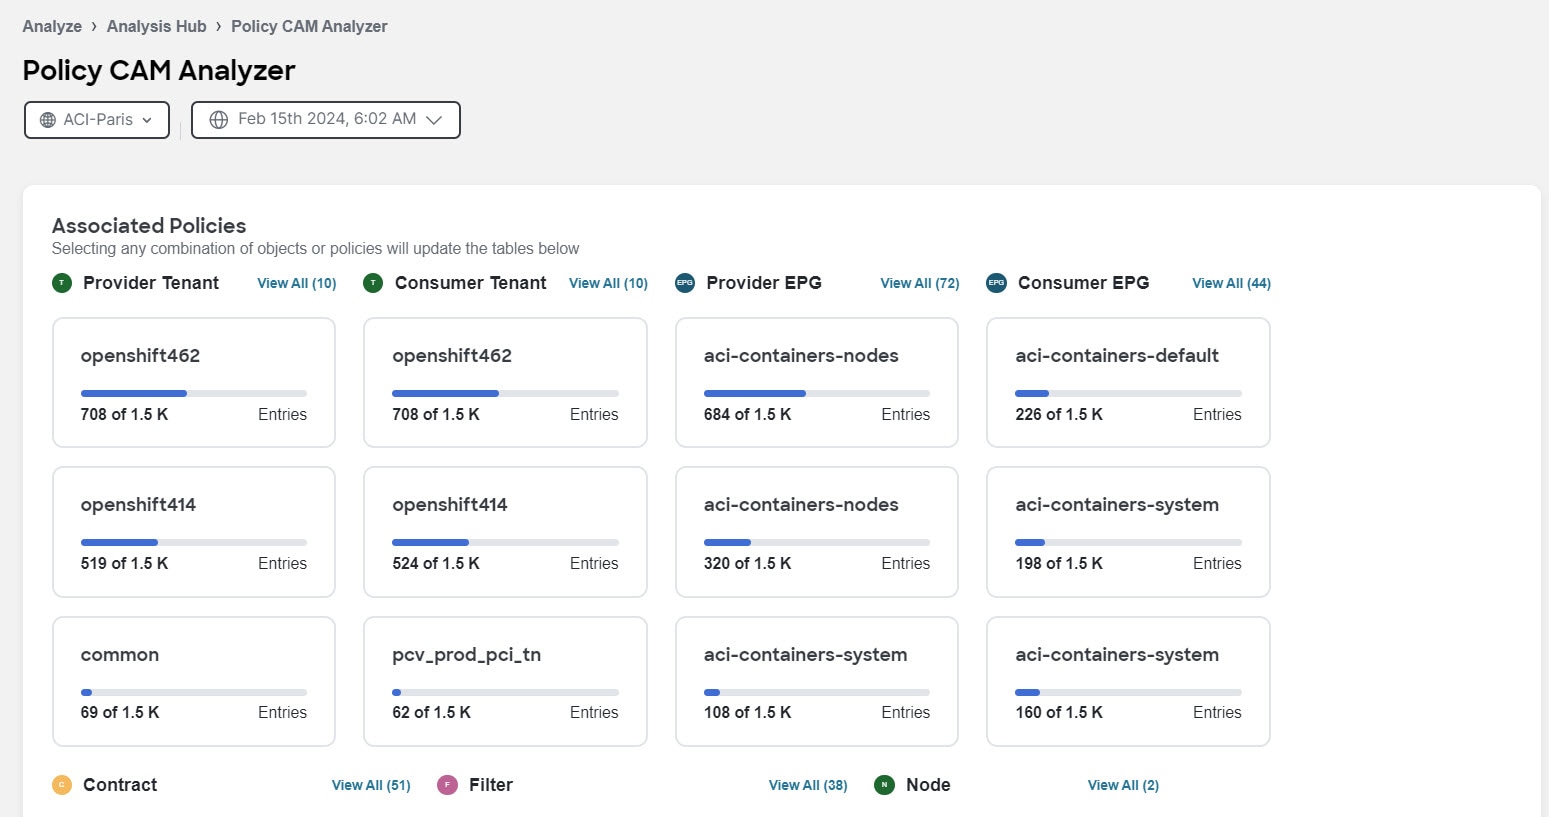
The Policy CAM Analyzer page for Cisco ACI fabrics displays the Associated Policies and Policy CAM Statistics.
Policy CAM Analyzer displays the following information:
-
Associated Policies
-
Policy CAM Statistics
-
Policy CAM Rules
-
All Anomalies
The All Anomalies information is not supported for NX-OS fabrics.
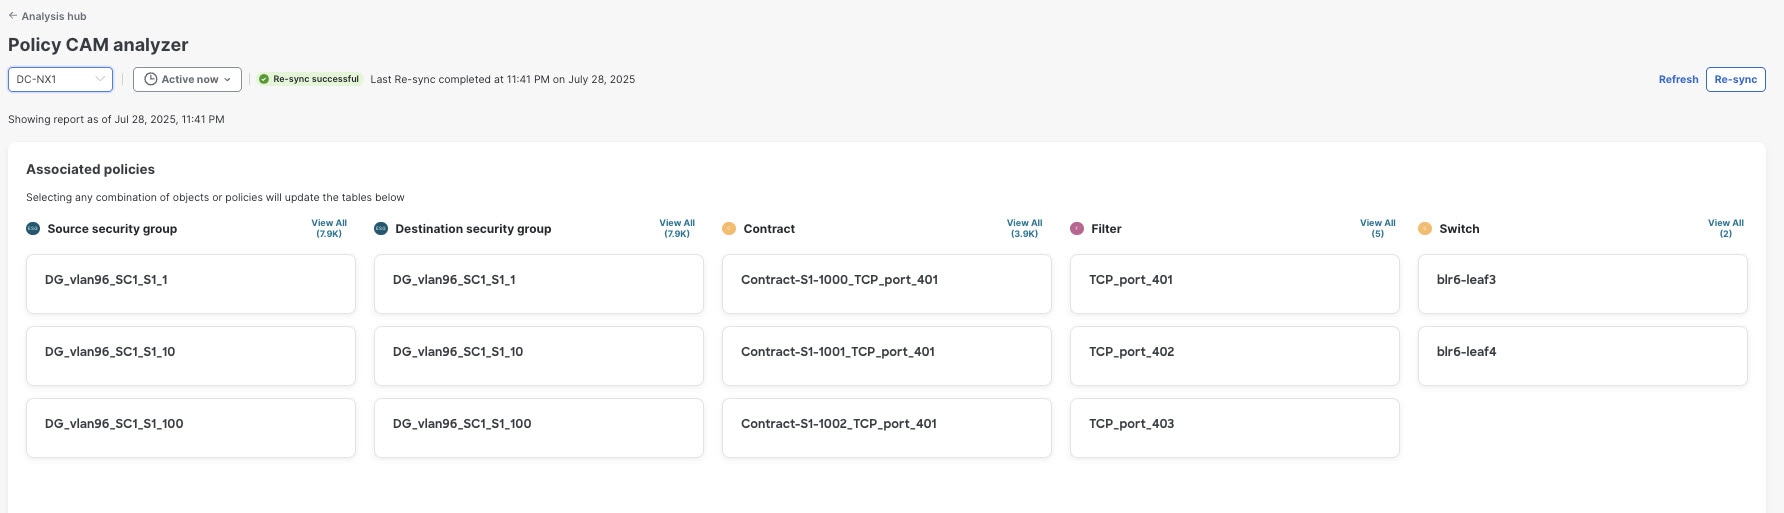
Associated policies
Associated policies lists the various objects or policies available. When the policies are viewed in a top to down manner, the lists start with the node that has the maximum utilization followed by the next lower utilization. For Cisco ACI fabrics, each item in each column can be chosen to show relevant associations and relationships between the tenants, contracts, and EPGs. Similarly, for NX-OS fabrics, these columns show the associations and relationships between the Security group, Contracts, and Filters.
Click View All to view all the nodes or switches for the chosen object in a side panel.
These objects or policies are available for fabrics.
-
Cisco ACI fabrics:
-
Provider Tenant
-
Consumer Tenant
-
Provider EPG
-
Consumer EPG
-
Contract
-
Filter
-
Node
-
-
NX-OS fabrics:
-
Source security group
-
Destination security group
-
Contract
-
Filter
-
Switch
-
Click any of the objects to show all related objects and policies.
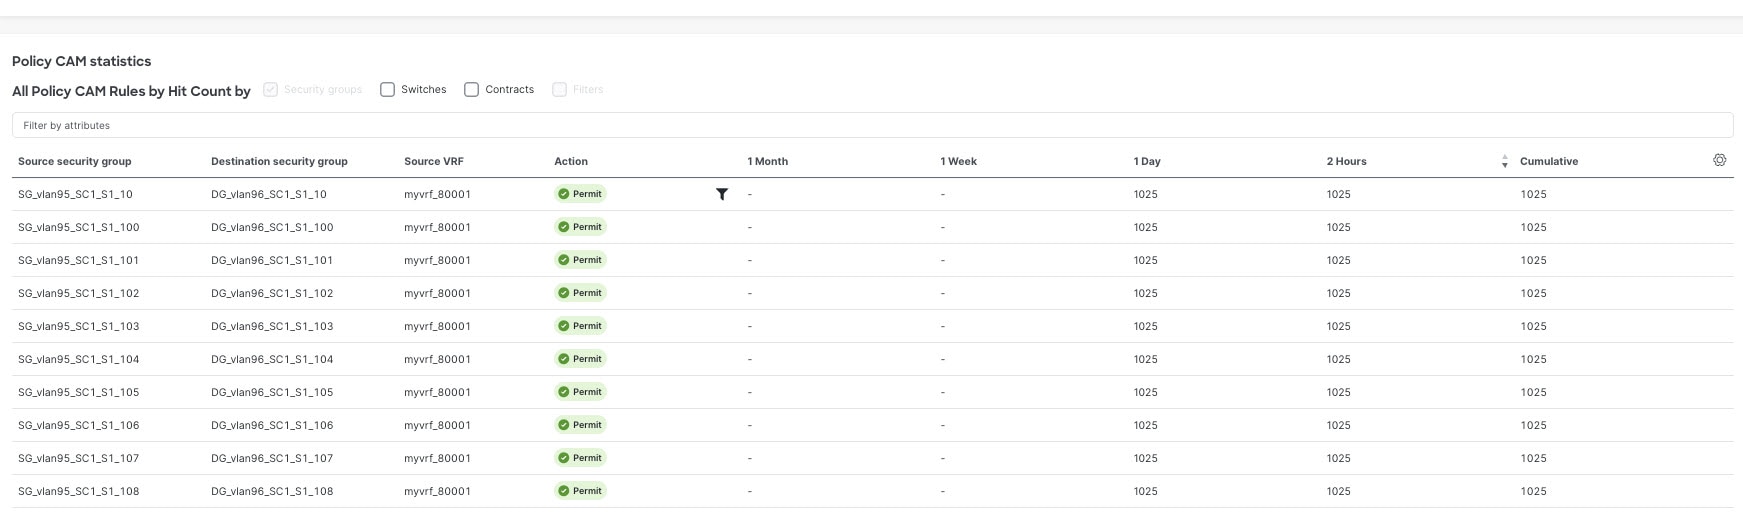
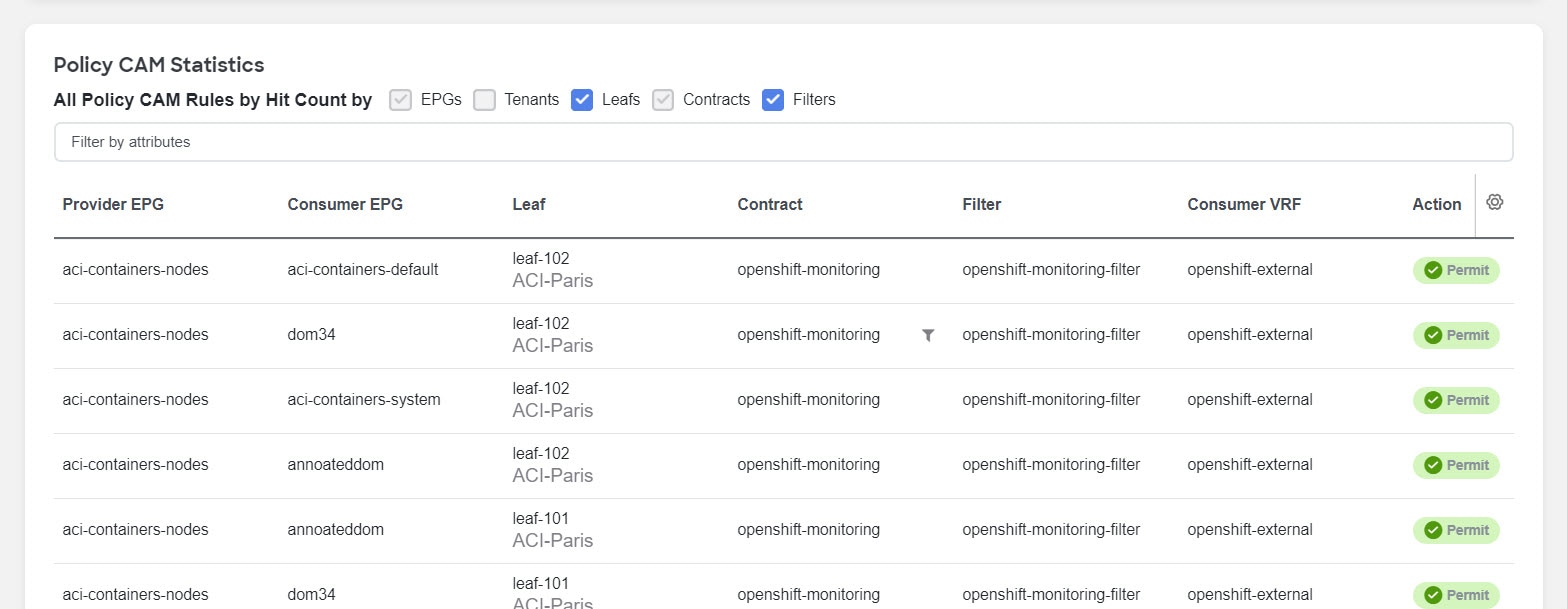
Policy CAM Statistics
The policy CAM statistics displays all the nodes and associated rules, and you can drill into details for a specific node here. Click the checkboxes for objects you want to see in the table.
These objects are available.
-
For Cisco ACI fabrics:
-
EPGs
-
Tenants
-
Leafs
-
Contracts
-
Filters
-
-
For NX-OS fabrics:
-
Security groups
-
Switches
-
Contracts
-
Filters
-
You can filter the table based on these attributes.
-
For Cisco ACI fabrics:
-
Provider EPG
-
Consumer EPG
-
Leaf
-
Contract
-
Filter
-
Consumer VRF
-
Action
-
-
For NX-OS fabrics:
-
Source security group
-
Source security group policy ID
-
Destination security group
-
Destination security group policy ID
-
Source VRF
-
Contract
-
Filter
-
Action
-
The table also shows the hit count in these timelines. * For Cisco ACI fabrics: 1 month 1 week 1 day Cumulative
-
For NX-OS fabrics:
-
1 month
-
1 week
-
1 day
-
2 hours
-
Cumulative
-
The gear icon allows you to toggle columns to customize the table as per your view.
Policy CAM Rules
In the Policy CAM Rules table, you can view the listings for all of the nodes based on the chosen snapshot.
You can filter the table based on these attributes.
-
For Cisco ACI fabrics:
-
Leaf
-
Provider EPG
-
Consumer EPG
-
Contract
-
Filter
-
Rule
-
Provider Tenant name
-
Consumer Tenant name
-
Consumer VRF
-
-
For NX-OS fabrics:
-
Source security group
-
Source security group policy ID
-
Destination security group
-
Destination security group policy ID
-
Source VRF
-
Switch
-
Contract
-
Filter
-
Rule
-
These details are available in the Rules table.
-
For Cisco ACI fabrics:
-
Leaf
-
Provider EPG
-
Consumer EPG
-
Contract
-
Filter
-
Rule
-
Valid Hardware Entry Count
-
Provider Tenant name
-
Consumer Tenant name
-
Consumer VRF
-
For NX-OS fabrics:
-
Source security group
-
Source security group policy ID
-
Destination security group
-
Destination security group policy ID
-
Source VRF
-
Switch
-
Contract
-
Filter
-
Rule
The gear icon allows you to toggle columns to customize the table as per your view.
All Anomalies
In the Anomalies table, you can view the anomalies that are generated in the chosen snapshot of time, individually by nodes or as an aggregate.
The Anomalies table is not supported on the NX-OS fabrics.
You can filter the anomalies based on the following attributes:
-
Anomaly Level
-
App Profile Name
-
Attachable Access Entity Profiles name
-
BD Name
-
Concrete Device
-
Concrete Interface
-
Consumer App Profile Name
-
Consumer EPG name
-
Contract
-
Contract Name
-
Device Cluster
-
Device Cluster Interface
-
Device Selection Policy
-
EPG name
-
Encap VLAN
-
Fabric IP
-
Filter name
-
Interface Policy Group Name
-
Internal/External
-
L2 Out Name
-
L3 Out Name
-
Leaf Interface Profile Name
-
Leaf Profile Name
-
Logical Interface Context
-
Physical Domains Name
-
Provider App Profile Name
-
Provider EPG Name
-
Provider Tenant Name
-
Rule Name
-
Fabrics
-
Spine Name
-
Tenant Name
-
Virtual Port Channel
Defining communication and configuration rules using Compliance (ACI fabrics)
Compliance allows you to define a set of rules to enforce your communication and configuration standards or expectations.
Navigate to Manage > Anomaly and Compliance Rules > Compliance Rules > Create Rule.
You can change the state of any rule after the rules have been created. If the rule is in the Enabled state, the rule will be used to generate the Compliance Report the next time it gets generated. If the rule is in Disabled state, it will not be used.
Go to Configure > Rules and enable or disable the specific rule from the Rule State column in the table. Click the Actions menu for the row and click Edit to open Edit Compliance Rule. In the State field, change the state to Enabled and click Save.
Types of compliance
There are two compliance types:
Communication
The Communication compliance type enables communication or isolation between network objects that meet business and regulatory purposes. To create a compliance communication rule, see Create compliance communication rule.
Communication Compliance consists of the following Compliance Rule Types:
-
Service Level Agreement (SLA) Compliance: You can set up rules for entities that must talk with other entities. You can use the Compliance feature to set up regulatory compliance rules.
-
Traffic Restriction Compliance: You can specify restrictions on protocols and ports for communication between objects.
-
Segmentation Compliance: You can establish walled areas around a set of entities that must not communicate with other entities.
Configuration
The Configuration compliance type enables and enforces the configuration to meet best practices and business requirements.
Configuration Compliance helps perform a configuration compliance check against a specified configuration.
Configuration compliance can be further classified into four types:
-
Snapshot Settings Compliance: This is similar to the configuration compliance check method but you also select a snapshot. With this method, you can make sure that certain attributes of objects are not changed when going from one snapshot to another snapshot. To create a compliance rule with snapshot selection, see Create compliance rule with snapshot selection.
-
Manual Configuration: You can configure this for certain objects such as BD, VRF, EPG, Contract, Subject, and Filter. All objects types are not supported. To create a compliance rule with manual configuration, see Create compliance rule with manual configuration.
-
Template based Compliance: With template-based compliance, you have the flexibility to select objects based on any attributes and provide different types of matching criteria that are not supported when you configure other compliance tasks. To create a template-based compliance, see Create template-based compliance.
Template-based compliance allows you to configure a template and specify types of queries to select objects and attributes that enforce specific conditions when enabled. The Template Query Language enables you to select any configurable object and define what attributes to apply to the compliance.
With other types of Compliance configurations releases you can upload a JSON/XML file and all the attributes in the file will be matched as is. Alternatively, you can also select a few specific objects based on name matches, and you can configure select attributes supported for those specific objects. This allows you to search for existing or future objects matching the names that are checked for compliance for the specified parameters.
-
Import Configuration Compliance: You can perform an import configuration against a specified configuration. You specify a configuration file or snapshot, and Nexus Dashboard continuously checks against it and enables you to identify changes for the objects and configurable attributes defined in Cisco APIC. If the configuration deviates from the specified configuration, then violations are raised. For each violation, there will be a separate violation anomaly displayed. Additionally, a single anomaly will be raised that includes every variable for every object of the tenant that is not a violation. To create an import configuration compliance, see [Create import configuration compliance].
Examples of compliance
-
Example of template-based compliance
-
The following is an example of a Template Based Configuration Compliance. In this example, choose all the contracts where name starts with Ctrct_(1-3). Then, match scope which must be context. Select contract subjects which have name as any (wildcard) and nameAlias must be ABC. The status MUST_EXIST means for all the parent nodes that exists, at least one of obj_type must exist. If a select is defined it should obey that condition.
{ "vzBrCP": { "attributes": { "STATUS": "MUST_EXIST", "SELECT(name)": "REGEX(Ctrct_[1-3])", "MATCH(scope)": "EXACT(context)" }, "children": [ { "vzSubj": { "attributes": { "SELECT(name)": "REGEX(.*)", "nameAlias": "ABC" }, "children": [ { "vzRsSubjFiltAtt": { "attributes": { "SELECT(tnVzFilterName)": "ENDS_WITH(3_1_1)", "MATCH(action)": "deny" } } } ] } } ] } } -
Does BD has a IPv4 subnet and an L3Out associated with it for specific tenants? This can be evaluated in the below template.
{ "fvTenant": { "attributes": { "SELECT(dn)": "OR(uni/tn-mgmt,uni/tn-tcam_comp_aepg_aepg,uni/tn-Corp102)" }, "children": [ { "fvBD": { "attributes": { "SELECT(name)": "REGEX(.*)" }, "children": [ { "fvSubnet": { "attributes": { "SELECT(ip)": "REGEX(^[A-Fa-f0-9]{1,4}\\:*)", "ctrl": "nd", "ipDPLearning": "enabled", "scope": "public" } } }, { "fvRsBDToOut": { "attributes": { "STATUS": "MUST_EXIST", "MATCH(tnL3extOutName)": "REGEX(L3Out_W02_[A-Za-z0-9])" } } }, { "fvRsCtx": { "attributes": { "MATCH(tnFvCtxName)": "REGEX(VRF_W02_[A-Za-z]*)", "STATUS": "MUST_NOT_EXIST" } } }, { "fvRsBDToNdP": { "attributes": { "STATUS": "MUST_EXIST" } } } ] } } ] } } -
EPG must not has a VMM Domain Configured. This can be evaluated in the below template.
{
    "fvTenant":
    {
        "attributes":
        {
            "SELECT(dn)": "STARTS_WITH(uni/tn-NAE_contract)"
        },
        "children":
        [
            {
                "fvAp":
                {
                    "attributes":
                    {
                        "SELECT(name)": "REGEX(.*)"
                    },
                    "children":
                    [
                        {
                            "fvAEPg":
                            {
                                "attributes":
                                {
                                    "floodOnEncap": "disabled",
                                    "hasMcastSource": "no",
                                    "MATCH(name)": "REGEX(^EPG_W02_[A-Za-z0-9_-]*)",
                                    "pcEnfPref": "unenforced",
                                    "prefGrMemb": "include",
                                    "MATCH(prio)": "REGEX(^level[0-9])",
                                    "shutdown": "no"
                                },
                                "children":
                                [
                                    {
                                        "fvRsDomAtt":
                                        {
                                            "attributes":
                                            {
                                                "instrImedcy": "lazy",
                                                "resImedcy": "pre-provision",
                                                "STATUS": "MUST_NOT_EXIST"
                                            },
                                            "children":
                                            [
                                                {
                                                    "fvAEPgLagPolAtt":
                                                    {
                                                        "attributes":
                                                        {
                                                            "annotation": ""
                                                        },
                                                        "children":
                                                        [
                                                            {
                                                                "fvRsVmmVSwitchEnhancedLagPol":
                                                                {
                                                                    "attributes":
                                                                    {
                                                                        "MATCH(tDn)": "ENDS_WITH(LACP_SDN)"
                                                                    }
                                                                }
                                                            }
                                                        ]
                                                    }
                                                }
                                            ]
                                        }
                                    }
                                ]
                            }
                        }
                    ]
                }
            }
        ]
    }
}
-
-
Invalid Example of template-based compliance
-
In the following invalid example, if there is a BD named ABCXYZ, it will be selected by both the child object templates snippets for fvBD. This is a violation because you cannot allow two SELECT criteria to coexist for the same object time because as can lead to two different ways of selection and validation of objects. So type can either be regular or fc.
-
{
  "fvTenant":
  {
    "attributes":
    {
      "SELECT(name)": "EXACT(tenantABC)"
    },
    "children":
    [
      {
        "fvBD":
        {
          "attributes":
          {
            "MATCH(type)": "EXACT(regular)",
            "SELECT(name)": "REGEX(.*ABC.*)"
          }
        }
      },
      {
        "fvBD":
        {
          "attributes":
          {
            "MATCH(type)": "EXACT(fc)",
            "SELECT(name)": "REGEX(.*XYZ.*)"
          }
        }
      }
    ]
  }
}
Compliance rules
Compliance rules are created to generate anomalies where compliance can be violated or satisfied. Once you create compliance rules, you can generate the Compliance Report to check how much the fabrics and networks align to the rules.
Click Manage > Anomaly and Compliance Rules > Compliance Rules. This is where all the created rules are listed. The Compliance Rules page allows you to view all the rules created in one place.
You can perform the following actions on this page:
-
Edit or Delete a rule with the "…" button
-
Select multiple rules by clicking the checkbox and delete/edit them collectively
-
Create a new rule from the Create Compliance Rule button.
-
Filter the rules using search by the following attributes:
-
Name
-
Description
-
Rule Type
-
State
-
Last Modified Time
-
-
Click on any rule to view the slide-in that brings up the rule summary. It displays the following information:
-
General - Rule description, Fabric, and State
-
Settings - Rule type, objects used to create the rule, and the configuration compliance rules used.
-
-
Actions allows you to edit, delete and disable the rule.
Interpretation of compliance rules
The following table lists some examples of compliance rules and what condition they create.
|
Compliance Rule |
Condition Created |
|
Contains EPGs in tenants with names that start with "a" or ending with "z" |
EPGs in tenants such as "abz" that satisfy both criteria are included only once. |
|
Contains EPGs in tenants with names that start with "a" and are also in VRF instances where the tenant is "xyz" and the VRF instance name contains "c" |
When an EPG under tenant "abc" that is in a VRF instance with DN uni/tn-xyz/ctx-abcde is selected, verify that both the tenant and the VRF instance criteria match. An EPG under tenant "abc" that is in a VRF instance with DN uni/tn-xyz1/ctx-abcde is not selected because the VRF instance tenant does not match. |
|
Contains all EPGs under tenants that begin with "a" except those that contain "d" |
An EPG under tenant "abc" is selected. An EPG under tenant "abcd" is not selected. |
|
Contains all EPGs under tenants that begin with "a" except those EPGs that are also in the VRF instance with DN uni/tn-rrr/ctx-sss |
An EPG under tenant "abc" that is in a VRF instance with DN uni/tn-rrr/ctx-sss is selected because the VRF instance tenant matches. |
Compliance analysis
The Actions button allows you to re run the analysis.
The Summary displays the number of violations, the top rules by anomaly count, the anomalies from violations and the violations by rule type. You can click on any of the rules in 'Top rules by Violation' to view more details and click the count under 'Number of anomalies from violations' to view the list of anomalies.
The Anomalies from Violations lists all the anomalies that were triggered by the rules created. Click any rule in the 'Grouped' view to see the list of anomalies categorized under that group. If you click any rule in the 'Ungrouped' view, you will be redirected to the compliance rule detail page. This can be listed in a group view for all fabrics or individual view for a specific fabric. The table lists the severity level of the anomaly, the type of rule that triggered the anomaly, the detection time, and the status.
When you click any rule, it takes you to a slide-in that gives you a summary of your rule ( What’s wrong, What triggered this anomaly, What’s the impact?, How do I fix it? ).
Use search to filter by attributes like App Profile Name, BD Name, Category, Compliance Object Name, Compliance Object Type, Contract Name, EPG Name, Filter Name, L2 Out Name, L3 Out Name, Level, Rule Name, Subject Name, Tenant Name, and VRF Name. The gear icon is used to customize the columns in the table.
The Compliance Rules table shows a summary of the rules enforced and violated along with the number for each rule type. The table lists all the rules used to generate the current report. The table specifies whether it’s a configuration rule or a communication rule and the number of anomalies from violations for each rule.
Use search to filter by attributes like Name, Rule Type, Enforcement Status, and Verified. The Create Compliance Rule button takes you to the rule creation page.
Compliance anomalies
In the UI, you specify your compliance rules and Nexus Dashboard will verify in the subsequent snapshots, whether the compliance rules are satisfied by the policy that is configured on Cisco APIC.
The number of anomalies raised is defined by the number of rules associated with a snapshot. For example, if an assurance group runs a compliance analysis on a snapshot every 15 minutes, and there are two rules associated with the snapshot, two anomalies will be raised.
Guidelines and limitations for compliance
Guidelines for compliance
-
A single compliance rule can be associated with multiple fabrics.
-
You can have a maximum of 30 active Communication Compliance rules and 600 active Configuration Compliance rules per fabric. If you exceed this limit, you cannot add more requirements in the Manage Compliance area.
-
When a compliance job is in progress for one or more fabrics, it is recommended that you do not start a bug scan for those fabrics.
-
Fabric list can be modified at any point in time.
-
Name of the rule is unique across fabrics.
-
Compliance is supported in the following Cisco APIC releases:
-
3.2(x) release
-
4.0(x) release
-
4.1(x) release
-
4.2(x) release
-
5.0(x) release
-
5.1(x) release
-
5.2(x) release
-
5.3(x) release
-
6.0(x) release
-
Guidelines for creating a compliance rule
-
When you create a compliance rule, you can add a custom description, which appears in the compliance violation anomaly.
-
Compliance Rules are created at the fabric level.
-
A compliance rule can either be offline or online.
Guidelines for import configuration compliance
-
You can check the box to allow addition of new configuration objects. This will raise a violation for every new object which is missing in the uploaded configuration file.
Guidelines for compliance rule naming
-
Name should be a minimum of three characters
-
Name should not include special characters
-
Name should be unique.
-
No two rules can have the same name.
Verified scalability guidelines for template-based compliance
-
Number of Template rules are 5 for APIC with total configurable objects of 150,000.
-
Each template selects 15,000 objects on an average.
-
Number of tenants per template is 30 tenants, with each tenant selecting 500 objects on an average.
-
You may create more than 5 templates (the upper limit is 30 total rules), if the total objects selected by all the templates are less than 5*15,000 and the total configurations in APIC are < 150,000 objects.
-
You can have a maximum of 30 active Communication Compliance rules and 600 active Configuration Compliance rules per fabric.
Guidelines for template-based compliance
-
The template follows the same structure as used in APIC files. It has objects, attributes, and children.
-
The template file size that you upload can be up to 15 MB including white spaces. Pretty JSON files will have white spaces to support indentation. To reduce the file size, you can remove white spaces and upload the file.
-
In a template, defining attributes is mandatory because the Compliance is applied on the attribute.
-
In a template, defining children is optional. If children are defined in the query, the selection is applied to the real children of the selected objects.
-
In a template, you can include the same object type only once per child array. This prevents the possibility of creating requirements that will result in conflicting compliance rules that result in violation anomalies.
-
A JSON file is currently supported. XML file is not supported.
-
The template file size that you upload can be up to 15 MB. The view feature will not be available if the file size is greater than 5 MB. If the file size is greater than 5 MB, you can download the file and view the contents.
Limitations for compliance analysis
-
No telemetry is available for offline analysis.
-
The compliance report is generated once every two hours.
Create compliance communication rule
-
Provide the name and description for your rule.
-
Select the fabrics you would like to apply the rule to.
You can pick one, or many, or all fabrics.
-
Choose to enable or disable the rule, then click Next.
-
In the Compliance Rule Type field, choose Communication.
-
Under Criteria, for the Communication Type field, choose the appropriate communication type. The options are Must Talk To, Must Not Talk To, May Talk To. The communication types are applied between two different object groups.
-
In the Object Type fields and the Traffic Selector area, choose the appropriate objects and traffic selector.
-
Select the appropriate criteria for both groups. Select any object type and the corresponding matching criteria object. See Matching criteria for the available object types and to understand how the various matching criteria objects can be defined.
-
After you define the criteria in the Add Criteria area, click the View Selected Objects link, and verify that the selected objects are appropriate. Based upon your selections of communication type and traffic selector rules, the compliance rule type that you defined will be displayed. See Communication compliance for more information about the communication types and the traffic selectors.
-
After you complete defining the objects, criteria, traffic restrictions as appropriate for your fabric/s, you can view the entire overview of the rule create and click Save Rule to complete the configuration.
-
When the rule is saved, you see the post success screen. You can choose to View compliance rules, View Compliance, or Create another Compliance rule from this page.
You can view/edit Direction based traffic settings from the Direction settings column.
Create compliance rule with snapshot selection
-
Under Compliance Rule Type, choose Configuration.
-
In the Base Configuration Settings field, choose Snapshot Settings.
-
In the Time of Snapshot field, choose the desired snapshot time, and click Apply.
When using offline datasets to save compliance rules, ensure the offline fabrics are configured with Premier. Offline datasets configured with Essentials result in an incorrect UUID value in the payload, preventing the rules from being saved. This issue is observed in Nexus Dashboard 4.1.1 and NDI 6.7.0 releases.
-
In New Rule, click Save. Nexus Dashboard starts performing a check.
-
To download the snapshot, click the Download link from Settings.
Import configuration compliance
-
Under Compliance Rule Type, choose Configuration.
-
In the Base Configuration Settings field, choose Import Configuration. You cannot edit the configuration rules when you upload a JSON/XML file. In such a case, after uploading a file, you can view or download it by navigating from Actions.
-
Drag and drop your file into the provided field to upload. Click Save.
Create compliance rule with manual configuration
-
Provide the name and description for your rule. You can choose to Enable or Disable state.
-
Choose the fabrics you would like to apply the rule to. You can pick one, or many, or all fabrics.
-
In the Compliance Rule Type field, choose Configuration.
-
In the Base Configuration Settings field, choose Manual Configuration.
-
Under Object Selection, select the Object Type and add the criteria as appropriate. You can also view the selected objects with the 'View Selected Objects' button. Select any object type and the corresponding matching criteria object. See Matching criteria for the available object types and to understand how the various matching criteria objects can be defined. See Manual configuration compliance for information about the attribute requirements.
-
Add the rules for the matching criteria selected above here. Click 'Add Rule' and select the Attribute, Operator and Value for the rule.
The name and name alias attribute requirement has an additional option to select Matches Regular Expression.
-
You can view the entire overview of the rule you want to create and click Save Rule. Nexus Dashboard to start performing a check based on the Naming compliance requirements that you specified.
-
When the rule is saved, you see the post success screen. You can choose to View compliance rules, View Compliance, or Create another Compliance rule from this page.
For BDs in context to VRFs, an extra requirement is needed. The EPG association requirement is to be added which requires an EPG association count. This can be equal to/at least/at most. However you can choose to add either the EPG Association Requirement or the Name and Attribute Requirement for BD. You cannot have all the attributes selected. See Manual configuration compliance.
Create template-based compliance
-
In the Base Configuration Settings field, choose Template Based Compliance.
-
In the Choose a file or drag and drop to upload area, upload your template based file.
-
After the file upload is complete, you can click the View icon to review the contents of the file that you uploaded.
-
Click Save.
For more information about template syntax, see Templates to configure object selectors. For information on how to configure object selectors for the template, see Templates to configure object selectors.
Trigger a compliance analysis
The Compliance Analysis will internally trigger assurance analysis and generate compliance anomalies.
-
Navigate to Analyze > Analysis Hub > Compliance.
-
Select a fabric from the dropdown menu.
-
Select the date for which you would like to see the report.
Templates to configure object selectors
When you create a configuration rule using manual configuration, only a few specific object selectors are supported (such as BD, EPG, VRF). By using a template, you can select any object and apply match criteria on its attributes.
An object can be any managed object from Cisco APIC, and its selection is based on the distinguished name of the object. If you prefer to have a different attribute as the selection criteria, you can use any valid attribute of that object. You can configure object selectors for selection and match criteria and based on tags and annotations.
Selection, status, and match criteria
For naming compliance, the compliance rules are on the name and nameAlias fields that are indicated by MATCH.
-
STATUS defines the state of the specific object in the template, whether an object exists or does not exist. The STATUS criteria can be defined using one of the following keywords.
-
MUST_EXIST
-
MUST_NOT_EXIST
The following is a syntax example:
{ "vzBrCP": { "attributes": { "STATUS": "(<status selected>)", "SELECT(name)":"<KEY_WORD>(<value>)", "MATCH(nameAlias/name)":"<KEY_WORD>(<value>)" } } } -
-
The SELECT and MATCH criteria can be defined using one of the following keywords. The MATCH criteria is used to define the Compliance rule. SELECT allows to define a criteria to select group of objects and MATCH allows to define attributes and values that those selected objects must have. These compliance rules will be applied on objects that are selected using the SELECT criteria.
-
STARTS_WITH
-
ENDS_WITH
-
EXACT
-
OR
-
REGEX
Syntax for SELECT:
SELECT(<attribute_name>): KEY_WORD(<value>)
Syntax for MATCH:
MATCH(<attribute_name>): KEY_WORD(<value>)
Attribute_name can be any attribute of the object. REGEX(<value>) - where the value must follow the standard regex expression syntax "SELECT(name)": "REGEX(Ctrct_[1-3])". For more details about keyword regular expressions, see Summary of Regular-Expressions Constructs.
The following is a syntax example:
{
   "<object>":
   {
      "attributes":
      {
         "SELECT(dn)":"<KEY_WORD>(<value>)",
         "MATCH(nameAlias/name)":"<KEY_WORD>(<value>)"
      }
   }
}
If SELECT is not specified for an attribute, then rn and dn will be considered as SELECT by default.
-
The following is a syntax example where if the KEY_WORD is not defined, the default behavior is EXACT. When you use MATCH(dn) and MATCH(rn), they are defined as match criteria.
If an attribute (other than dn and rn) does not have MATCH or SELECT specified, it will be considered as MATCH by default.
{
  "fvAEPg":
  {
    "attributes":
    {
      "SELECT(dn)": "uni/tn-aepg_vzanycons_imd_ctx_pass_7/ap-CTX1_AP1/epg-CTX1_BD1_AP1_EPG7",
      "MATCH(isAttrBasedEPg)": "EXACT(no)",
      "prio": "OR(unspecified, prio1)"
    }
  }
}
In the above example, by default, "prio" will be a MATCH.
Example template to configure a Naming Compliance to match selected objects to name or nameAlias:
{
   "vzSubj":
   {
      "attributes":
      {
         "SELECT(dn)":"EXACT(subj1)",
         "MATCH(nameAlias)":"STARTS_WITH(ABC)"
      }
   }
}
As the attribute dn is always considered as SELECT by default and any other attribute is always considered as MATCH, the above template can be simplified as displayed in the example below. Additionally, if the keyword is not defined, the default behavior is EXACT.
{
   "vzSubj":
   {
      "attributes":
      {
         "dn":"subj1""nameAlias":"STARTS_WITH(ABC)"
      }
   }
}
In the above template, you can use any object instead of "vzSubj", and you can use any attribute instead of "dn".
-
Template Syntax for {}
The following is a syntax example of a generic template where the KEY_WORD is {}. You can use this template to customize your requirements, select attributes, regular expresssions.
The KEY_WORD values can be as follows:
-
STARTS_WITH
-
ENDS_WITH
-
EXACT
-
OR
-
REGEX
{ "<MO type>": { "attributes": { "SELECT(<attribute>)": "KEY_WORD(<expression>)", "MATCH(<attribute>)": " KEY_WORD (<value>)" }, "children": [ { "<MO type>": { "attributes": { "SELECT(<attribute>)": " KEY_WORD (<value>)", "MATCH(<attribute>)": " KEY_WORD (<value>)" }, "children": [ { "<MO type>": { "attributes": { "SELECT((<attribute>)": " KEY_WORD (<value>)", "MATCH(<attribute>)": " KEY_WORD (<value>,<value>)" } } } ] } } ] } } -
-
Template With Attribute Value NULL or EMPTY
The following are examples of templates where the attribute value is null or empty.
"REGEX(^.{0}$)"
"EXACT()"
"OR(test, )" <— use space
{ "fvTenant": { "attributes": { "MATCH(annotation)": "OR(orchestrator:msc, )", "SELECT(name)": "REGEX(aepg_aepg_imd_tnt_pass_[0-9]+)", } } }
For the procedure to configure Object Selectors for Naming Compliance using the above template, see Create template-based compliance.
Tags and annotations
As an APIC user, you can create tags on managed objects (MOs) that result in creating child objects of type tagInst or tagAnnotation (based on which APIC version is in use).
Therefore, if you select objects based on a tag created in APIC, you can follow the templates provided in this section to configure object selectors on tags and annotations.
Example that displays the child object as type tagInst:
{
   "<object>":
   {
      "attributes":
      {
         "MATCH(<attribute_name>)":"<KEY_WORD(<value>)"
      },
      "children":
      [
         {
            "<tagInst>":
            {
               "attributes":
               {
                  "SELECT(<attribute_name>)":"<KEY_WORD(<value>)"
               }
            }
         }
      ]
   }
}
Example that displays the child object as type tagAnnotation:
{
   "<object>":
   {
      "attributes":
      {
         "MATCH(<attribute_name>)":"<KEY_WORD(<value>)"
      },
      "children":
      [
         {
            "<tagAnnotation>":
            {
               "attributes":
               {
                  "SELECT(<key or value>)":"<KEY_WORD(<value>)"
               }
            }
         }
      ]
   }
}
An object can be any valid APIC object with tagAnnotation or tagInst as a child. Object selection is defined in the tagInst or tagAnnotation object using SELECT on the name in the case of tagInst, and key or value in the case of tagAnnotation.
The selection criteria can be any of the following keywords:
-
STARTS_WITH
-
ENDS_WITH
-
EXACT
-
OR
-
REGEX
Compliance rules are defined at the parent object level using MATCH and the criteria can be defined using any KEY_WORD. tagInst or tagAnnotation do not participate in compliance rules as they only provide the selection criteria.
Example template where you SELECT all the fVBDs where the tag is “BDs_in_cisco”, and those BDs must have name as BD or app1BD.
{
   "fvBD":
   {
      "attributes":
      {
         "MATCH(name)":"OR(BD, app1BD)"
      },
      "children":
      [
         {
            "tagInst":
            {
               "attributes":
               {
                  "SELECT(name)":"EXACT(BDs_in_cisco)"
               }
            }
         }
      ]
   }
}
For the procedure to configure object selectors based on Tags and Annotations using a template, see Create template-based compliance.
When using the steps to Create template-based compliance, to configure object selectors for tags and annotations, you must perform an additional step. Before you click Save, in Create New Rule, you must check the checkbox for the field Enable Object Selection Based on tagAnnotation/tagInst. Therefore, if any object has a tag annotation or tagInst, the parent based on the selection criteria in these two objects will be selected.
Communication compliance
Communication types
-
Must Talk To: This allows you to configure objects where selector A must talk to objects selected by selector B under defined traffic restriction rules.
-
Must Not Talk To: Choose this configuration if your intention is that an object selected by object selector A must not talk to objects selected by object selector B using a defined type of traffic. The traffic restriction rule is optional in this configuration.
Two different types of communication compliances can be configured using this option:
-
Traffic Restriction compliance: You can specify a traffic selector rule that objects selected by selector A must not talk to objects selected by selector B, using a selected type of traffic that uses traffic restriction rules. This communication is restricted.
-
Segmentation compliance: By not defining a traffic selector rule, you can configure segmentation compliance where objects in selector A cannot talk to objects in selector B using any type of traffic. In this case, no traffic restriction rules are defined by you.
-
-
May Talk To: This allows you to create a traffic restriction compliance. Objects selected by selector A may talk to objects selected by selector B using only a specific type of traffic using traffic restriction rules.
As a Nexus Dashboard Insights user, to verify that EPG A can talk to EPG B using the traffic type TCP IP, configure the traffic restriction rule EPG A May Talk To EPG B using TCP IP.
Communication type and traffic selector rules selections with the resultant compliance rule type
| Communication Type | Select a Traffic Selector Rule? | Objects You Can Select | Compliance Requirement Type |
|---|---|---|---|
|
Must Talk To |
Mandatory to select |
EPG |
Service Level Agreement (SLA) |
|
Must Not Talk To |
Not mandatory to select |
|
|
|
May Talk To |
Mandatory to select |
EPG |
Traffic Restriction |
Traffic selector rules available
| Ether Type | Protocol Type |
|---|---|
|
ARP |
- |
|
FCOE |
- |
|
IP |
|
|
MAC_SECURITY |
- |
|
MPLS_UNICAST |
- |
|
TRILL |
- |
Manual configuration compliance
Attribute requirement that can be set according to the objects selected
| Object | Associated Attributes |
|---|---|
|
EPG |
The associated attributes are:
|
|
VRF |
The associated attributes are:
|
|
Bridge Domain (BD) |
The attributes are:
|
BD to EPG relationship configuration
With this feature, you can specify a BD selector to have a fixed number of EPGs. By configuring a BD compliance rule, you can set the maximum number of EPGs with which a BD can be associated.
As a result of this compliance rule, when the requirement set is not satisfied, a violation anomaly will be raised. If the requirement is satisfied, it will raise an enforcement anomaly. Only when the BD selector is not resolved, a warning anomaly will be generated.
The user can configure a requirement to verify that a specified number of EPGs are being associated with a BD. The supported operators for this requirement are At least /At most /Equal to. As an example, if a requirement is configured that the BD must have at least 5 EPGs associated, violation anomalies will be raised if the BD has less than 5 EPGs (0-4). However, if the BD has >= 5 anomalies, then an enforcement anomaly will be raised.
Matching criteria
Objects available as matching criteria for a selected object type
| Object Type | Matching Criteria Object |
|---|---|
|
EPG |
|
|
Tenant |
|
|
BD |
|
|
VRF |
|
|
Contract |
|
|
Subject |
|
|
Filter |
|
Define matching criteria objects
| Matching Criteria Object Type 1 | How to define |
|---|---|
|
Tenant |
tn - operator value Object type 2 (Could be either VRF or BD)
tn - operator value ctx - operator value
tn - operator value bd - operator value |
|
VRF |
tn - operator value ctx - operator value |
|
BD |
tn - operator value bd - operator value |
|
EPG |
tn - operator value ap - operator value epg - operator value |
|
App Profile |
tn - operator value ap - operator value |
|
L3 Out |
tn - operator value out - operator value |
|
L3 InstP |
tn - operator value out - operator value instp - operator value |
|
L2 Out |
tn - operator value l2out - operator value |
|
L2 InstP |
tn - operator value l2out - operator value instp - operator value |
|
Contract |
tn - operator value brc - operator value |
|
Subject |
tn - operator value brc - operator value subj - operator value |
|
Filter |
tn - operator value flt - operator value |
operator and value can be set to anything.
Operators for custom definitions
| Operator | Description |
|---|---|
|
Must Equal to |
This operator returns an exact match of the specified value. |
|
Must Not Equal to |
This operator returns all that do not have the same value. |
|
Must Contain |
This operator returns all that contain the specified value. |
|
Must not contain |
This operator returns all that do not contain the specified value. |
|
Must begin with |
This operator returns all that begin with the specified value. |
|
Must end with |
This operator returns all that end with the specified value. |
|
Must not begin with |
This operator returns all that do not begin with the specified value. |
|
Must not end with |
This operator returns all that do not end with the specified value. |
Understanding the hardware and software lifecycles for your network using Conformance
Conformance reports enable you to visualize and understand the lifecycle of your hardware and software in the network. This assists you in planning upgrades and hardware refresh. Conformance Report is generated everyday for each fabric for hardware and software conformance and weekly for each fabric for scale conformance. In the report you can view the conformance status of software, hardware, combination of both software and hardware, and scale conformance status for fabrics.
You can use Conformance Report to view current and project the future status of software and hardware inventory in your network against known EoS and EoL notices to ensure conformance. You can also monitor scale conformance status for onboarded fabrics.
Conformance Report displays the summary of conformance status for software, hardware, and scale for selected fabrics.
In the Conformance report, for hardware and software conformance switches are classified into 3 severities based on the software release or hardware platform EoL dates and end of PSIRT dates. The severities include:
The End of SW Maintenance Releases Date in the End-of-Sale and End-of-Life Announcement and the end of PSIRT date is used as reference milestone to classify the inventory into a category of Critical, Warning, or Healthy.
In the Conformance report, the scale conformance status for fabrics is based on Cisco’s Verified Scalability Guidelines for the software version running in switches and controllers when applicable. The severities include:
Access conformance report
Navigate to Analyze > Analysis Hub > Conformance.
Choose a fabric from the drop-down list.
OR
Navigate to Manage > Fabrics.
Choose a fabric.
In the General section, click Conformance.
Click View Report.
View conformance report
You can save conformance report as a PDF with the browser print option (Only supported on Chrome and Firefox).
-
Navigate to a Conformance Report. See Access conformance report.
-
Choose a fabric or All Fabrics from the drop-down menu.
-
Choose a current month or a previous month from the drop-down menu. You can choose a previous month only if previous month reports are available.
Conformance Report displays the conformance summary, hardware and software conformance, and scale conformance.
-
The Summary page displays devices by hardware conformance status, devices by software conformance status and scale conformance status for fabrics or switches. Click View Conformance Criteria to learn more.
-
The Hardware or Software page displays conformance status, conformance outlook, and device details.
-
In the Conformance Outlook section, click Overall, or Software, or Hardware to view the conformance for software and hardware, software only or hardware only.
-
The Device Details lists details for hardware and software.
-
The details for hardware include device name, fabric name, hardware conformance status, model, role, hardware end of vulnerability support for a particular device. Click the device name to view additional details.
-
The details for software include device name, fabric name, software conformance status, model, software version, role, software end of vulnerability support for a particular device. Click the device name to view additional details.
-
Use search to filter by attributes such as device, fabric, hardware conformance status, software conformance status, model, software version, and role.
-
Use the gear icon to customize the columns in the table.
-
-
The Scale page displays all fabrics summary, scale conformance, and scale metrics.
-
The All fabrics Summary section displays overall scale conformance level, top 5 switches by scalability metric violations, scalability metrics for controller and switches, and total scalability metrics violations.
-
Click View Conformance Criteria to learn more.
-
The Scale Conformance section displays the scale conformance for controller and switch in the last 6 months if the scale reports for previous months are available.
-
The All Scale Metrics section displays the scale metrics details for fabrics and switches. The All Scale Metrics section displays if you choose All Fabrics from the drop-down menu.
-
The details for fabrics include fabric name, type, software version, controller metrics conformance, switch metrics conformance. Click the fabric name to view additional details.
-
The details for switches include switch name, fabric name, software version, model, forward scale profile, metrics conformance. Click the switch name to view additional details.
-
Use search to filter by attributes such as fabric, type, software version.
-
Use the gear icon to customize the columns in the table.
-
-
The Fabric Level Scale Metrics and Switch Level Scale Metrics displays the scale metrics details for a fabric and switches associated with the fabric. These sections are displayed, if you choose one fabric from the drop-down menu.
-
The details for a fabric include metric, conformance status, and resource usage,
-
The details for switches include switch name, fabric name, software version, model, forward scale profile, metrics conformance. Click the switch name to view additional details.
-
-
-
From the Actions menu, click Run Report to run an on-demand report.
Analyzing endpoint flows using Connectivity Analysis
Connectivity Analysis allows you to analyze flows between two different endpoints, provide insight into how your endpoints are connected, and helps you spot where problems might be occurring. Starting with this release, connectivity analysis now includes multi-fabric capabilities.
Connectivity Analysis detects and isolates offending nodes in the network for a given flow and includes the following functionalities:
-
Traces all possible forwarding paths for a given flow across source to destination endpoints.
-
Identifies the offending device with issue, resulting in the flow drop.
-
Helps in troubleshooting by narrowing down the root cause of the issue, including running forwarding path checks, software and hardware state programming inconsistencies through consistency-checks, and further details related to packets walkthrough.
Connectivity Analysis options
-
Embedded Logic Analyzer Module (ELAM)--ELAM is a diagnostic tool that helps troubleshoot ethernet traffic flows. It captures the packet from an active flow and analyzes the ethernet frames for packet drops. ELAM requires an active flow between the source and destination hosts. You can enable this option to analyze an available active flow.
-
Operations, Administration, and Maintenance (OAM)--For standalone NX-OS fabrics, OAM is a protocol for monitoring and troubleshooting ethernet networks. You can enable this option to locate potential drops for active hosts or to track details such as reachability and probable route of the flow in a VXLAN EVPN-based fabric topology, without the need of active traffic between the hosts. OAM is supported only on VXLAN fabrics.
The OAM option is not available for NX-OS multi-fabric environments.
-
Consistency Checker—For standalone NX-OS fabrics, Consistency Checker ensures system consistency and aids in root cause analysis and fault isolation by verifying the alignment between software and hardware tables. These checks are performed within each switch between data plane and control plane for all the networking entities related to the chosen endpoint conversation. You can enable this option to detect control plane and data plane configuration and operational inconsistencies along the flow between specified endpoints or routes.
The checks performed by Connectivity Analysis include:
-
Topology checks such as overall health, connectivity of leaf switches, spine switches, or remote leaf switches
-
VRF instance and bridge domain mappings for endpoints
-
Interfaces connectivity such as PC, vPC, SVI, Breakouts, and SubIfs
-
Routing tables, EPM, and EPMC tables
-
L3Out information and mapping
-
Adjacency (ARP) tables
-
Tunnel information
-
Synthetic routes (COOP) tables on spine switches
Layer 2 ToR support
For standalone NX-OS fabrics, with Layer 2 ToR support, Connectivity Analysis offers the following capabilities:
-
Incorporate the device into the topology of a connectivity analysis job.
-
Provide detailed node-level flow information, including ingress interfaces and egress paths.
-
Initiate ELAM (Embedded Logic Analyzer Module) and capture packet details on ToR switches.
-
Conduct consistency-check validations on ToR switches.
Supported topologies
-
ToR switch with port channel directly connected to a leaf switch.
-
ToR switch connected to leaf switches in a vPC pair.
-
ToR switches with port channels connected to leaf switches individually. The leaf switches are in a vPC pair.
-
ToR switches in vPC with leaf switches along with ToR switches connected to hosts in a vPC pair.
Guidelines and limitations for all fabrics
-
You can submit up to 10 jobs.
-
At any point of time, you can run only 1 connectivity analysis job per fabric. You can stop a job in the queue and run another job.
-
You can run Connectivity Analysis only on online fabrics.
-
ELAM captures the VXLAN outer packet in multi-site fabrics for both ACI and NX-OS.
-
ELAM capture is not a part of the connectivity analysis process, hence it does not provide packet captures during connectivity analysis.
-
Nexus Dashboard supports only straight through FEXs. This support applies to connectivity analysis, flow telemetry, traffic analytics, and endpoint analytics.
-
Egress paths from transit fabrics to border gateway groups may not all appear green. This happens because ELAM can only capture a single packet at a time, showing just one active path. However, if ELAM is triggered at the border, an active path exists even if some paths from transit fabric to border switches appear grey.
-
Troubleshooting multi-fabric flows between ACI and standalone NX-OS fabrics is not supported.
Guidelines and limitations for Cisco ACI fabrics
-
Connectivity Analysis feature is supported on Cisco APIC release 6.0(2h) and Cisco ACI-Mode Switch release 16.0(2h) and later.
-
Cisco Nexus Insights Cloud Connector (NICC) app version 3.0.0.350 is pre-packaged with Cisco APIC release 6.0(2h) and is required for this feature.
If your ACI fabrics are running version of 6.1.2 or later and your Nexus Dashboard version is 3.2.1 or earlier, you will not be able to perform connectivity analysis.
-
Connectivity Analysis is not supported for endpoints where the bridge domain that they belong to is configured with Advertise Host Routes (Host Border Routes [HBR]).
-
Nexus Dashboard 4.1.1 does not support ESG functionality within Search and Explore, Connectivity Analysis, or Traffic Analytics/Flow Telemetry.
Guidelines and limitations for standalone NX-OS fabrics
-
Connectivity Analysis is supported on Cisco NX-OS release 9.3(7a) and later.
-
Connectivity Analysis job is not triggered if all onboarded devices are shown as incompatible.
-
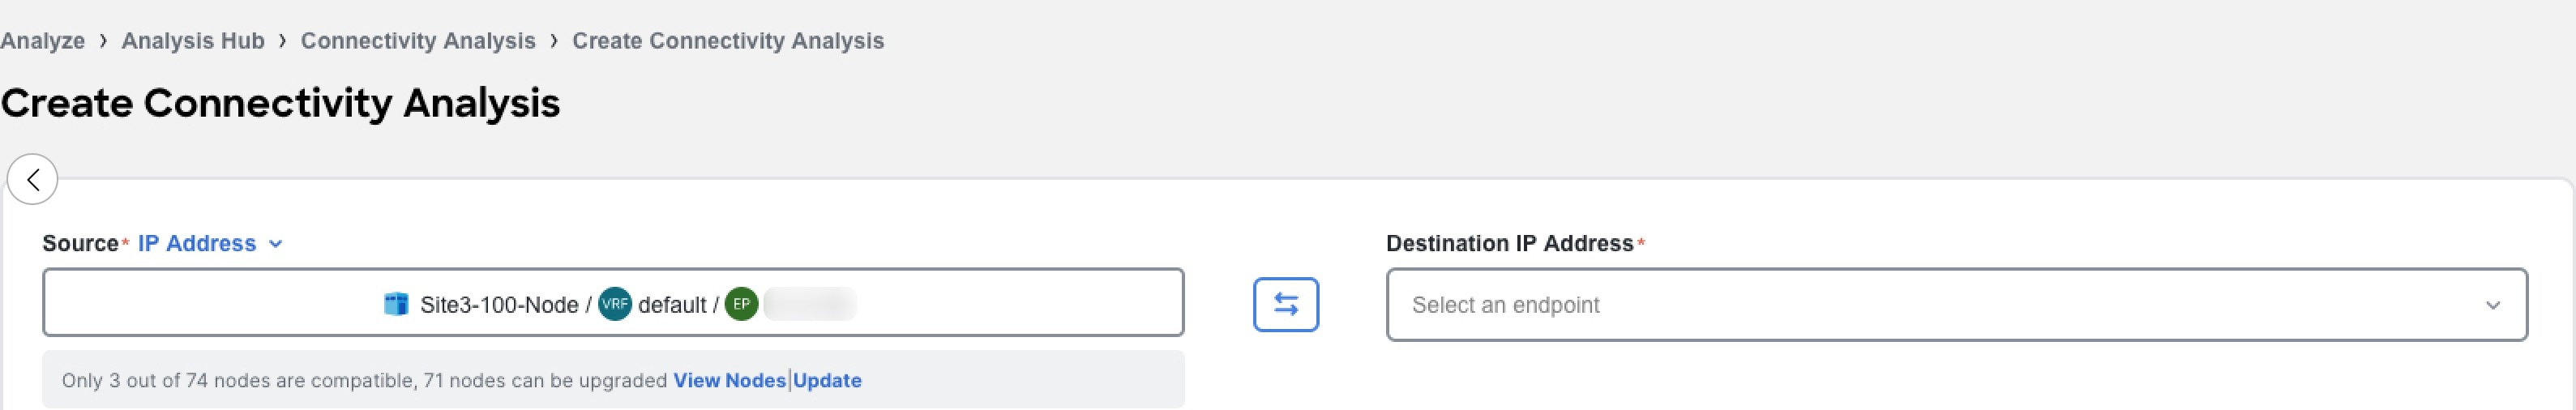
You must update the Fabric Agent on the switches to the latest available. Updating the Fabric Agent does not affect the traffic on the switch. Hence, a switch reload is not required. The View Nodes banner displays the number of nodes that are compatible and up-to-date. Click Update to initiate the update process. After the update is complete, in the Node page, click Refresh to view the status.
Fabric Agent updates are supported only through Nexus Dashboard. Manual updates directly on the switch are not supported and may lead to inconsistent agent states. This ensures consistent and reliable update management within the Nexus Dashboard environment.
-
OAM is only supported on VXLAN fabrics.
-
OAM is only supported between VTEPS and as a result the OAM path will be displayed between Layer 3 networks.
Supported topologies
-
Endpoint combinations:
-
EP-EP
-
EP-L3Out
-
L3Out-EP
-
L3Out-L3Out
-
-
Conversation types:
-
L2, L3, L4 (ICMP/TCP/UDP)
ICMP is not supported for ACI fabrics.
-
V4 and V6 support
-
Transit and Proxy flows
-
Shared Service
-
-
Topologies for Cisco ACI fabrics:
-
Single-Pod and Multi-Pod
-
ACI Multi-Site
-
Remote Leaf-Direct
-
M-Topology (stretched fabric design)
-
vPC
-
3-tier architectures
-
-
Topologies for standalone NX-OS fabrics:
-
VXLAN
-
VXLAN Multi-Site
-
vPC
-
Classic LAN
-
Create connectivity analysis
Follow these steps to create a connectivity analysis.
-
Navigate to Analyze > Analysis Hub > Connectivity.
-
Click Create Connectivity Analysis.
-
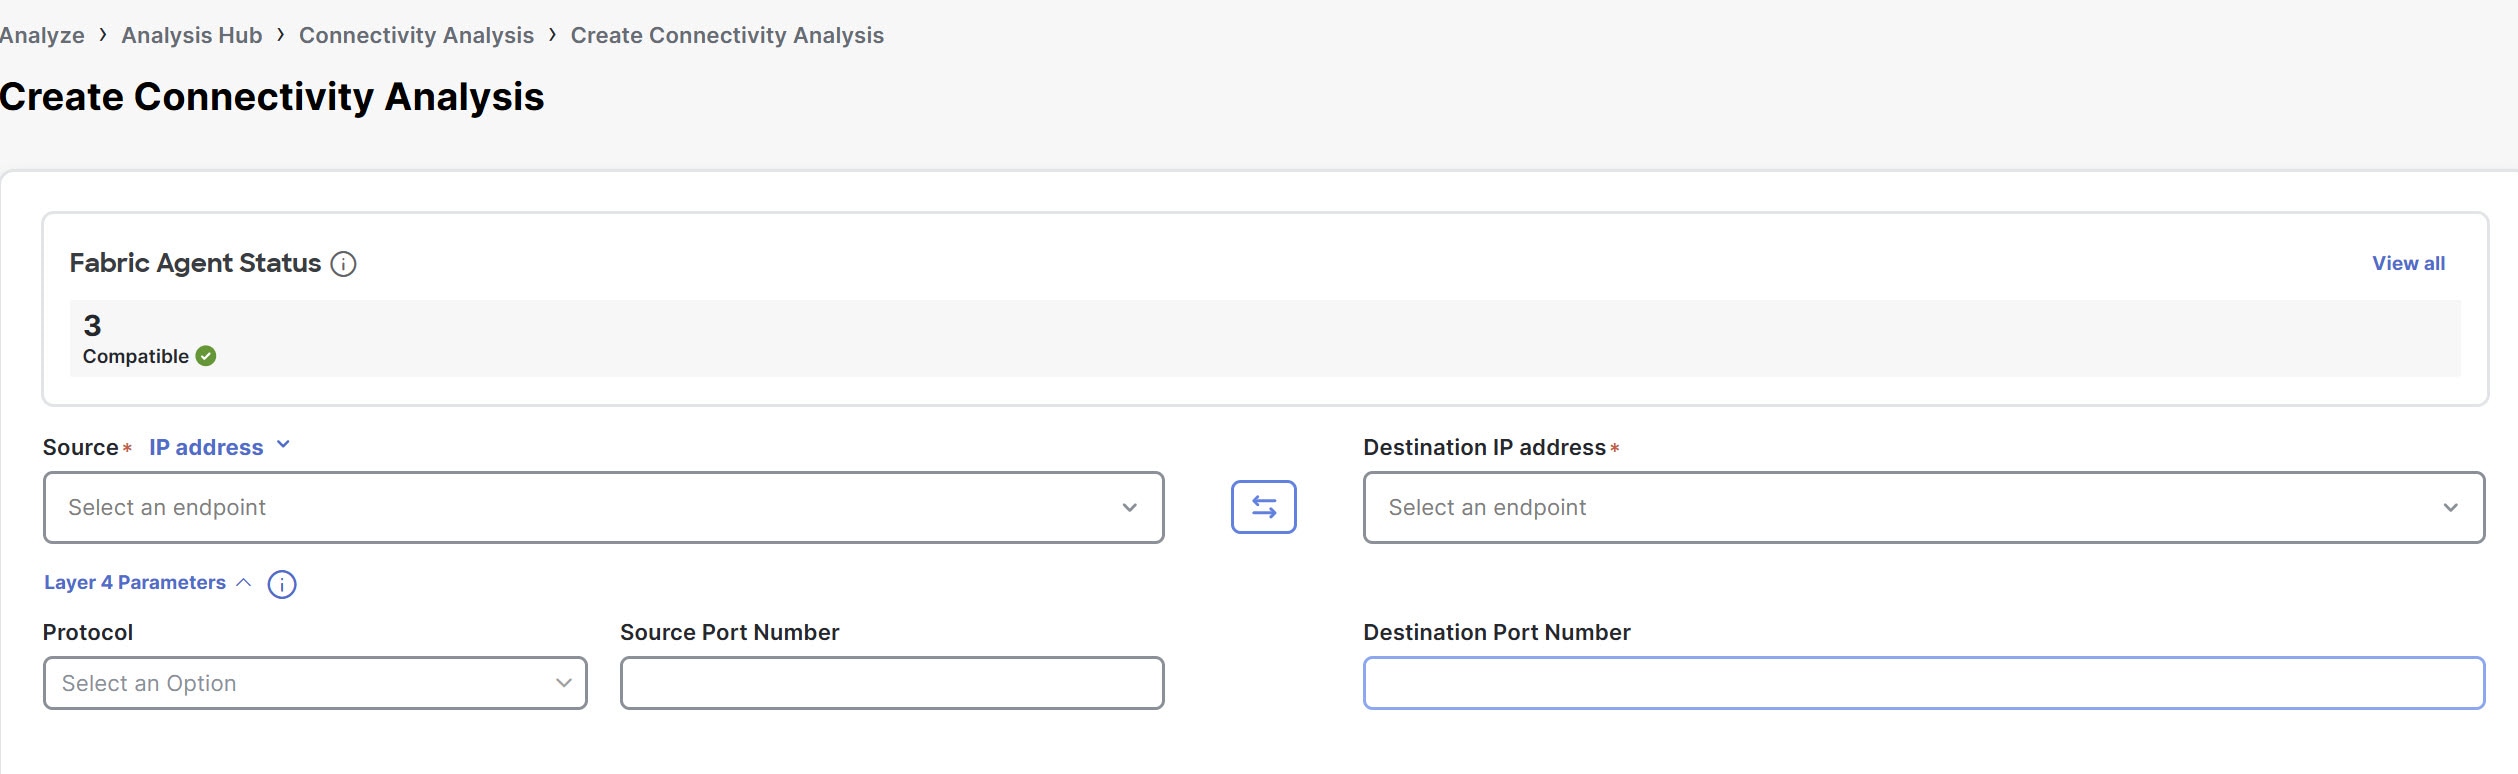
In the Create Connectivity Analysis page, you can view the Fabric Agent Status card which shows the number of onboarded fabrics and their compatibility status.
Click View all . The Fabric Agent Status dialog box opens. You can view all the onboarded fabrics and compatibility status of the fabric with respect to a specific fabric agent that runs across all the NXOS switches.
Click Update all agents to update all the fabric agents. You can update fabric agents for each fabric or for all the fabrics.
Fabric Agent updates are supported only through Nexus Dashboard. Manual updates directly on the switch are not supported and may lead to inconsistent agent states. This ensures consistent and reliable update management within the Nexus Dashboard environment.
You can click a fabric to view the switches that are part of the fabric and their agent versions in the Switches for fabric_name dialog box.
If all the fabrics are compatible, the Fabric Agent Status card in the Create Connectivity Analysis page shows status as Compatible.
-
Complete the following for Layer2 and Layer 3 parameters.
-
From the IP address drop-down list choose IP address or MAC address for Source and Destination to analyze the flow between two endpoints.
-
Choose the source endpoint from the drop-down list or enter the endpoint. A maximum of 20 IP or MAC addresses are displayed at a given time.
-
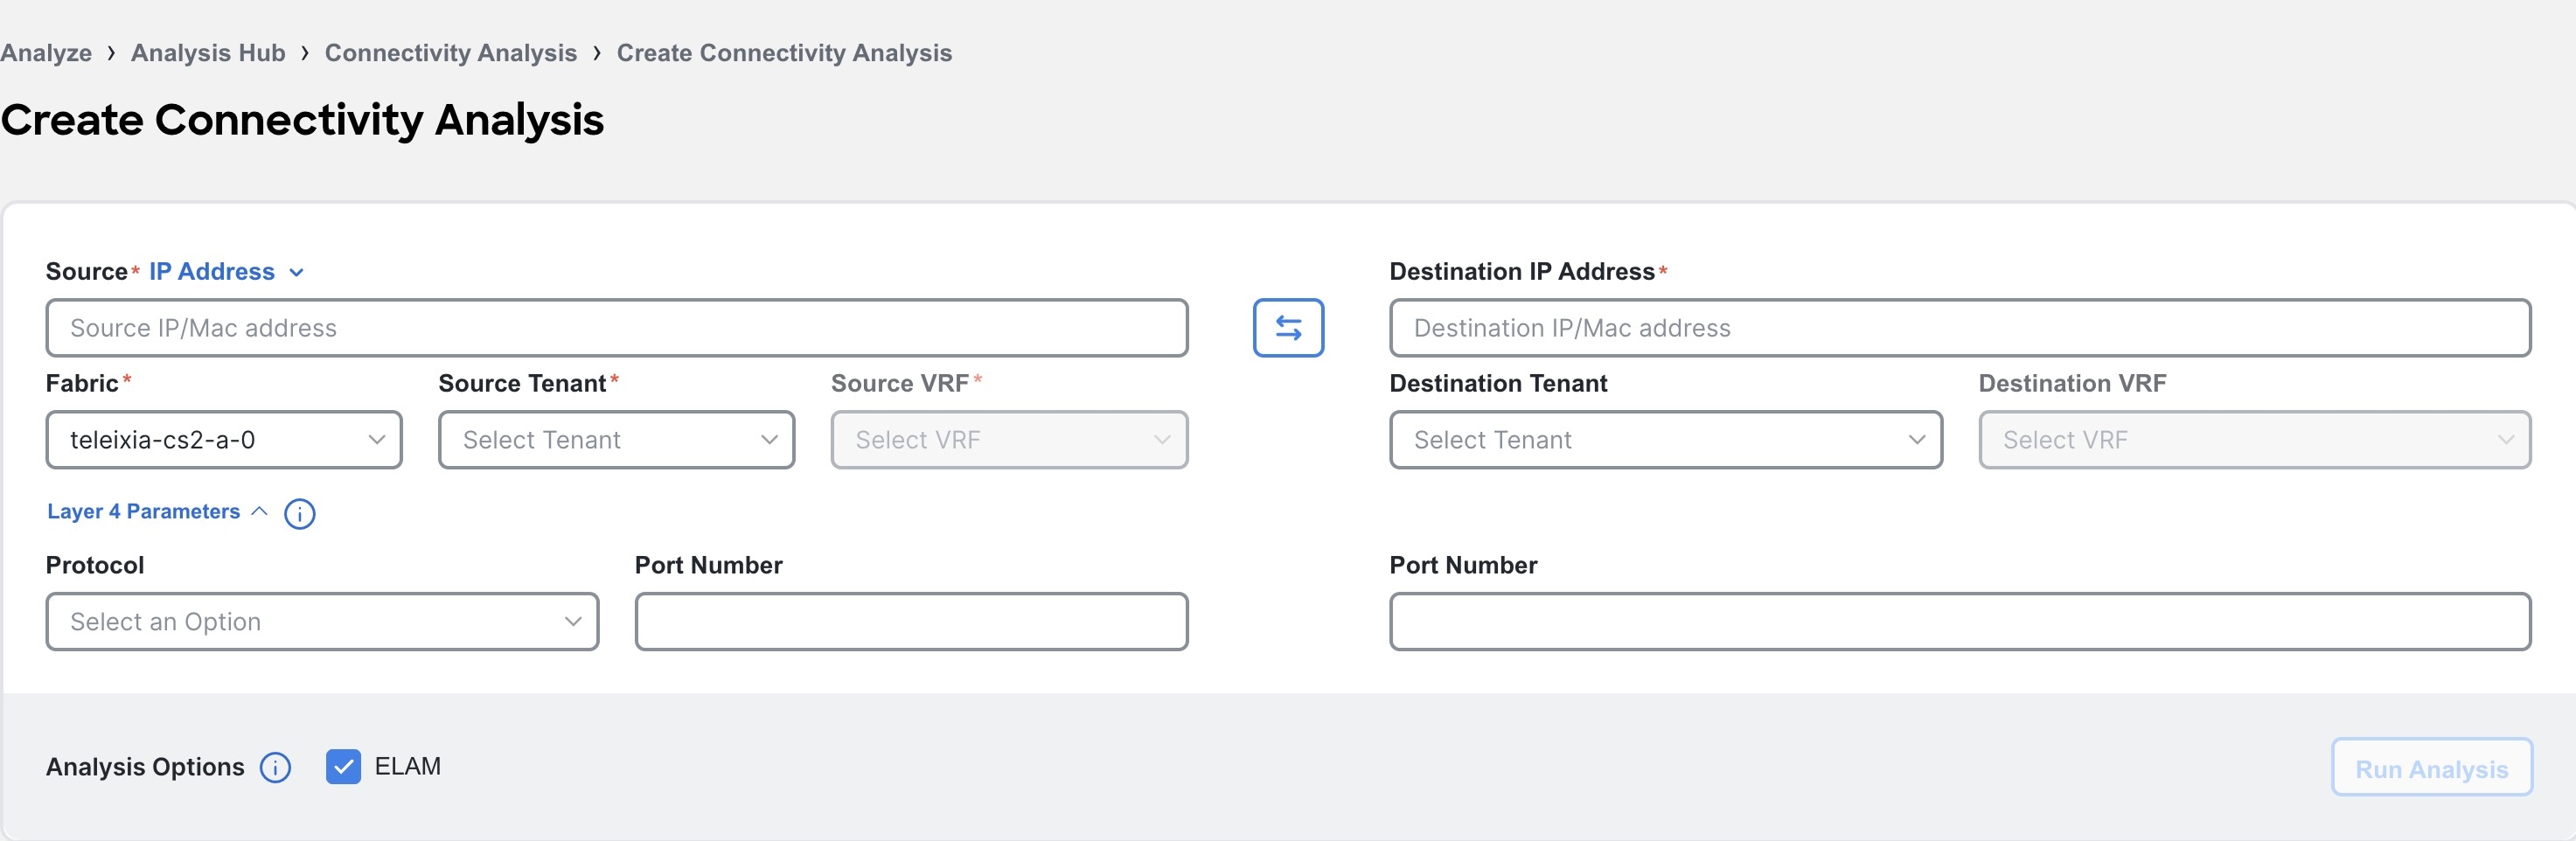
You can also manually populate the Layer2 and Layer 3 parameters. Click Edit Details Manually to enter the source IP or MAC address, destination IP or MAC address, and fabric type. For ACI fabrics, also enter the source tenant, source VRF instance, destination tenant, and destination VRF instance. For standalone NX-OS fabrics, also enter the VRF instance and source VLAN.
-
Choose the destination endpoint from the drop-down list or enter the destination endpoint.
-
-
For standalone NX-OS fabrics, choose the Fabric Type, VXLAN or Classic.
-
Complete the following for Layer 4 parameters.
-
From the Protocol drop-down menu, choose ICMP, TCP, or UDP protocol.
-
Enter the source and destination port number.
-
-
Choose the Analysis Options.
-
Check ELAM option to analyze an available active flow.
-
For standalone NX-OS fabrics, check OAM option to locate potential drops for active hosts or to track details such as reachability and actual route of the flow in a VXLAN EVPN based fabric topology, without the need of active traffic between the hosts. OAM is supported only on VXLAN fabrics.
The OAM option is not available for NX-OS multi-fabric environments.
-
Check Consistency Checker option to detect control plane and data plane configuration and operational inconsistencies along the flow between specified endpoints or routes.
You cannot select both ELAM and OAM options for Connectivity Analysis.
-
-
Click Run Analysis.
-
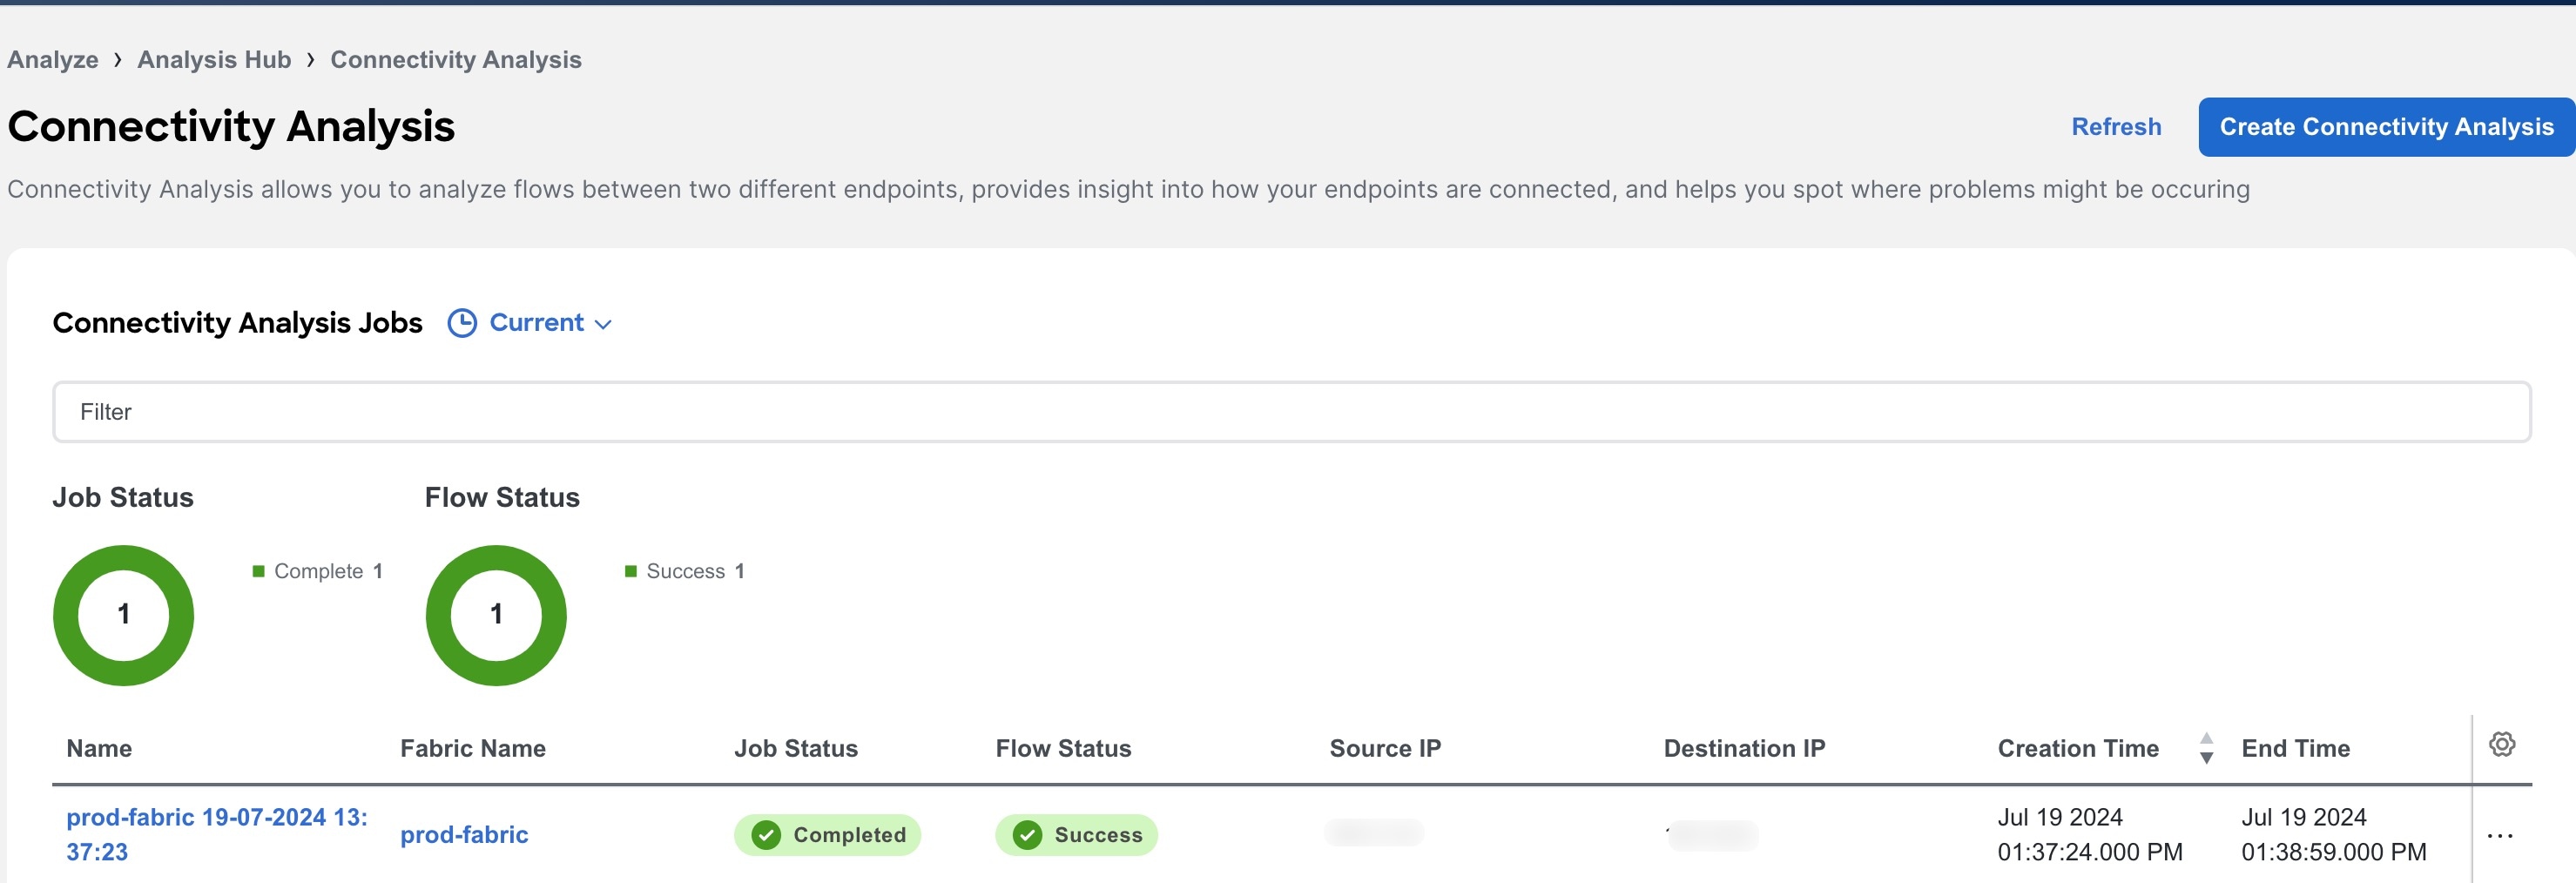
After the Connectivity Analysis is completed, the analysis is displayed in the Connectivity Analysis Jobs table. Navigate to Analyze > Analysis Hub > Connectivity to view the Connectivity Analysis Jobs. The Analysis is assigned a default name and you can rename the analysis.
-
Select the analysis and then from the Actions drop-down menu click Rename Analysis to rename.
OR
-
Click on analysis name. In the View Connectivity Analysis page, from the Actions drop-down menu click Rename Analysis to rename.
-
View connectivity analysis
Follow these steps to view connectivity analysis.
-
Navigate to Analyze > Analysis Hub > Connectivity. The Connectivity Analysis jobs are displayed.
-
Choose a time range from the drop-down menu.
-
The Summary area displays the overall status of the Connectivity Analysis jobs and the flow status.
-
Use the filter bar to filter the list of jobs. The Connectivity Analysis table displays filtered jobs.
-
Click the column heading to sort the jobs in the table.
-
Click the gear icon to configure the columns in the table.
-
Hover around a failed Flow Status to learn more.
-
-
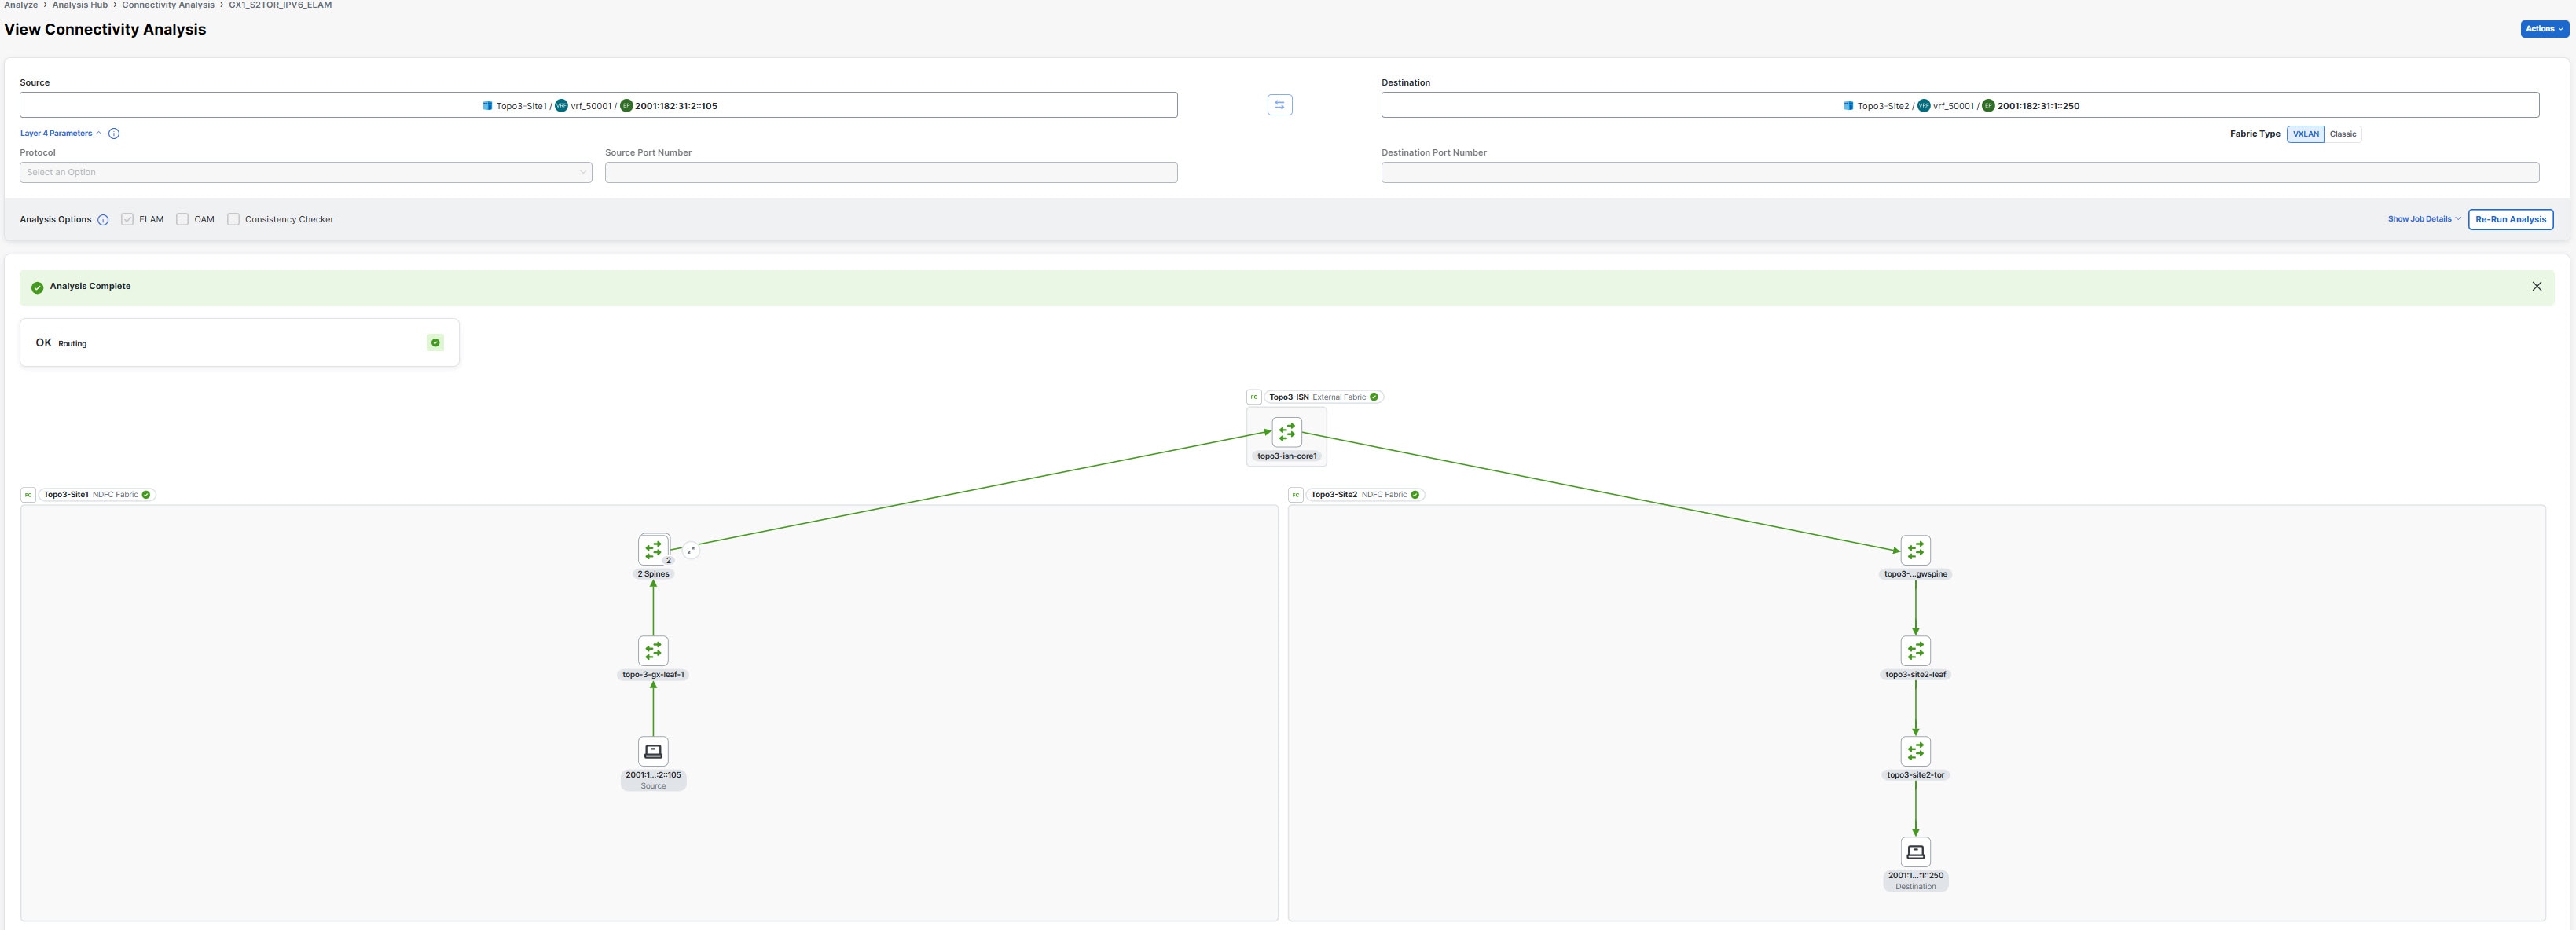
Click Name to view the Connectivity Analysis details. The View Connectivity Analysis page displays the input parameters you had entered for the job, the job details, and topology.
-
In the Source field, enter the source site name/VRF name/source IP.
-
In the Destination field, enter the destination site name/VRF name/destination IP.
-
Click Show Job Details to view the job details.
-
Click Re-run Analysis to run the analysis again.
-
Below the Show Job Detials, you can see a banner that displays the status of the job. A green banner represents a successful analysis and a red banner represents a failed analysis.
-
You can view the routing status between the source end point and destination end point in the Routing card. Routing card states OK or Not OK.
You will see a green check mark, if the routing status is okay and a red cross (x) mark if there are any routing errors. You can click the red cross (x) mark to open the Event Log page. The routing errors will be highlighted in the Event Log page.
-
For standalone NX-OS fabrics, use toggle enable or disable Highlight Active Path. When you enable Highlight Active Path, all the OAM paths in the topology are highlighted.
-
Click Re-run Analysis to run the analysis again.
-
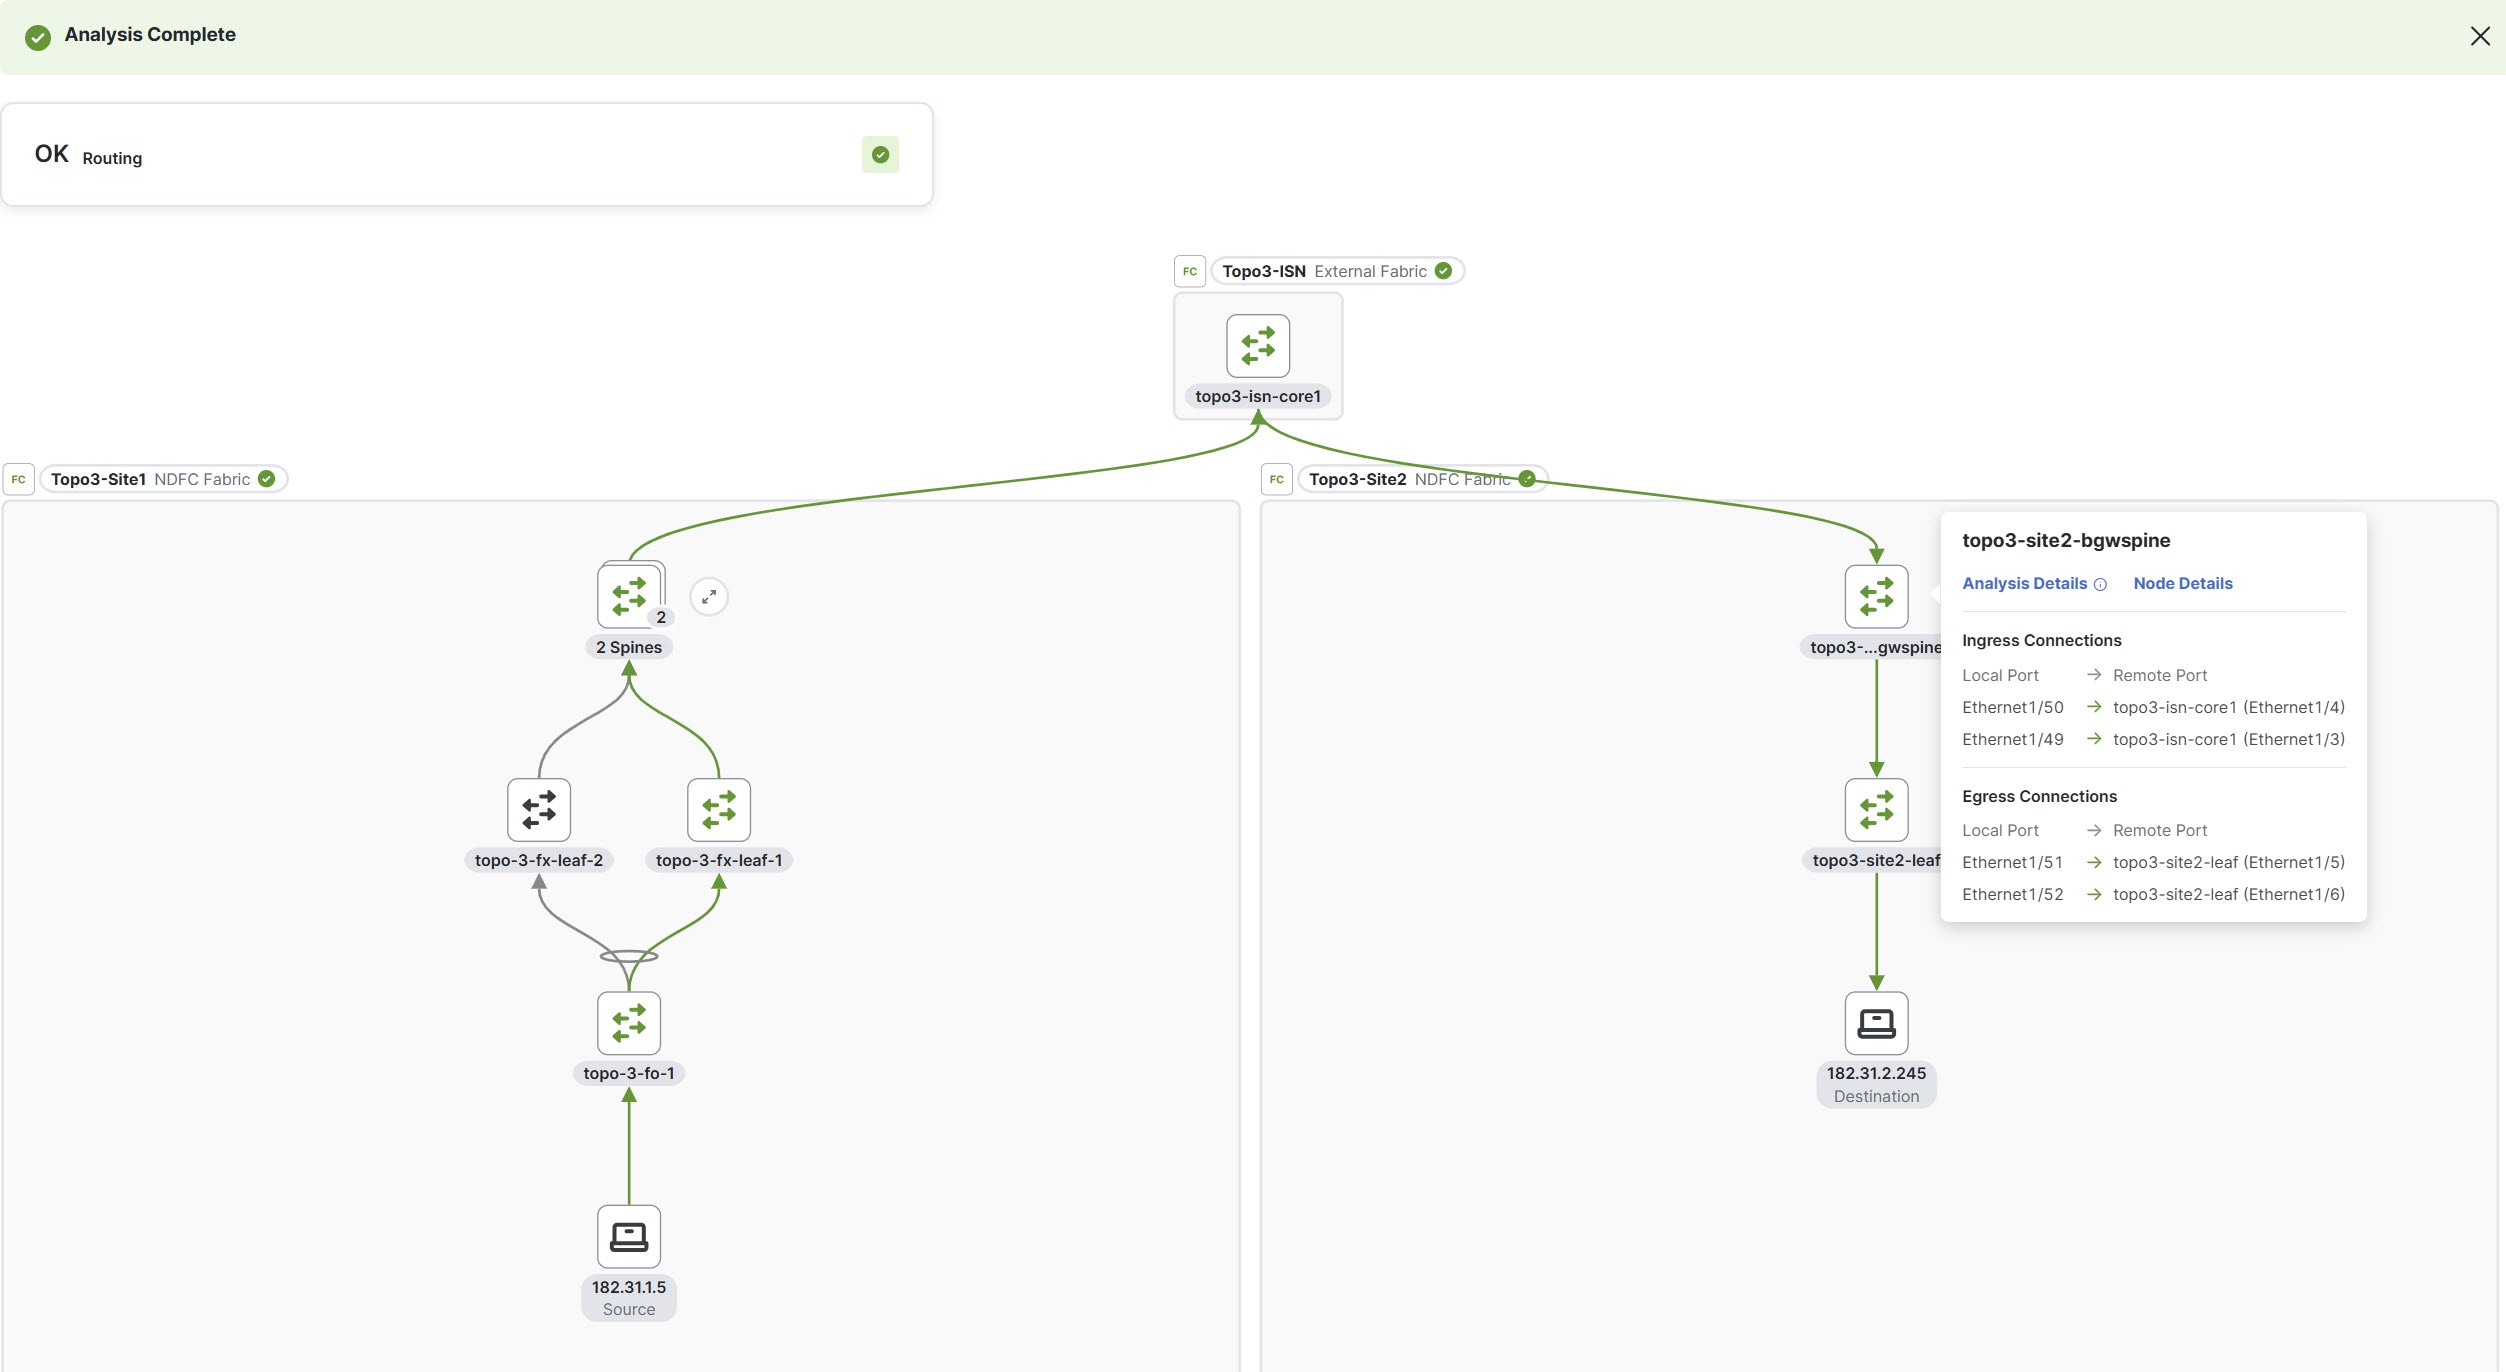
In the topology area, you can visualize hierarchial view of the fabric. You can double-click on the node to view interconnections of the nodes in the fabric. The active path between nodes is highlighted in green color. See Topology.
Starting from Nexus Dashboard release 4.0.1, connectivity analysis includes multi-fabric capabilities.
-
Click a node to view the tooltip. The tooltip displays the node name, node type, and the ingress and egress connections for that node, as well as OAM information if applicable. In the ingress and egress connections, only physical interfaces are displayed. For standalone NX-OS fabrics, egress information is not displayed on the first VTEP node.
-
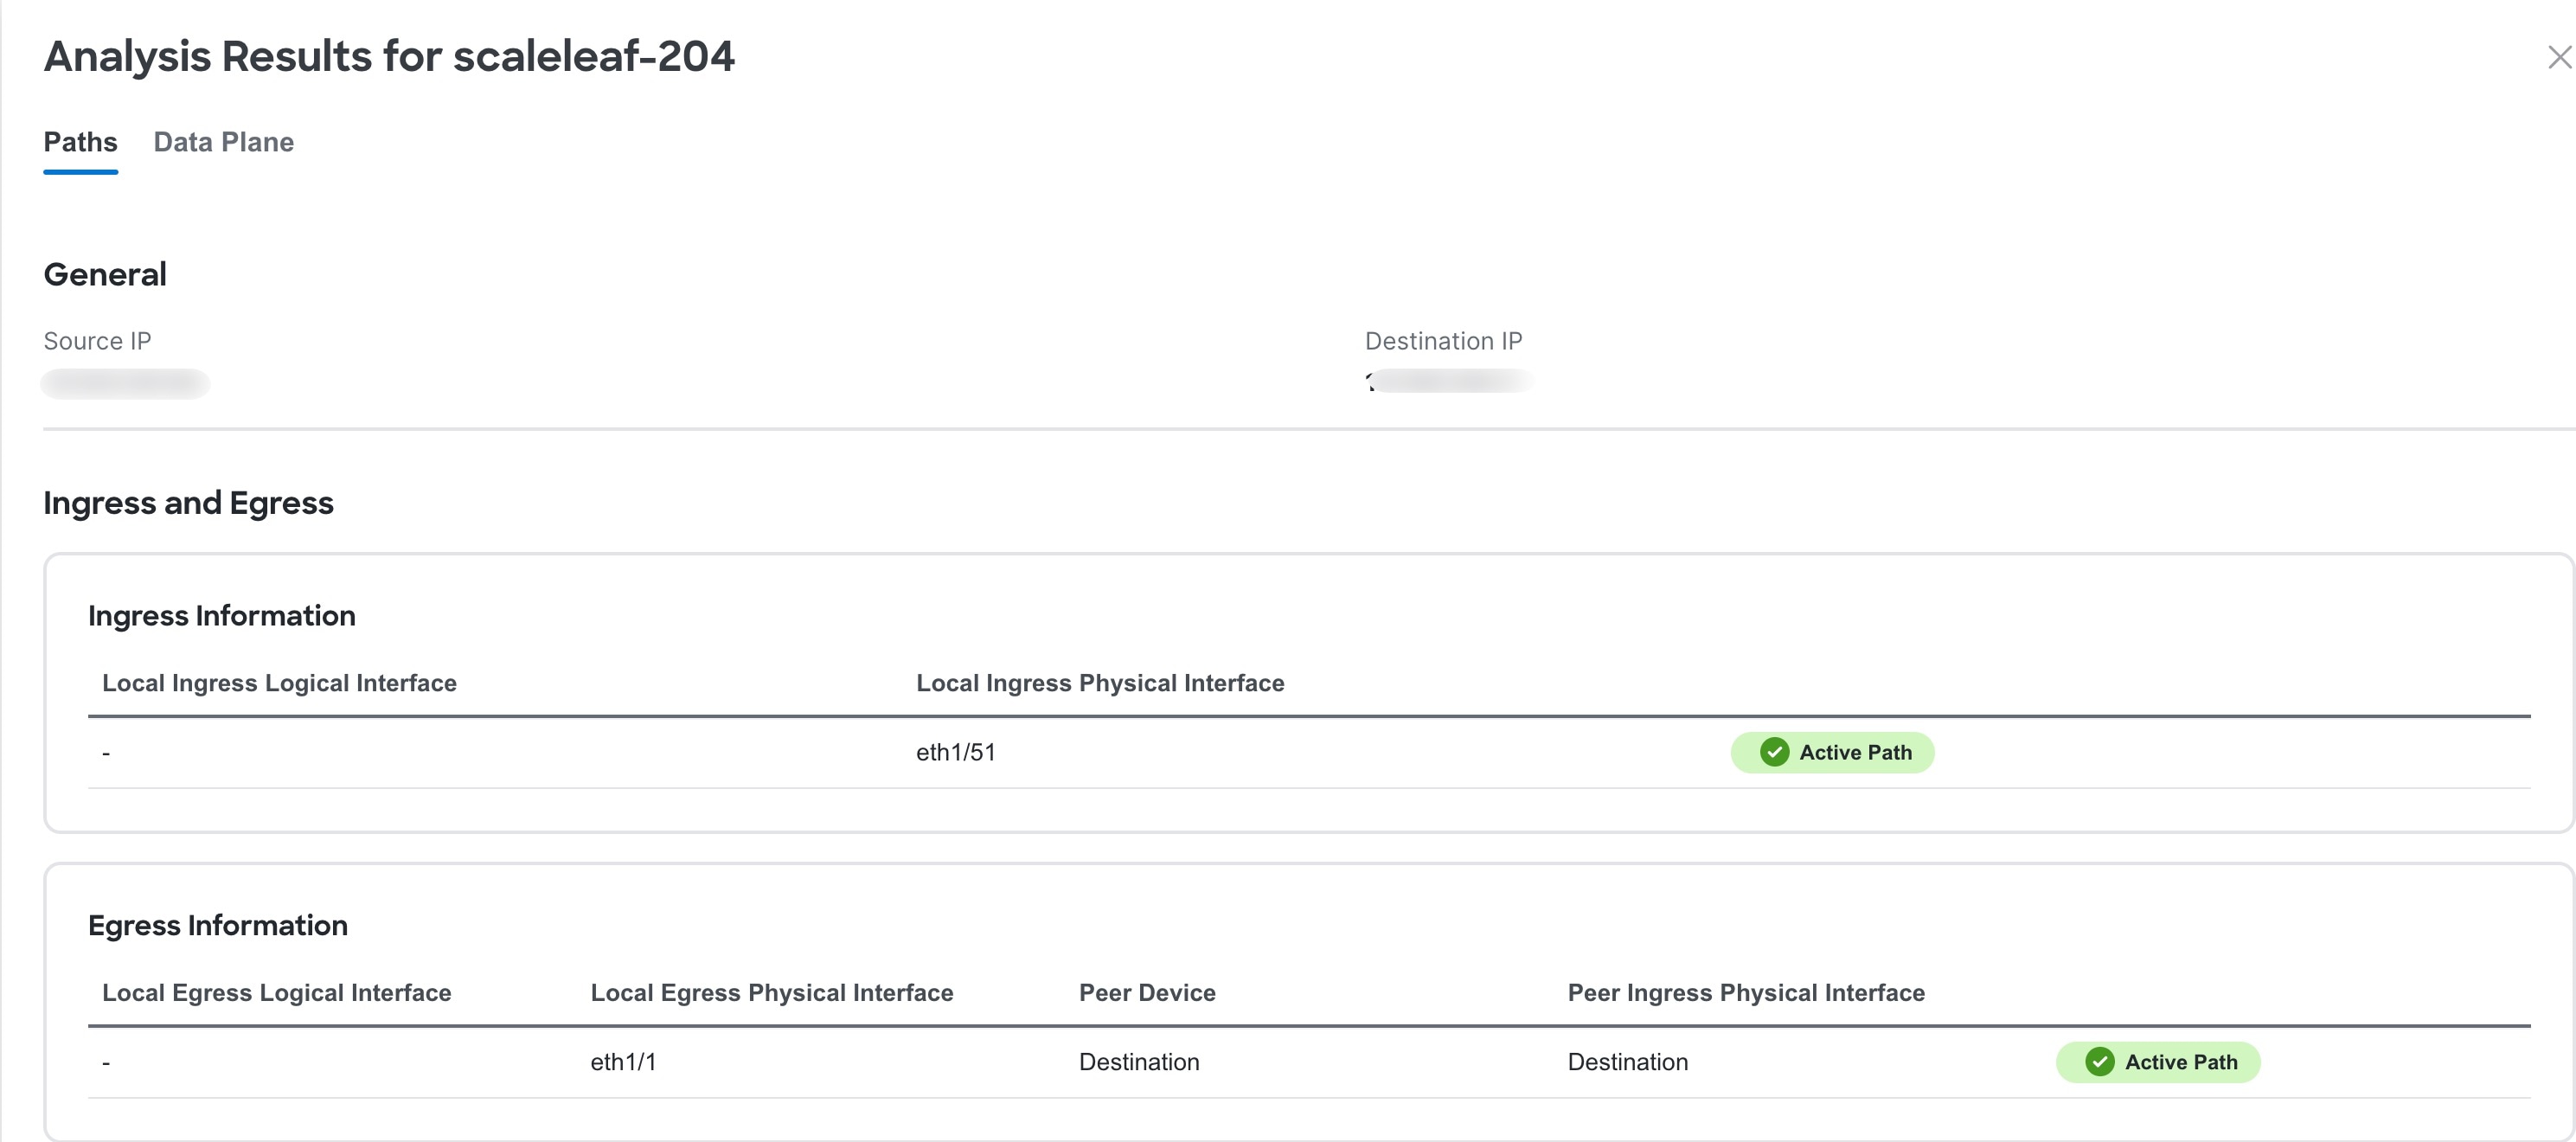
Click Analysis Details to view the path and data plane information.
-
Click Paths to view path details such as ingress and egress information, and OAM information if applicable. In the ingress and egress connections area logical interfaces are displayed.
-
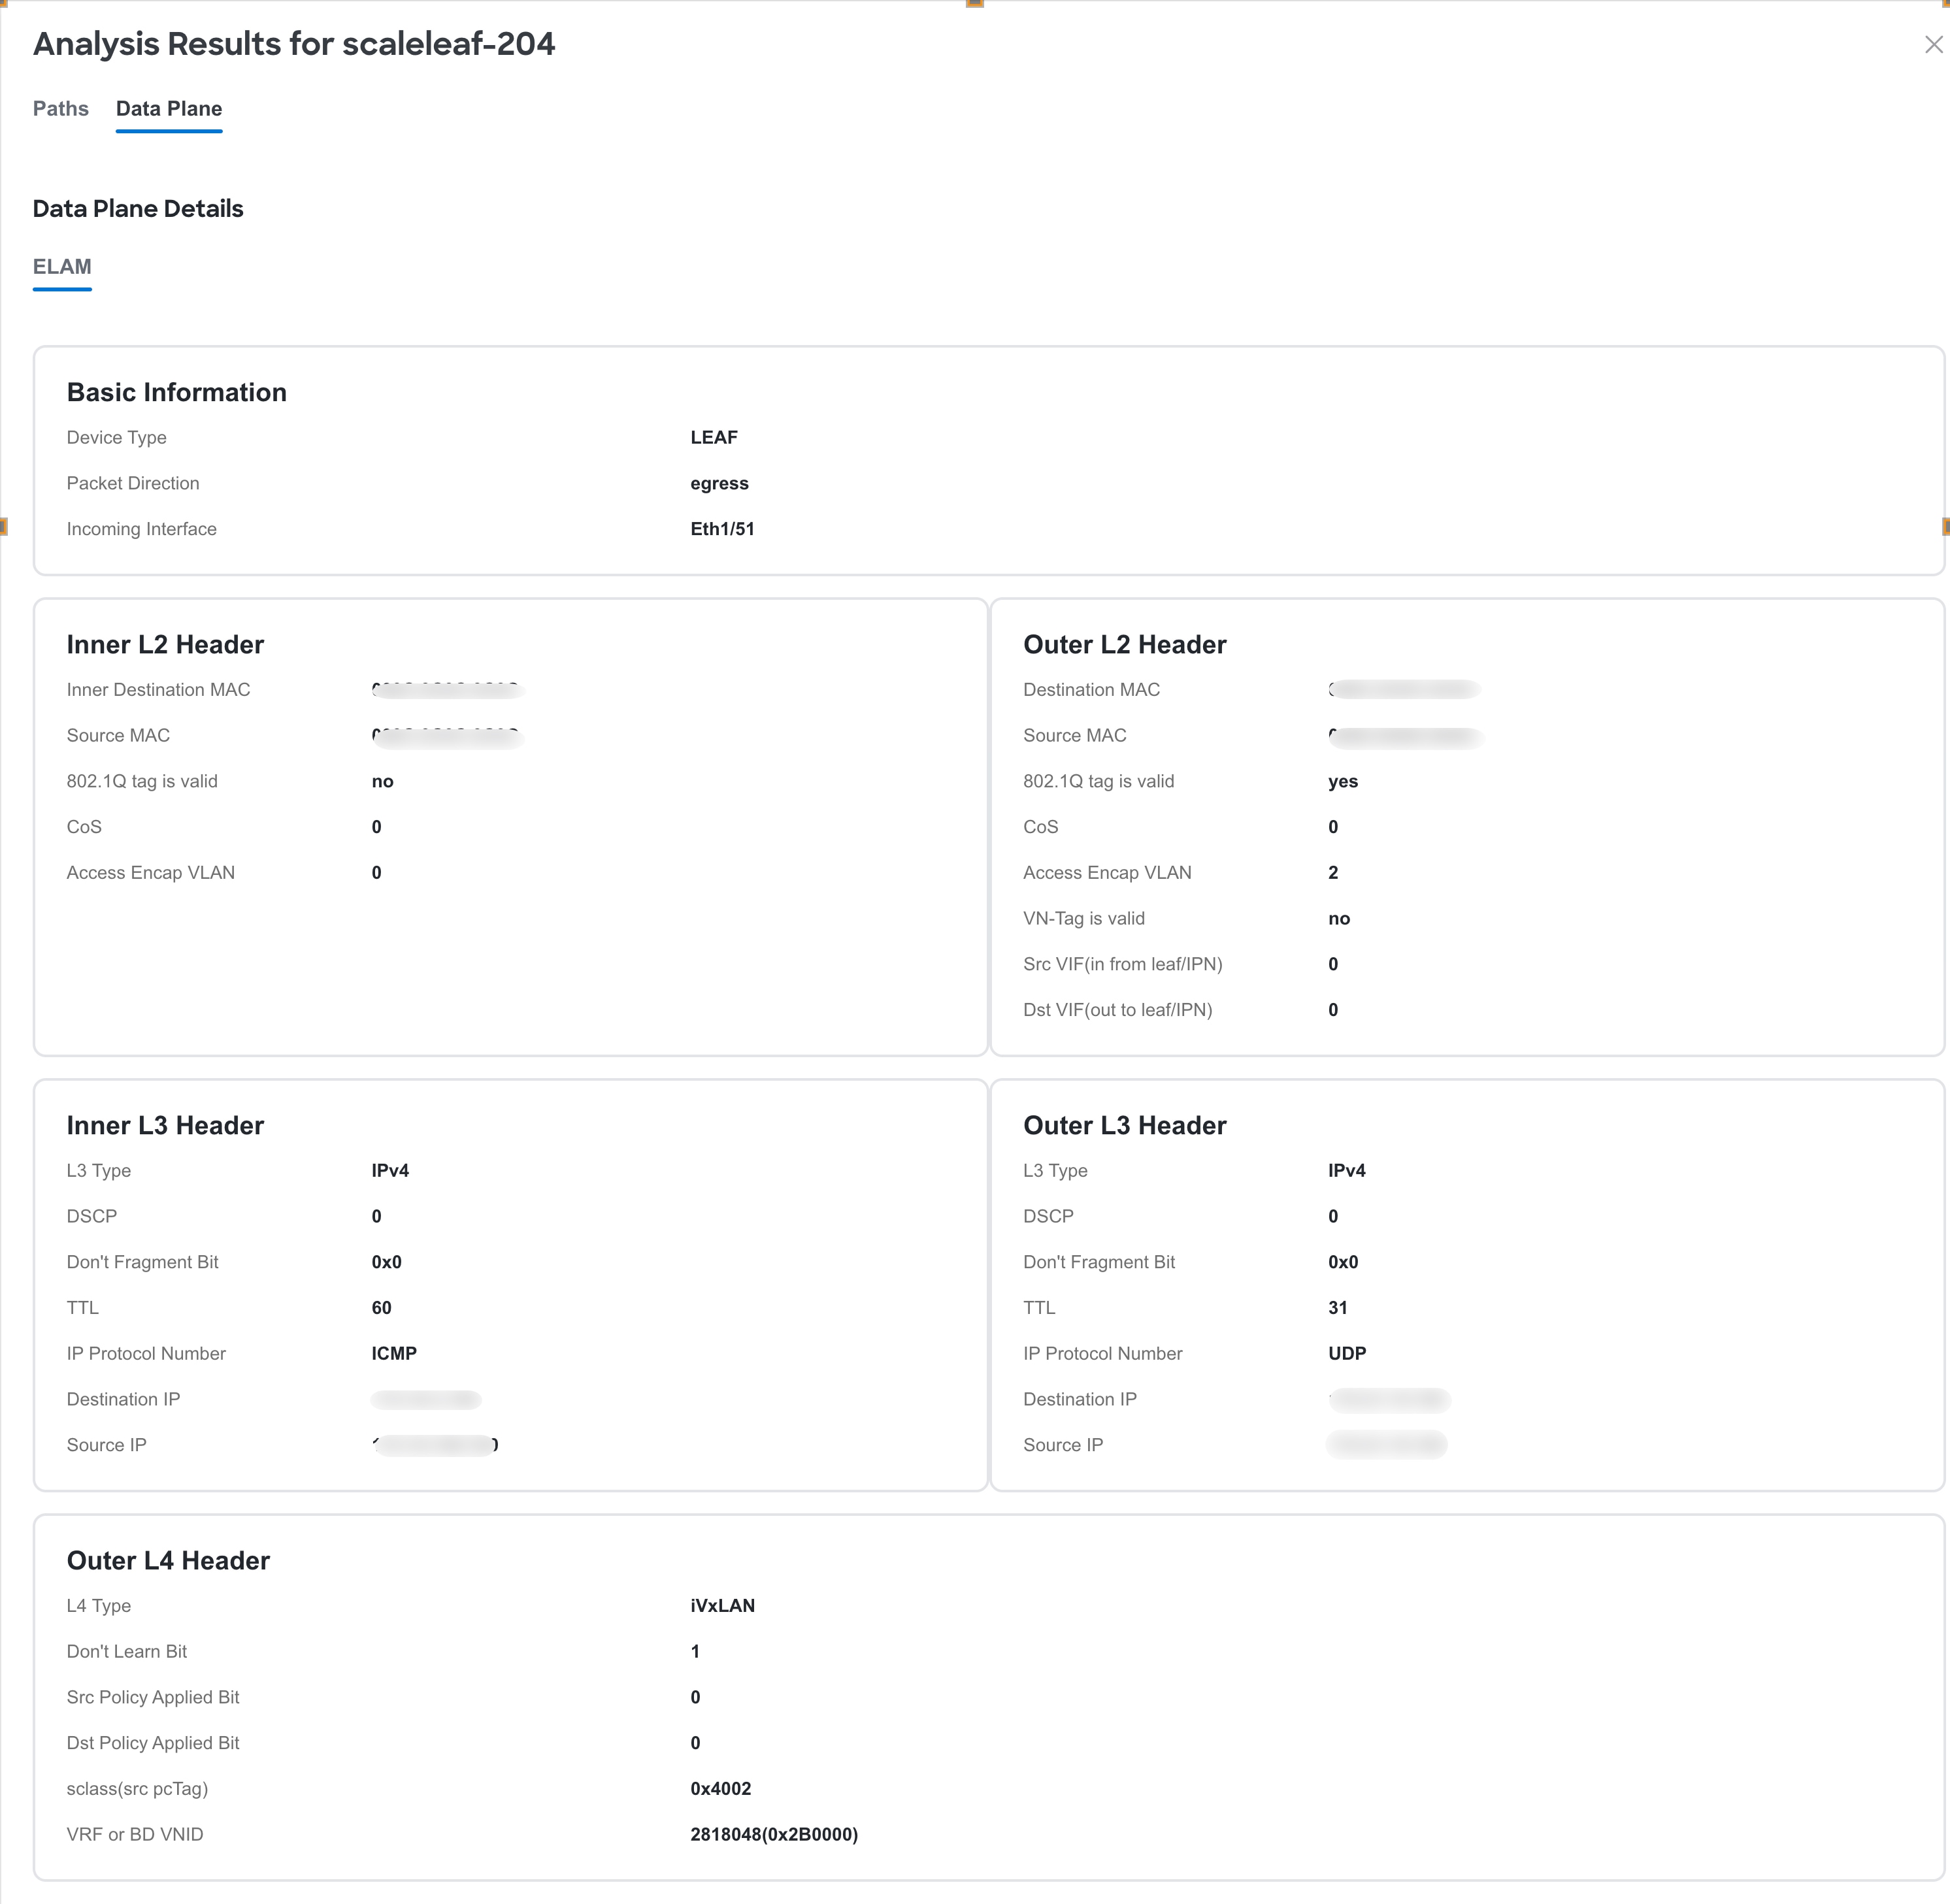
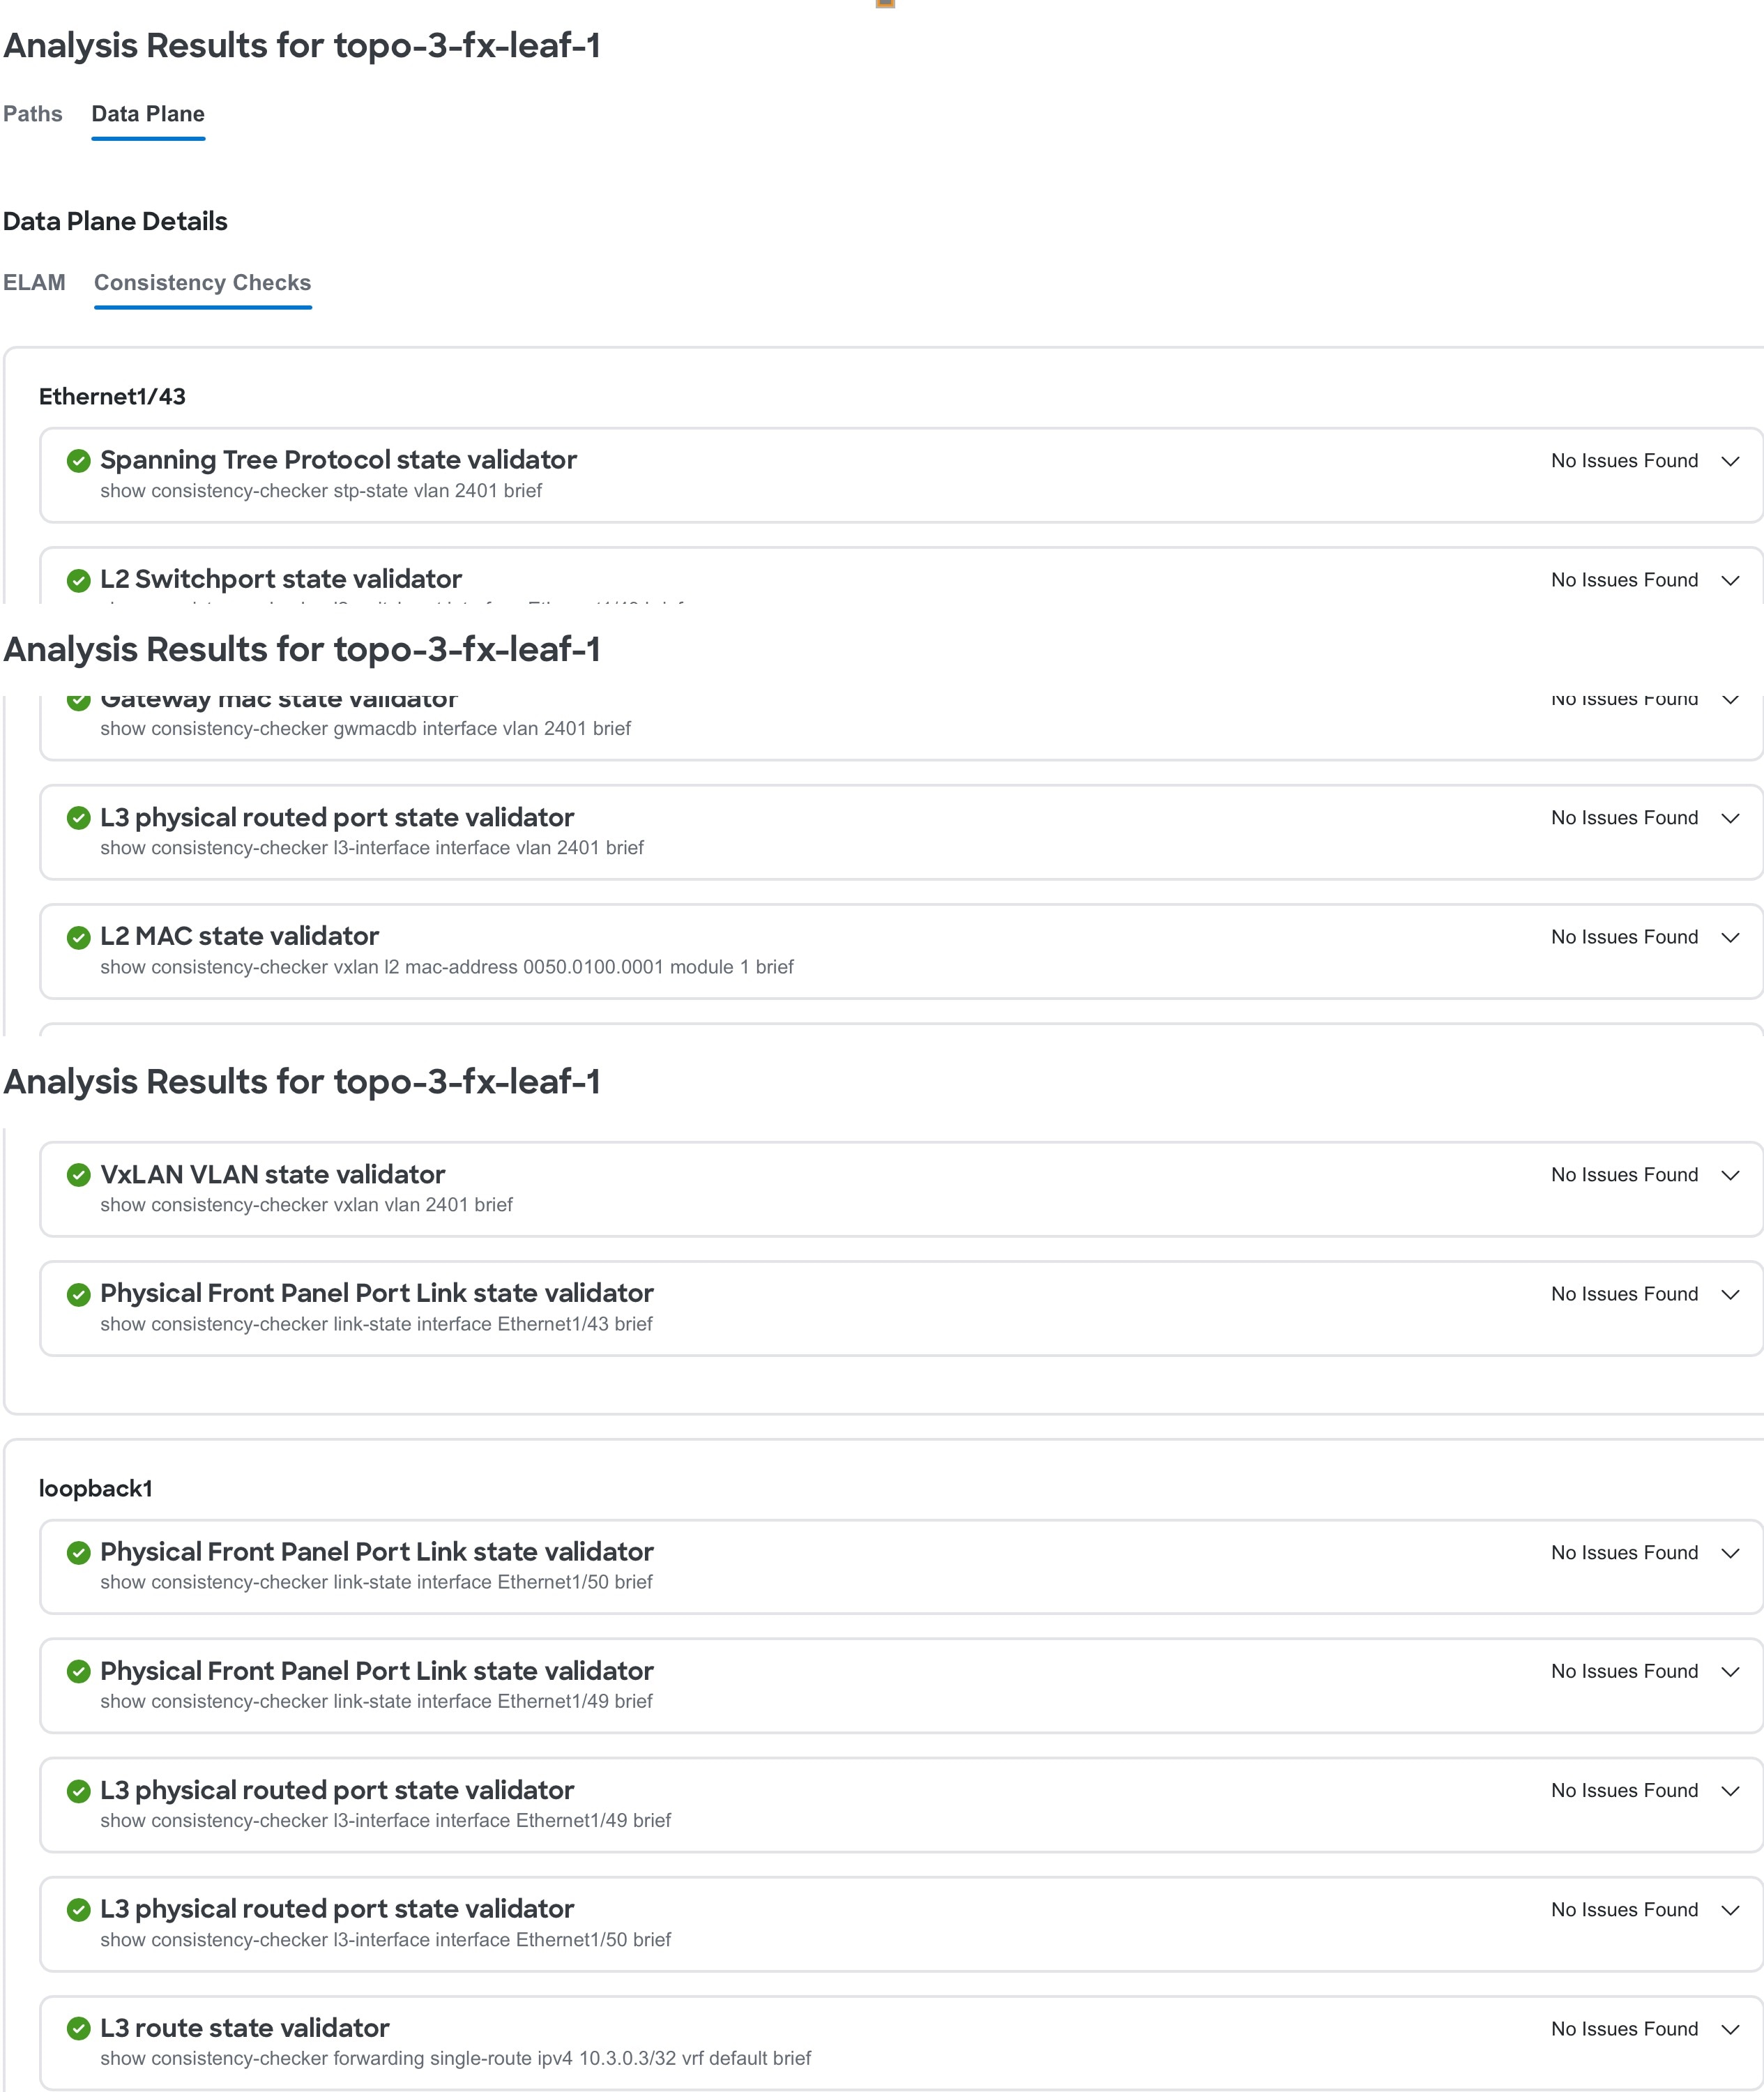
Click Data Plane to view the analysis options results.
-
Click ELAM to view the ELAM report. Click View Full Report to download the report.
-
For standalone NX-OS fabrics, click Consistency Checks to view the consistency check results.
-
For standalone NX-OS fabrics, click OAM to view the OAM report.
-
-
Click Node Details to view the node details in inventory. See Inventory.
-
Manage connectivity analysis
Follow these steps to manage connectivity analysis.
-
Navigate to Analyze > Analysis Hub > Connectivity.
-
Click Name to view Connectivity Analysis details.
-
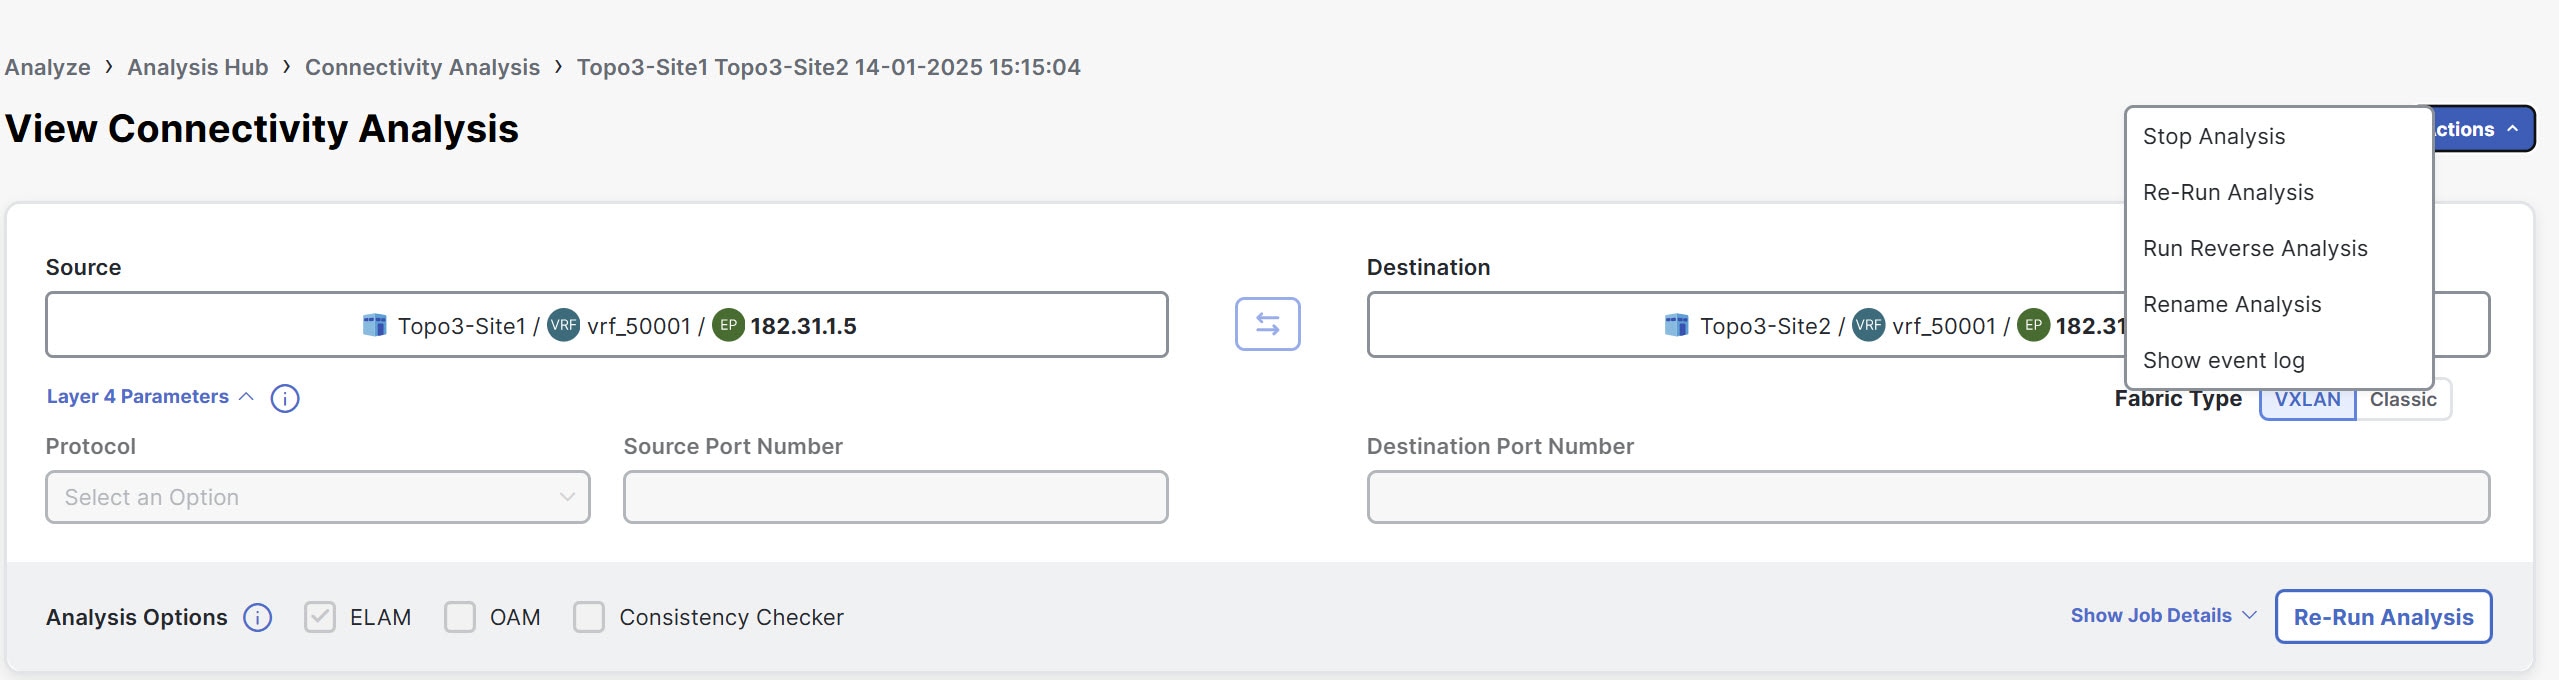
From the Actions drop-down menu choose Stop Analysis to stop the analysis.
-
From the Actions drop-down menu choose Re-Run Analysis to run the analysis again.
-
From the Actions drop-down menu choose Run Reverse Analysis to run the analysis in the reverse direction.
-
From the Actions drop-down menu choose Rename Analysis to rename the analysis.
-
From the Actions drop-down menu choose Show Event Log to view the logs for the analysis. In the event log, you can view the error message for a failed analysis.
You can also stop, re-run, run reverse, and rename an analysis by clicking the ellipses (…) for each job from the Connectivity Analysis Jobs table in the Connectivity Analysis page.
Filtering information
In some cases, you might be able to filter results to find information more easily.
For example, you might have a situation where there a large number of endpoints under a single leaf switch, but you are only interested in endpoints that have a certain VLAN value.
You could filter the information to show only those specific endpoints in this situation.
Use the following operators for the filter refinement:
| Operator | Description |
|---|---|
|
== |
With the initial filter type, this operator, and a subsequent value, returns an exact match. |
|
!= |
With the initial filter type, this operator, and a subsequent value, returns all that do not have the same value. |
|
contains |
With the initial filter type, this operator, and a subsequent value, returns all that contain the value. |
|
!contains |
With the initial filter type, this operator, and a subsequent value, returns all that do not contain the value. |
|
< |
With the initial filter type, this operator, and a subsequent value, returns a match less than the value. |
|
< = |
With the initial filter type, this operator, and a subsequent value, returns a match less than or equal to the value. |
|
> |
With the initial filter type, this operator, and a subsequent value, returns a match greater than the value. |
|
> = |
With the initial filter type, this operator, and a subsequent value, returns a match greater than or equal to the value. |
Monitoring the latency, congestion, and drops for your network, using traffic analytics
Traffic analytics enables you to monitor your network’s latency, congestion, and drops. In Nexus Dashboard, you can now configure the traffic analytics mode best suited for your fabric type and requirements. You must enable traffic analytics at the cluster level before configuring it for your fabrics.
You can choose to configure one of these Traffic analytics modes.
-
Traffic analytics full
-
Traffic analytics compatibility
-
Disabled
Traffic analytics full
The Traffic analytics full mode matches well-known TCP and UDP (optional) Layer 4 ports to their corresponding service endpoint categories to automatically discover services running in your network. Nexus Dashboard then assesses service performance based on thresholds for these metrics.
-
Latency — Measures the overall time in microseconds it takes a packet to go between the ingress and egress leaf switches for specific traffic flow. Latency is tracked for both ingress and egress traffic between a service endpoint and its clients.
-
Congestion — Measures network bandwidth utilization and quality of service (QoS) activation mechanisms to determine if a service is experiencing network congestion. For ACI fabrics, this also measures priority flow control (PFC) and explicit congestion notification (ECN) counters.
-
Drops — Measures the score or number of dropped packets versus transmitted packets considering factors such as CRC errors, faulty cables, and other devices.
An anomaly is raised if there is any deviation in the performance metrics such as latency, congestion, and drops. The performance score is calculated for each conversation and aggregated to the service endpoint or endpoint level to raise anomalies.
The performance score is calculated based on these factors.
-
Congestion — Consistent congestion avoidance active between endpoints is calculated.
-
Latency — Deviation from the average latency of the previous conversations is calculated.
-
Drops — Directly correspond to an issue with the conversation or service.
Using traffic analytics, you can
-
monitor traffic pervasively
-
report performance issues using anomalies raised for performance metrics
-
sort top talking services and clients and determine the top talkers in the system
-
determine the SYN or RST counts per service, and
-
troubleshoot conversations or flows on-demand.
You can configure the Traffic analytics full mode from the Nexus Dashboard Fabric > Edit Fabric Settings page. For more information, see Configure traffic analytics flow collection.
Traffic analytics is supported on ACI version 6.1.1 or later and NX-OS version 10.4(2) and later.
Traffic analytics compatibility
The Traffic analytics compatibility mode allows you to configure traffic analytics for fabrics that do not support the full mode capability, such as fabrics running ACI or NX-OS software versions not compatible with the full mode feature. Traffic analytics compatibility mode is also intended to support other fabrics that are not full mode capable. Note that traffic analytics compatibility mode has limited capabilities compared to full mode, review the limitations noted here for more information.
-
Traffic analytics compatibility mode is only supported with Netflow.
-
You must manually configure Netflow for both ACI and NX-OS fabrics. Nexus Dashboard will not configure the fabric to send Netflow information.
-
Traffic analytics compatibility mode currently supports only congestion anomalies. Latency and drop anomalies are not supported.
-
View the Traffic Analytics Capability column on the System Status page to see which switches support Traffic analytics full mode and which support the Traffic analytics compatibility mode.
Enabling the traffic analytics compatibility mode helps with service identification using well known ports. You can configure the compatibility mode from the Nexus Dashboard Fabric > Edit Fabric Settings page. For more information, see Configure traffic analytics flow collection.
Disabled
You can choose to configure the Disabled mode to turn off the traffic analytics feature for your fabric. When Disabled mode is configured, you cannot generate or view flow collection data for your fabrics. For more information on configuring the Disabled mode, see Configure traffic analytics flow collection.
Traffic analytics conversations
A TCP conversation is a 4-tuple including source IP address, destination IP address, destination port, and protocol. A non-TCP conversation is a 3-tuple including source IP address, destination IP address, and protocol. In case a single client establishes multiple communication flows initiated by multiple source ports toward a service endpoint, all related statistics would be aggregated as a single entry in the Traffic analytics table. A service endpoint is defined by an IP address, a port, and a protocol.
An anomaly is raised after the conversation rate limit is exceeded. Navigate to Admin > System Settings > Flow Collection. In the Traffic analytics status for the last hour area, you can view if the conversation rate approaches or exceeds the limits. You can also view if there are any Traffic analytics record drops.
Traffic analytics for multi-fabric and external conversations
By default, traffic analytics monitors traffic that is external to the fabric in a multi-fabric configuration. Remote fabric endpoints are identified with the "External" tag and have a link that takes you to the respective endpoint page to assist with visibility.
Traffic analytics support for traffic redirection to L4-L7 services
Nexus Dashboard traffic analytics capability now supports monitoring of traffic redirected to Layer 4 to Layer 7 (L4-L7) services. A new tag (L4-L7) is introduced in conversations when traffic is redirected. Ingress and egress traffic statistics, drops, congestion, and latency values are also represented in the traffic analytics statistics. This feature is supported on the Classic LAN, Enhanced Classic LAN, VXLAN, and BGP fabrics. For more information, see the "View traffic analytics for service endpoints" section in View traffic analytics for endpoints.
Traffic analytics support for north-south filters
By default, Nexus Dashboard enables traffic analytics on all L3Out interfaces to monitor traffic flows. You can create rules and apply them to external interfaces as an additional option to choose traffic that needs monitoring. Applying interface rules can filter traffic collection and prevent overloading. It also allows for visibility into specific subnets and enables targeted monitoring of key traffic. For more information on applying interface filter rules, see Apply filters to restrict traffic analytics for north-south filtering.
-
Data Center Interconnect (DCI) rules are not required for monitoring traffic within a fabric. They are only needed for monitoring traffic between multiple ACI sites. When you enable DCI rules for the first time, the system automatically creates a default rule on the spine Inter-Pod Network and Inter-Site Network (IPN/ISN) interfaces with the subnet 0.0.0.0/00::0/0. You can update these subnets to monitor only the traffic that needs monitoring.
-
Egress TCAM carving must be configured on NX-OS fabrics when using the interface filter rule feature. For detailed instructions, refer to the "Performing Egress NetFlow TCAM Carving" section in the Cisco Nexus 9000 Series NX-OS System Management Configuration Guide. This configuration is required the first time interface filters are created. If Egress TCAM carving is not performed, the interface filter rule configuration fails on the switch, and the issue is reported as a configuration failure anomaly.
-
Traffic analytics filter rules do not apply on east-west traffic.
-
Configuring interface filter rules will apply in the hardware/ASIC, this will also limit third-party NetFlow monitoring on that interface.
Guidelines for traffic analytics
These guidelines apply for traffic analytics:
-
By default, traffic analytics monitors traffic that is both internal to and external to the fabric in a multi-fabric configuration. However, if you disable flow collection of traffic that is external to the fabric, then this becomes the behavior:
-
Traffic analytics monitors only traffic flows between IPv4 or IPv6 endpoints for which at least one of them is directly connected to the fabric. One or both endpoints should be visible in the Manage > Fabrics > Connectivity > Endpoints page.
-
If both the source and destination endpoints exist outside the fabric (for example, connected to an L3Out), then the conversation will not be displayed in the Traffic analytics table.
-
-
Ensure that you have configured NTP, enabled PTP on the fabric, and PTP is synchronized within the fabric and between the fabric and the cluster. See the Cisco Nexus Dashboard Deployment and Upgrade Guide and Precision Time Protocol (PTP) for Cisco Nexus Dashboard Insights for more information.
-
If you use interface groups while enabling PTP in an Enhanced Classic LAN fabric, you must add the following commands to the freeform section of the interface group.
-
ttag -
ttag-stripIf you do not add these commands, endpoints connected behind these interfaces will experience traffic loss.
-
Support information for traffic analytics with any fabric type
-
Traffic analytics does not support multicast.
-
Traffic analytics does not support EX switches.
-
IPv6 underlay is not supported.
-
L4-L7 traffic details are only supported and displayed for Layer 3 traffic. These details are not supported for Layer 2 bridged traffic.
Guidelines and limitations for traffic analytics compatibility mode
These guidelines and limitations apply for traffic analytics compatibility mode:
-
NetFlow configuration requirement for Traffic Analytics compatibility mode on ACI fabrics
When enabling Traffic Analytics (TA) compatibility mode for ACI fabrics, you must configure the NetFlow configuration on the fabric with five tuple parameters - source IP, source port, destination IP, destination port, and protocol.
When the IP Protocol parameter is not configured, the output of the show flow cache command on switch devices will display the Protocol ID as 0. In this scenario, Nexus Dashboard Traffic Analytics Compatibility mode will not be able to classify the flow and there will be no data displayed under Analysis Hub → Traffic Analytics.
-
In a multi-fabric configuration, you can configure each fabric for either Traffic analytics full mode or Traffic analytics compatibility mode. However, within a single fabric, mixed mode (where some switches operate in full mode and others in compatibility mode) is not supported.
-
The following features are not supported in Traffic analytics compatibility mode:
-
Flow troubleshoot workflows
-
Traffic analytics support for traffic redirection to L4-L7 services
-
Traffic analytics support for north-south filters
-
Latency and drop anomalies are not supported
-
-
In Traffic analytics compatibility mode, for NX-OS fabrics, the recommended template data timeout value is 300 seconds, and the flow records timeout value is 60 seconds.
We recommend configuring the flow export timeout to 60 seconds to view the congestion anomaly.
-
If Traffic analytics compatibility mode is disabled before the upgrade and then enabled afterward, the Nexus Dashboard > Traffic Analytics page will not display any conversations. To view the conversations, disable Telemetry at the fabric level, and then re-enable both Telemetry and Traffic analytics compatibility mode, re-add any custom categories in the Manage service categories.
-
On fabrics configured with Traffic analytics compatibility mode, the switch Flow collection status incorrectly shows
Failedfor all the spine nodes. However, Nexus Dashboard event history does not indicate that it pushed any flow telemetry configuration in compatibility mode. Additionally, the flow telemetry configuration displays the message!Netflow is not supported on this switchfor the switches that do not support Netflow.
-
If you have Traffic analytics full mode configured on a fabric, you cannot enable Traffic analytics compatibility mode on the same fabric. To switch from Traffic analytics compatibility mode to full mode, you must upgrade the controller or switches to the supported versions. Traffic analytics full mode requires ACI release 6.1.1f or later, or NX-OS version 10.4 or later. Traffic analytics compatibility mode supports versions earlier than ACI 6.1.1f and NX-OS 10.4.
-
The following table lists the number of sites supported for Traffic analytics compatibility mode
Form factor Recommended site limit 1 virtual Nexus Dashboard (vND)
1 site with default and additional custom categories.
1 physical Nexus Dashboard (pND)
2 sites with defaults and additional custom categories.
3 data virtual Nexus Dashboard (vND)
1 site with default and additional custom categories.
3 physical Nexus Dashboard (pND)
3 sites with defaults and additional custom categories.
6 physical Nexus Dashboard (pND)
14 sites with defaults and additional custom categories.
Support information for traffic analytics with Cisco ACI fabrics
This support information applies for Traffic Analytics with Cisco ACI fabrics:
-
Traffic analytics is supported on Cisco Application Policy Infrastructure Controller release 6.1(1f) and later release. Fabrics running Cisco Application Policy Infrastructure Controller version earlier than release 6.1(1f) can enable compatibility mode.
-
Traffic analytics support for traffic redirection to Layer 4 to Layers 7 (L4-L7) feature requires Cisco Application Policy Infrastructure Controller release 6.1(2g) or later releases.
-
Traffic analytics support for UDP service endpoints requires Cisco Application Policy Infrastructure Controller release 6.1(2g) or later releases.
-
Traffic analytics support for north-south interface filter requires Cisco Application Policy Infrastructure Controller 6.1(4) release.
Limitations for traffic analytics with Cisco ACI fabrics
-
Traffic analytics for PBR may display zero latency and doubled traffic values.
-
Traffic analytics may have incomplete information when virtual firewalls and endpoint VMs share the same DVS uplinks within a VMM domain.
-
Traffic analytics may display inaccurate flow path visualization when chained L4-L7 service devices (for example, firewalls) are attached to the same Bridge Domains (BDs) on both the consumer and provider interfaces.
Support information for traffic analytics with NX-OS fabrics
This support information applies for traffic analytics with NX-OS fabrics:
-
Traffic analytics full mode is supported on Cisco NX-OS release 10.4(2)F and later. Fabrics running NX-OS version earlier than the Cisco NX-OS release 10.4(2) can enable Traffic analytics compatibility mode.
-
Traffic analytics UDP service endpoints and north-south interface filter features requires Cisco NX-OS release 10.5.(2) or later.
-
Traffic analytics configurations or export are not supported on the Cisco Nexus 9500 modular chassis, but flow troubleshoot jobs are supported for FX platform switches and Cisco Nexus 9500 modular chassis.
Limitations for traffic analytics with NX-OS fabrics
These limitations apply for Traffic analytics with NX-OS fabrics:
-
Traffic analytics may display partial data when the VRF instance is configured with the new L3VNI mode. For more information about the new L3VNI mode, see the Cisco Nexus 9000 Series NX-OS VXLAN Configuration Guide.
-
Traffic analytics configurations or export is not supported on Cisco Nexus 9500 modular chassis, however flow troubleshoot jobs is supported for FX platform switches and Cisco Nexus 9500 modular chassis.
-
You can apply traffic analytics filters in VXLAN fabrics for VRF-Lite external interfaces only, and switches must have Cisco NX-OS release 10.5(3) or later.
-
The timestamp tagging (TTAG-strip) should be configured on DCI interfaces. Nexus Dashboard displays only the inter-fabric flow latency, that is, the latency between the border router and the internal flow endpoint. The end-to-end latency is not displayed in this case.
Limitations for traffic analytics with multi-fabric and external conversations
These limitations apply for traffic analytics with a multi-fabric configuration:
-
Flow troubleshoot jobs are local to a fabric.
-
Latency computation is local to the fabric. The computed latency is from the endpoint to the border node and not end-to-end.
-
Remote endpoints with overlapping IP addresses are not enriched with remote fabric properties.
-
Traffic analytics does not show conversations between external endpoints. One endpoint in the conversation should be learned or local to the fabric. This applies for both a single fabric and a multi-fabric.
Configure traffic analytics flow collection
-
Ensure traffic analytics is enabled for your cluster in the Admin > System Settings > Flow collection.
To enable traffic analytics, choose Traffic analytics in the Flow collection mode.
-
Review the guidelines and limitations described in Guidelines for traffic analytics for the traffic analytics mode you choose for your fabric.
-
If you are configuring Traffic analytics compatibility mode, review the support information in [Support information for traffic analytics compatibility mode] section.
If flow telemetry is already enabled on the fabric, you must first disable flow telemetry for all the fabrics and remove all flow rules before enabling traffic analytics.
Apply the traffic analytics configuration
Follow these steps to apply the traffic analytics configuration.
-
Navigate to the main Fabrics page.
Manage > Fabrics
-
Locate the fabric you want to edit.
-
Click the circle next to the fabric you want to edit, then click Actions > Edit Fabric Settings.
The Edit fabric_name Settings page appears.
-
Click Telemetry > Configuration.
When multiple flow collection modes are selected, Nexus Dashboard automatically deploys the highest-capability mode supported by each switch based on its platform and software version: Flow Telemetry, followed by NetFlow and sFlow.
-
Navigate to Flow collections modes under Traffic analytics.
-
Choose one of these modes.
-
Traffic analytics full to configure all traffic analytics features.
-
Traffic analytics compatibility to configure compatibility mode and follow the additional steps described in Apply the traffic analytics compatibility mode configuration section.
-
Disabled to turn off the traffic analytics configuration on your fabric.
-
-
Click Save to save your changes.
Navigate to your fabric’s Overview page to review the traffic analytics mode information for your fabric. Depending on the traffic analytics mode you configured, the traffic analytics status (enabled or disabled) and summary are available in the Analytics summary > Traffic analytics. For more information, see View traffic analytics.
You can view the traffic analytics data for your fabrics after applying the traffic analytics configuration.
-
In the Conversation rate status area, you can see the number of conversations that exceed the limit and traffic analytics drops.
You must make sure that you do not exceed the maximum conversation rate limit. If you exceed the maximum conversation rate limit, you will see drops in flows records, which will impact the visibility.
-
Click View all traffic analytics rate statistics to view the statistics for each switch in a fabric.
-
In the Traffic analytics for multi-fabric and external conversations area, choose whether you want this feature to be Enabled or Disabled.
Click Enabled for this feature if you want to track multi-fabric and external conversations (north to south).
-
If you enabled the Traffic analytics for multi-fabric and external conversations feature, determine if you want to disable this feature at some point.
After the 80% traffic analytics conversation threshold is surpassed, you might want to disable the Traffic analytics for multi-fabric and external conversations feature to preserve capacity and avoid missing data for intra data center traffic (east to west).
-
Apply the traffic analytics compatibility mode configuration
You must manually configure Netflow to apply the traffic analytics compatibility mode configuration on your NX-OS and Cisco ACI fabrics.
Follow these steps to apply the traffic analytics compatibility mode configuration.
For NX-OS Fabrics:
-
Navigate to Admin > System Status > Telemetry.
-
Click the Switches tab in the Telemetry Status area.
-
Click the ellipsis icon for the NX-OS 9000 switch and then click Expected Configuration.
The Expected Configuration for switch_name page appears.
-
View and copy configurations under Software Telemetry and Flow Telemetry.
-
Using the command line, log in to the switch.
-
Paste the configuration copied in step 4 to the switches.
The configuration shown in the Expected Configuration for switch_name is a sample configuration. You must customize this configuration before applying it to the switch. For more information, see NetFlow documentation.
For Cisco ACI fabrics:
-
Follow the configuration details described in Cisco APIC and NetFlow.
-
Configure Netflow from the APIC with the exporter IP addresses as the Nexus Dashboard’s collector persistent IP addresses. Navigate to Admin > System Settings > External pools to see the Nexus Dashboard’s collector persistent IP addresses. The port number should be
5641. -
Verify that you have the NetFlow priority configured under the fabric node control policy in APIC.
View flow collection status
For NX-OS fabrics, you can view the Flow Collection status for each node in the Switch Configuration Status column.
-
Green — Flow collection is successfully enabled.
-
Red — Flow collection is not enabled.
-
Orange — Flow collection is partially enabled.
-
Gray — Flow collection is not supported or data cannot be found. If a switch is in the disabled state, it is included in the gray category.
Disable traffic analytics flow collection for multi-fabric and external conversations
Follow these steps to disable traffic analytics flow collection for multi-fabric and external conversations.
-
Navigate to Admin > System Settings.
-
Click Flow collection.
-
For Traffic analytics for multi-fabric and external conversations, choose Disabled.
View traffic analytics
View traffic analytics for an individual fabric
Follow these steps to view Traffic analytics for an individual fabric.
-
Navigate to Manage > Fabrics page.
-
Click the fabric name.
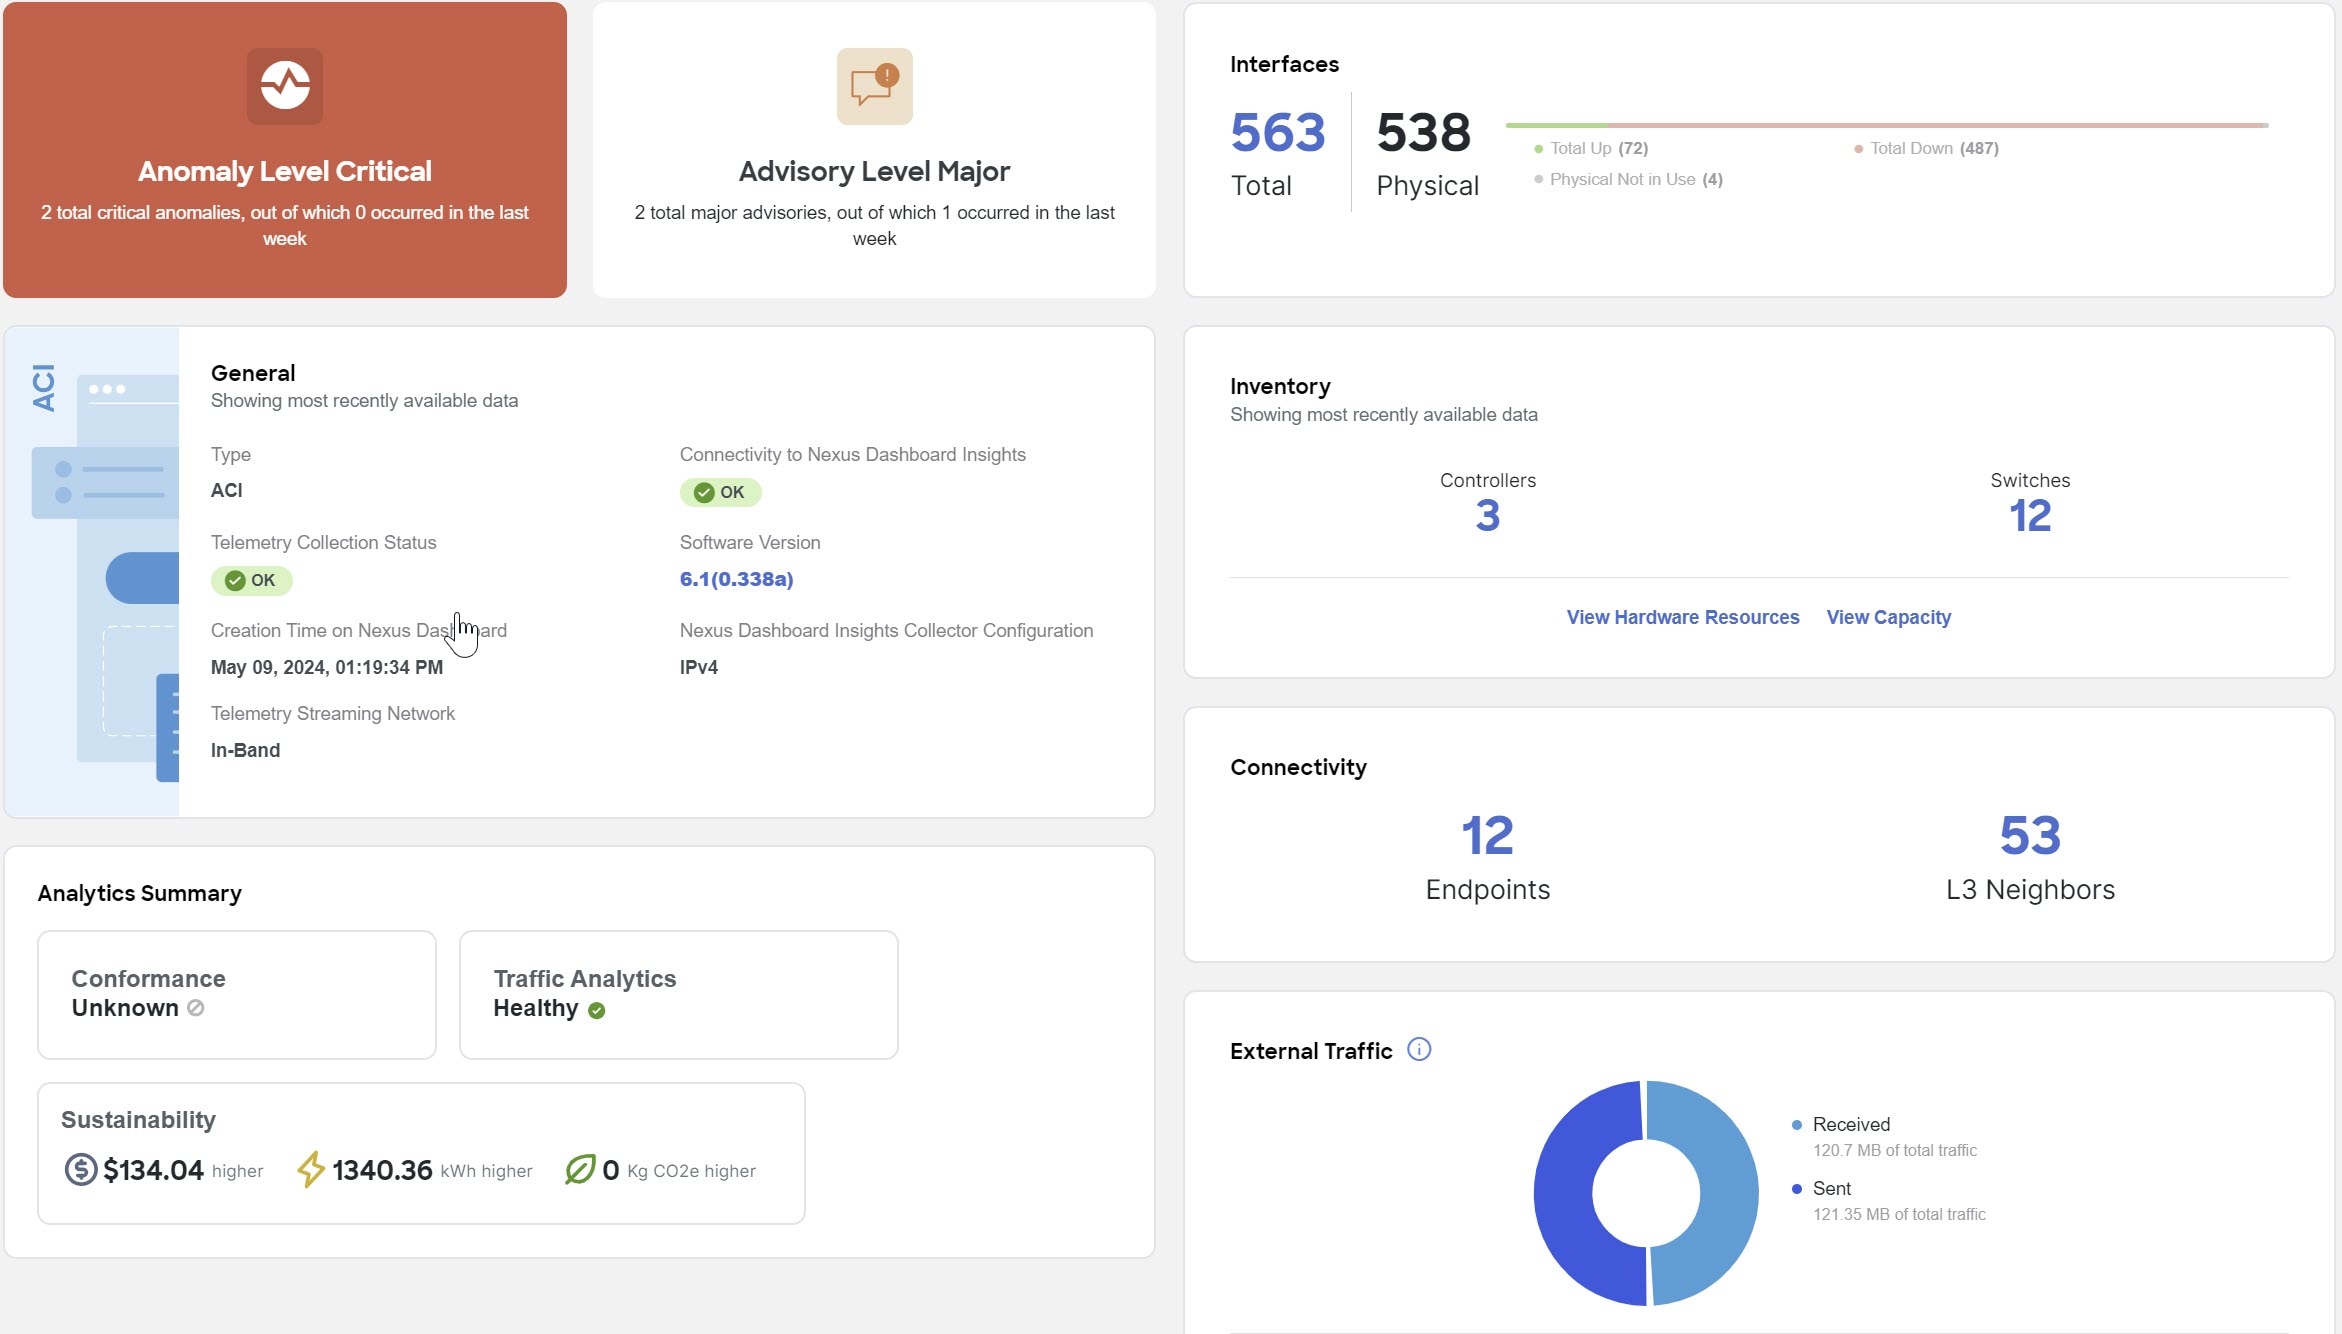
-
Choose a time range from the drop-down list. By default the Current time (last 2 hours) is chosen.
-
In the Analytics summary area, click Traffic analytics to view traffic analytics details for that fabric. In the Traffic analytics page, all information is grouped as service categories for that fabric.
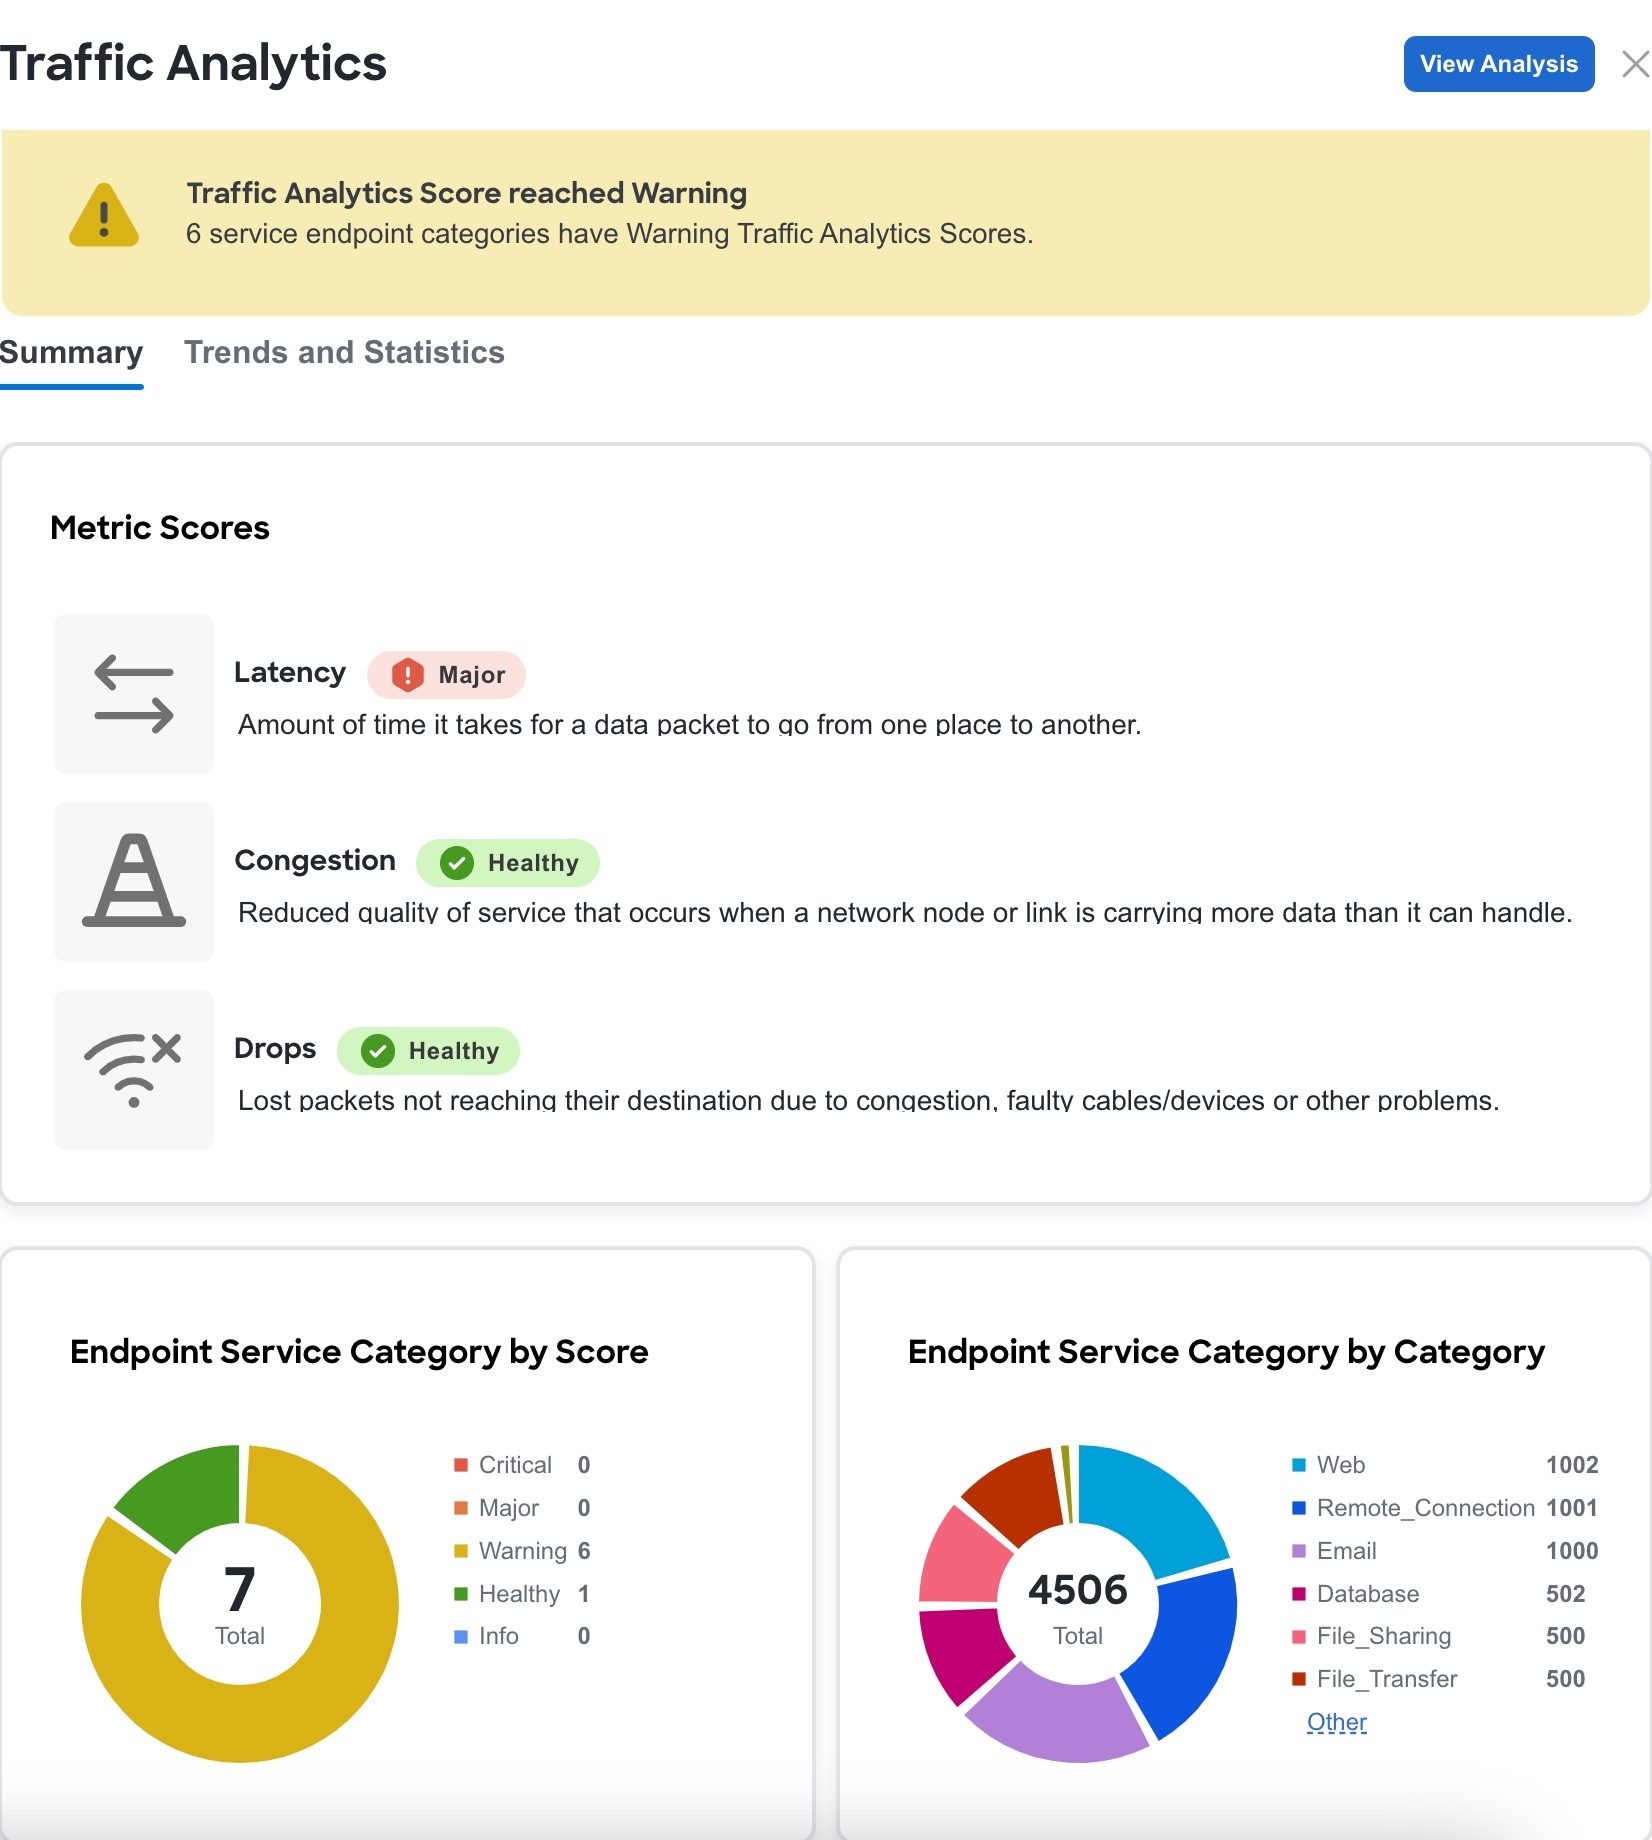
-
The Summary area displays the Traffic Analytics Score and how the metrics is determined. You can view the traffic profile for Endpoint Service Category by score and category.
-
Click Trends and Statistics to view Traffic profile, Top Endpoint Service Score Changes, and Top Endpoint Categories.
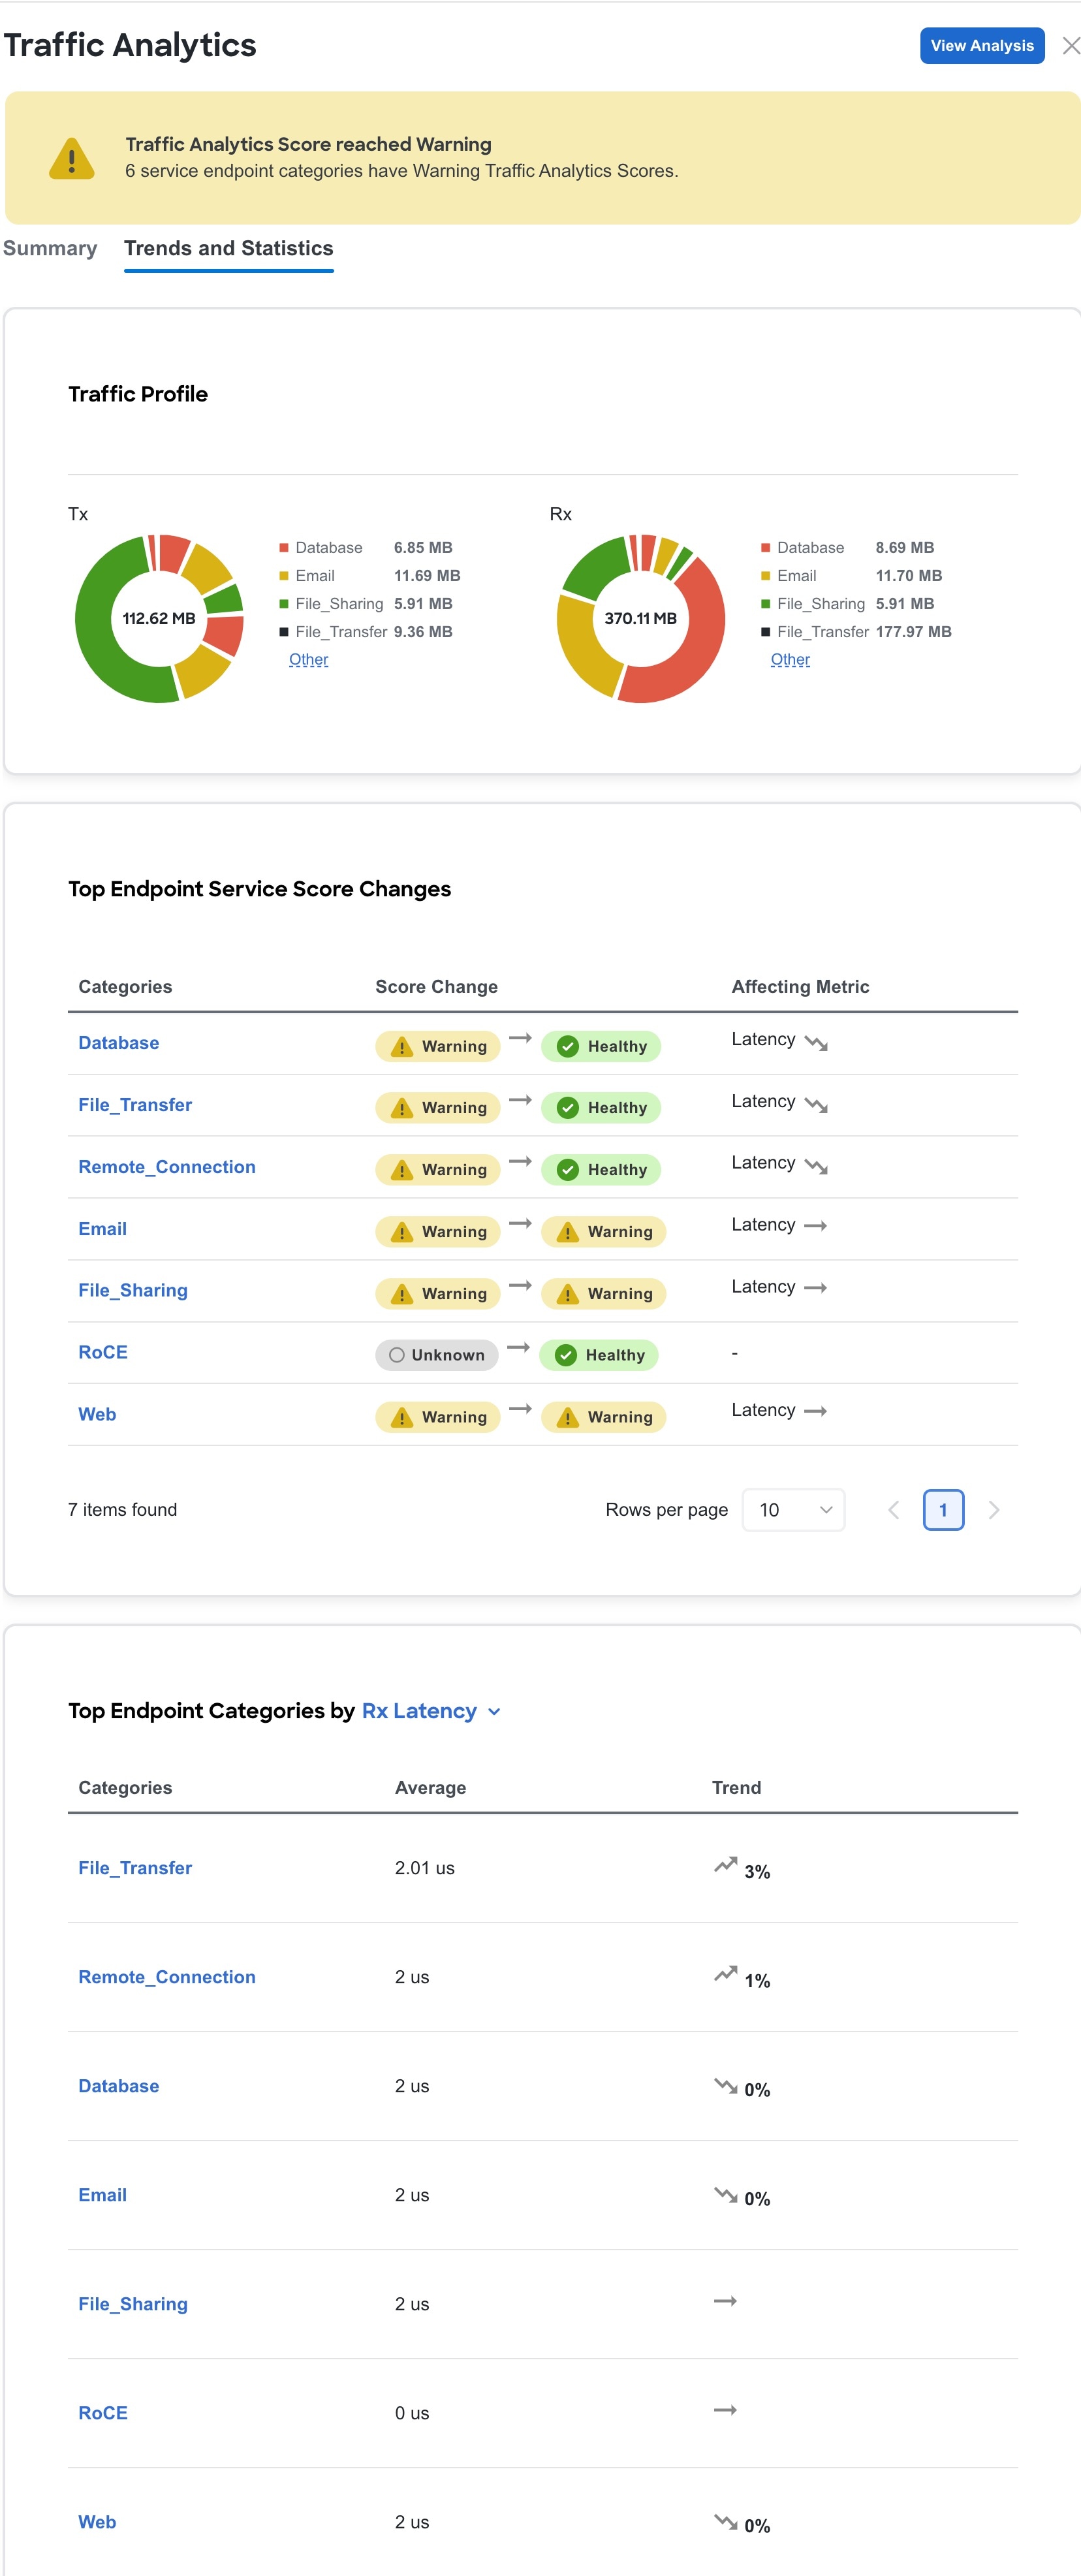
-
In the Traffic Profile area you can view the traffic amount for the endpoint service category.
-
In the Top Endpoint Service Score Changes area, you can view the anomaly score change across the chosen time range and the metrics (such as latency, congestion, or drops) affecting the score change.
-
In the Top Endpoint Categories by area you can see the top categories by Rx and Tx Latency, Congestion Score, and Drop Score.
-
-
Click View Analysis to view traffic analytics for all the fabrics.
View traffic analytics for all fabrics
Follow these steps to view traffic analytics for all fabrics.
-
Navigate to Analyze > Analyze Hub > Traffic analytics.
-
Choose a fabric from the first drop-down list.
-
Choose a time range from the second drop-down list. The default is Current, which specifies that any issues observed over the last 2 hours are displayed.
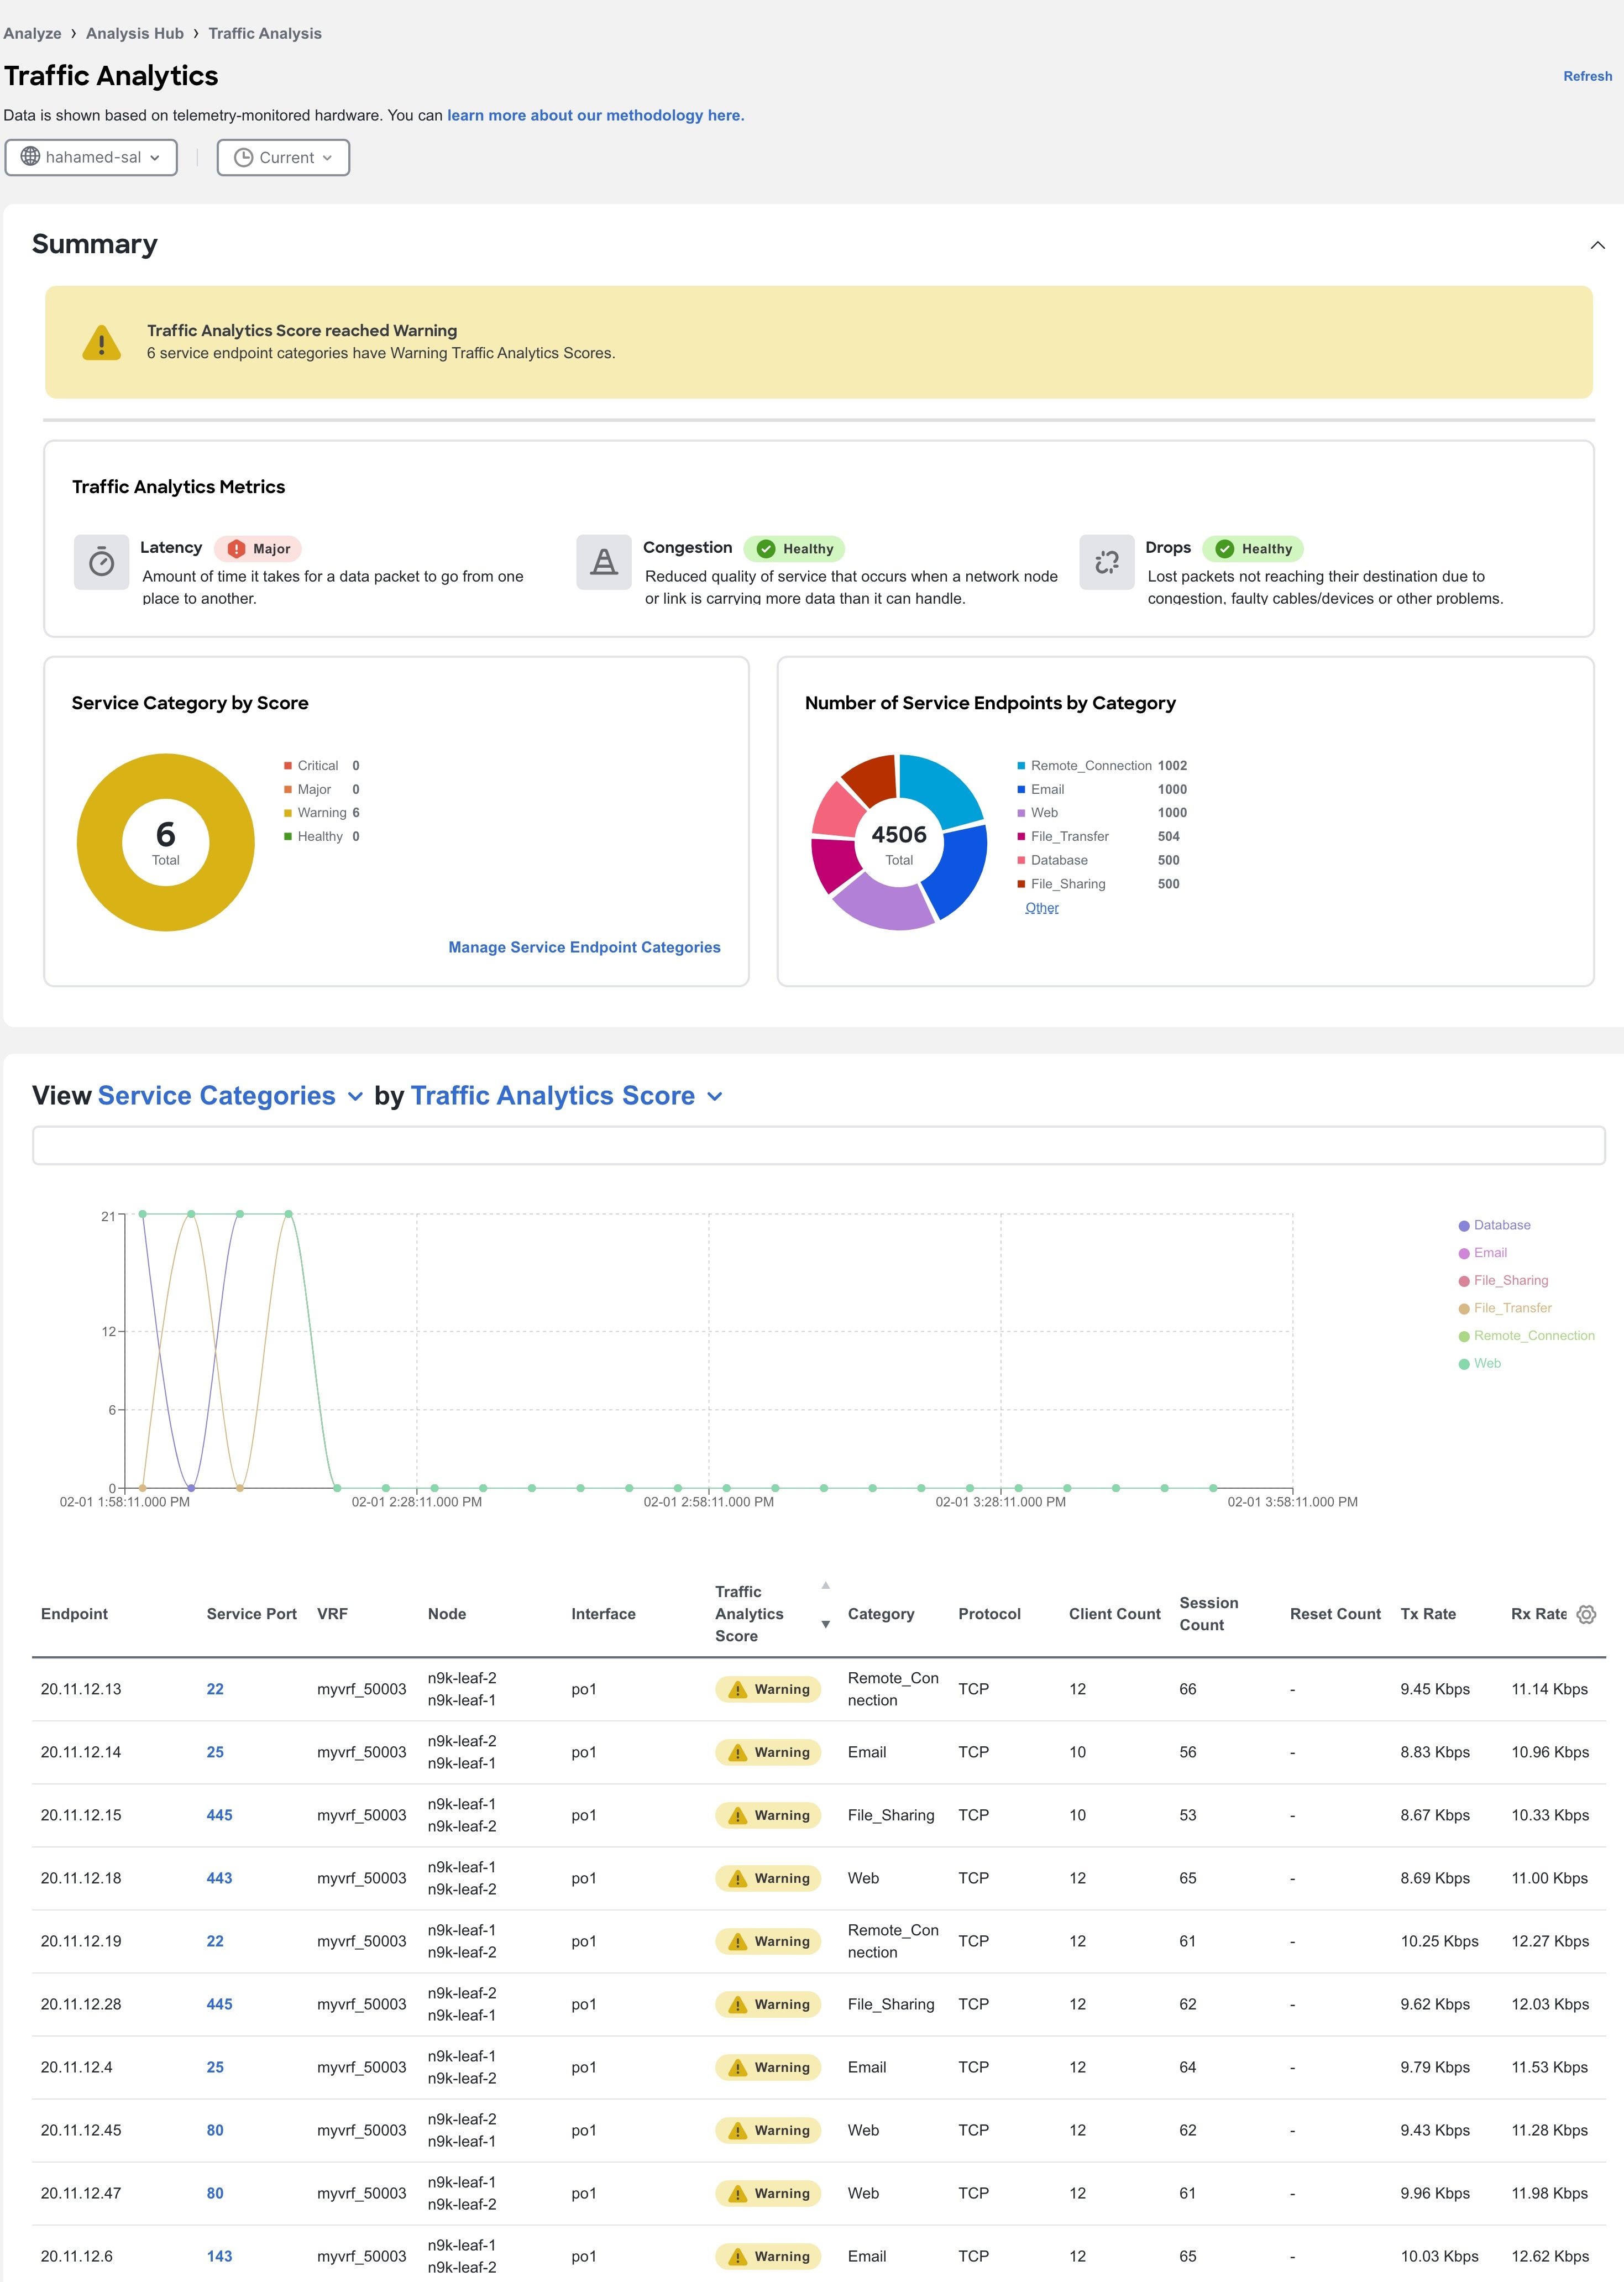
-
The Summary area displays the traffic analytics score and how the metrics are determined.
You can view the information for a service endpoint category by Score and Category. Service endpoint categories consist of ports that have been assigned to categories based on standard networking defaults and any categories you may have created. These categories are dynamic and can be updated any time. See Manage service categories.
-
Use the drop-down list to view the Service Categories or Service Endpoints information for attributes such as Traffic Score, Congestion Score, Latency Score, and Drop Score in a graphical format. When you choose Service Endpoints, you can also view the top 10 endpoints for various attributes such as Traffic Analytic Score, Latency Score, Congestion Score, Drop Score, Session Count, Reset Count, TX Rate, and Rx Rate. For Current Time, when you choose view Service Categories for Traffic Analytics Score, you can use the graph to view the transition between healthy and unhealthy score.
-
In the traffic analytics table, you can view the service categories or service endpoints information. The Traffic Score information for service endpoints is a combination of congestion score, latency score, and drop score. When the score is calculated, congestion score has the lowest weighage, and drop score has the highest weighage.
-
You can hover on the Traffic Analytics Score column to view the Traffic Analytics Score breakdown for the service.
-
Use the search bar to filter by Service Categories, Service Endpoints values, or other values.
-
Click the gear icon to configure the columns in the traffic analytics table.
-
-
In the table under the graph, click a service port to view information about a service endpoint and its clients. By default, you see the overview.
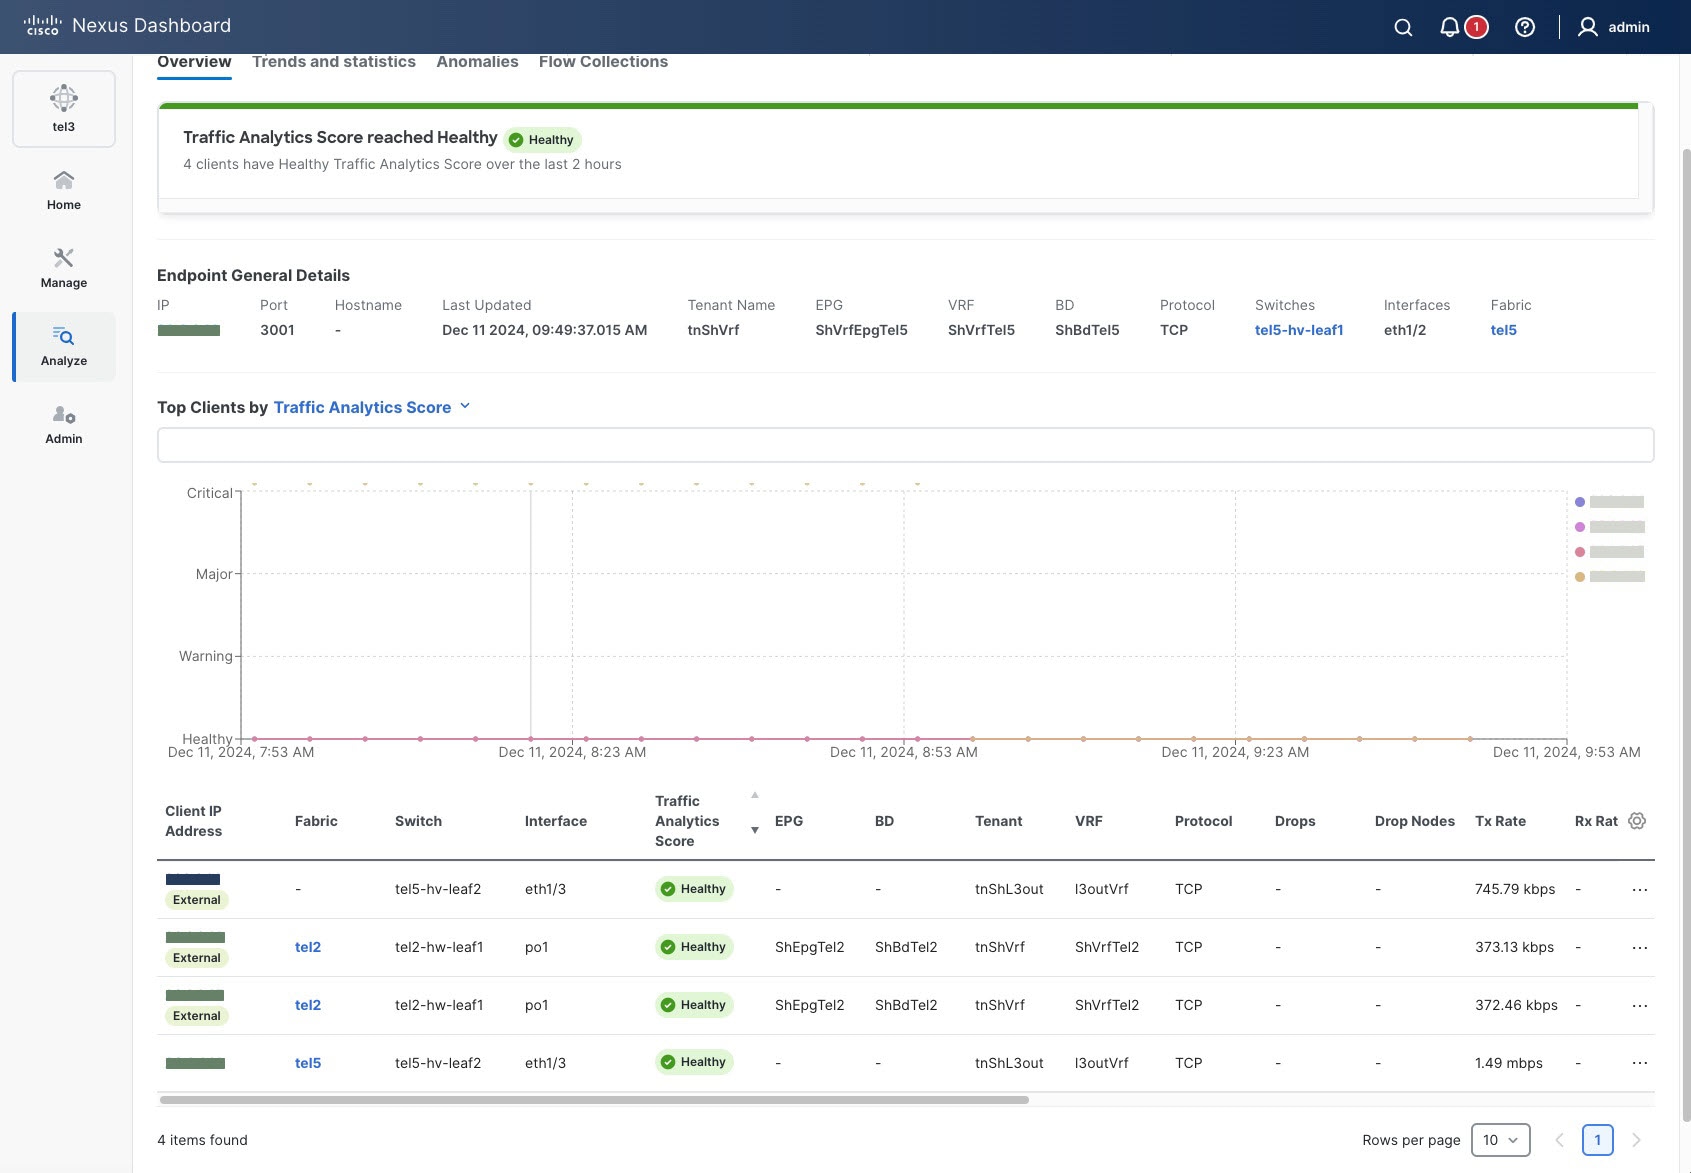
-
Click Overview to view traffic analytics information about the service endpoint.
-
In the Endpoint General Details area, click an IP address to view that endpoint’s details. You can view all services hosted on that endpoint and connections to other services and IP addresses from this endpoint.
-
Use the Top Clients by drop-down list to view the top clients information by traffic analytics score, latency score, drop score, and other stats.
-
In the Top Clients table, hover on the traffic analytics score to view the traffic analytics score breakdown for that client or service.
-
-
Click Trends and Statistics to view the trends such clients, sessions, latency and other stats for that service.
-
Click Anomalies to view the anomalies for the particular service endpoint based on the traffic score.
-
Click Flow Collections to view the flow collections for that service.
-
Manage service categories
In the Manage Service Categories area, you can view the ports that have been assigned to categories based on standard networking defaults and any categories you may have created. If a port has not been assigned to a category, you can assign it to one of the existing categories or create a new category. This helps you to organize and manage your network ports more efficiently.
With this release, in Nexus Dashboard, you can view the UDP conversations in the traffic analytics table along with the TCP conversations. You can create a new category or modify existing category and choose UDP or TCP protocol to view and monitor the conversations.
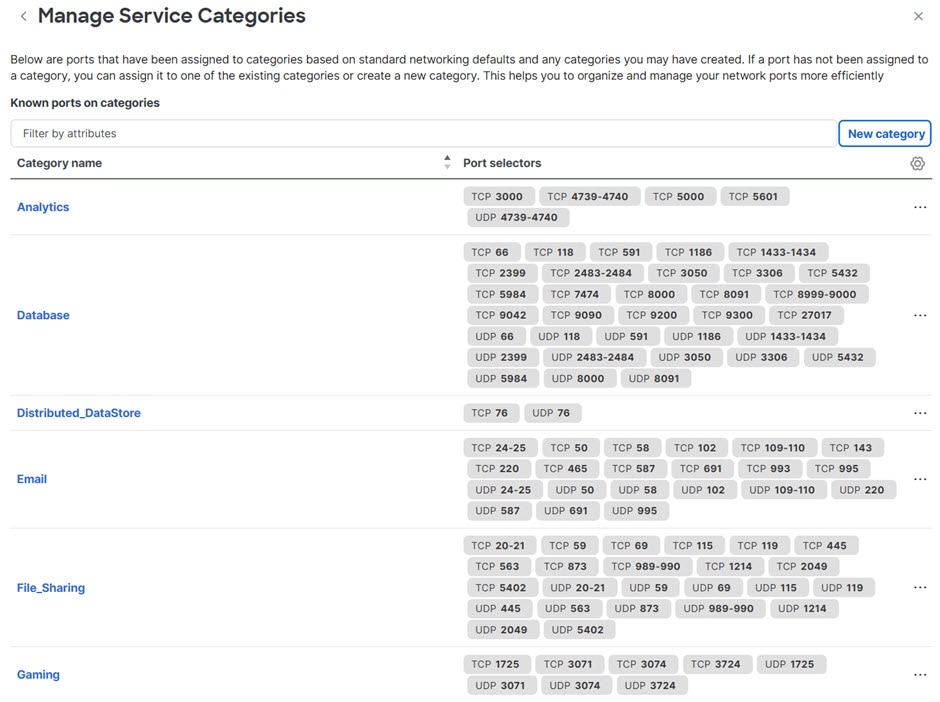
Follow these steps to manage service categories.
-
Navigate to Analyze > Analyze Hub > Traffic analytics.
-
Choose a fabric from the drop-down list.
-
In the Service Category by Score area, click Manage > Fabrics > Edit Fabric Settings.
-
Click Manage service categories.
The Manage Service Categories page appears.
-
Click New category to create a new category.
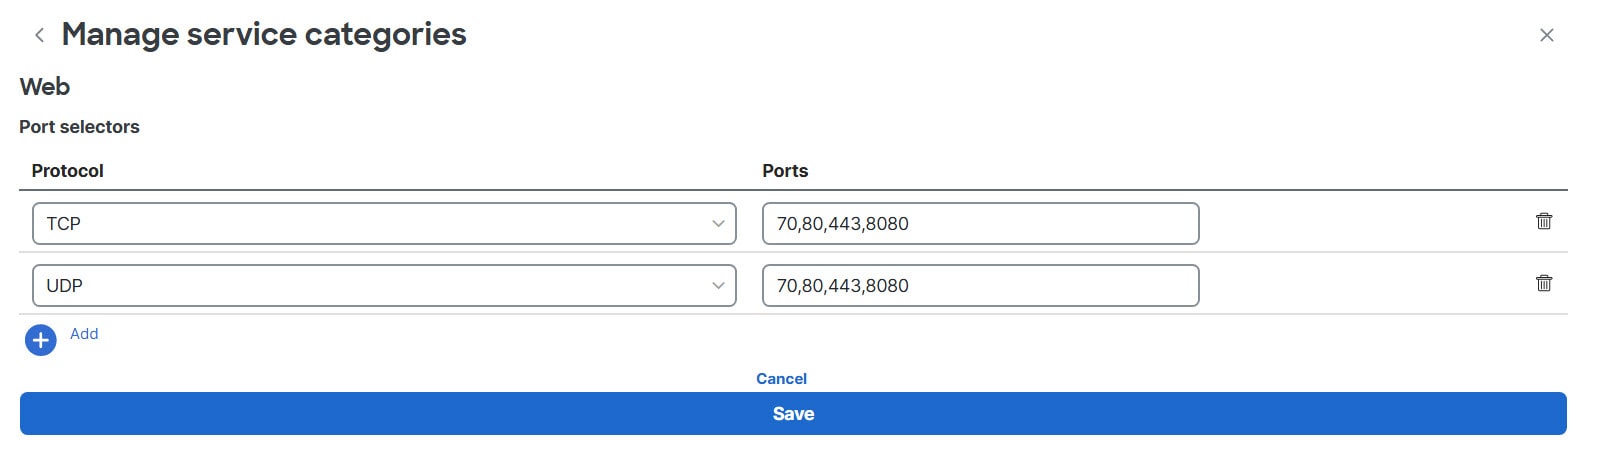
-
Enter the name of the category.
-
From the Protocol drop-down list, choose TCP or UDP protocol.
-
In the Ports field, enter a port number or range.
-
Click Add to add additional protocols.
-
Click Save.
-
To edit a category, click the ellipsis icon and choose Edit.
-
Edit the values and click Save.
-
-
To delete a category, click the ellipsis icon and choose Delete.
-
Click Confirm.
-
Apply filters to restrict traffic analytics for north-south filtering
Follow these steps to apply filters to restrict traffic analytics for north-south filtering.
-
Navigate to the main Fabrics page.
Manage > Fabrics
-
Locate the fabric you want to edit.
-
Click the circle next to the fabric you want to edit, then click Actions > Edit Fabric Settings.
The Edit fabric_name Settings page appears.
-
Click Telemetry > Configuration.
-
Navigate to Flow Collections Modes under Traffic analytics.
-
Choose Traffic analytics full mode.
-
Click Manage service categories and check the Traffic analytics filters rules check box.
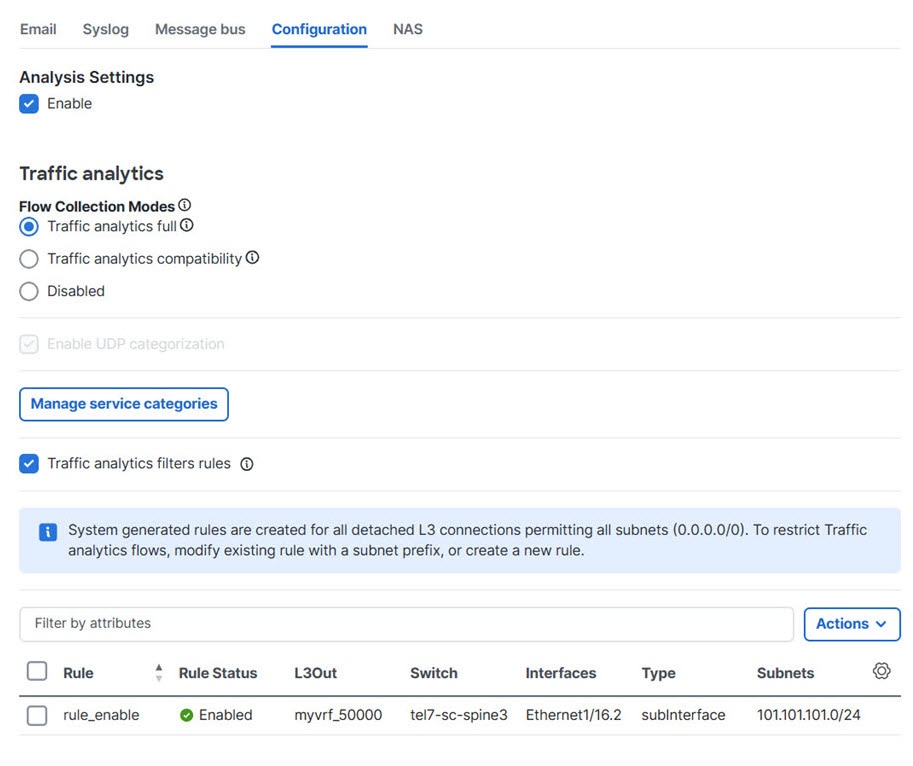
-
Check the check box next to the filter Rule. If you do not have an existing filter rule, you can create a rule, see Create an interface filter rule for details.
-
Click Save.
Create an interface filter rule
Follow these steps to create an interface filter rule.
-
Navigate to the main Fabrics page.
Manage > Fabrics
-
Locate the fabric you want to edit.
-
Click the circle next to the fabric you want to edit, then click Actions > Edit Fabric Settings.
The Edit fabric_name Settings page appears.
-
Click Telemetry > Configuration.
-
Navigate to Flow Collections Modes under Traffic analytics.
-
Choose Traffic analytics full mode.
-
Click Manage service categories and check the Traffic analytics filters rules check box.
-
Click the Actions drop-down list and choose Create.
The Edit fabric_name Settings page appears.
-
Enter the appropriate values for the fields.
The field information for creating filters differs depending on the fabric for which you are creating filter rules.
-
For ACI fabrics, enter a value for these fields.
-
Rule Name — Specify a name for the filter rule.
-
DCI/ISN — Check the check box if this is a Data Center Interconnect (DCI) and Intersite Network (ISN) connectivity. This field is only applicable for ACI fabrics.
-
Enable Rule — Check the check box to enable this rule for your fabric.
-
Tenant — Click on the plus sign to add these tenant field values.
-
L3Out — Choose the Layer 3 out or external-routed network.
-
Switch — Specify the switch name.
-
Interfaces/VLAN — Specify the interfaces/VLAN information.
-
Subnet — Enter one or more subnet IP addresses and press the Enter key from your keyboard.
-
-
For NX-OS fabrics, enter a value for these field.
You must create VRF Lite connectivity before creating the filter rules. For more information on VRF Lite connectivity, see the "Establishing inter-fabric connectivity using VRF Lite" section in Working with Connectivity in Your Nexus Dashboard LAN Fabrics.
-
Rule Name — Specify a name for the filter rule.
-
Enable Rule — Check the check box to enable this rule for your fabric.
-
VRF — Click the plus sign and choose a VRF name from the drop-down list.
-
Switch — Choose a switch name from the drop-down list.
-
Interfaces — Choose interfaces from the drop-down list, check the check box for each interface you want to add for this rule.
-
Click on the check icon to save the information.
-
Click the plus sign to add interfaces.
-
Subnet — Enter one or more subnet IP addresses and press the Enter key from your keyboard.
-
-
-
Click Save to save this rule.
In addition to creating filter rules, you can perform edit (modify), disable, enable, or delete actions using the Actions drop-down list.
-
Check the check box next to the filter rule, click Actions.
-
Choose Edit to modify the filter rule. Note that you cannot modify the name of an existing rule.
-
Choose Enable to enable the filter rule or re-enable the rule that you disabled.
-
Choose Disable to disable the filter rule. Once the rule is disabled, the filter rule remains in the system but stays inactive.
-
Choose Delete to delete the filter rule for the fabric.
-
-
View traffic analytics for endpoints
Follow these steps to view Traffic analytics for endpoints.
-
Navigate to Manage > Fabrics.
-
Click the fabric name.
-
Navigate to Connectivity > Endpoints.
-
In the Endpoint table click an IP address.
-
In the IP details page, click Traffic analytics tab to display the Traffic analytics view for endpoints.
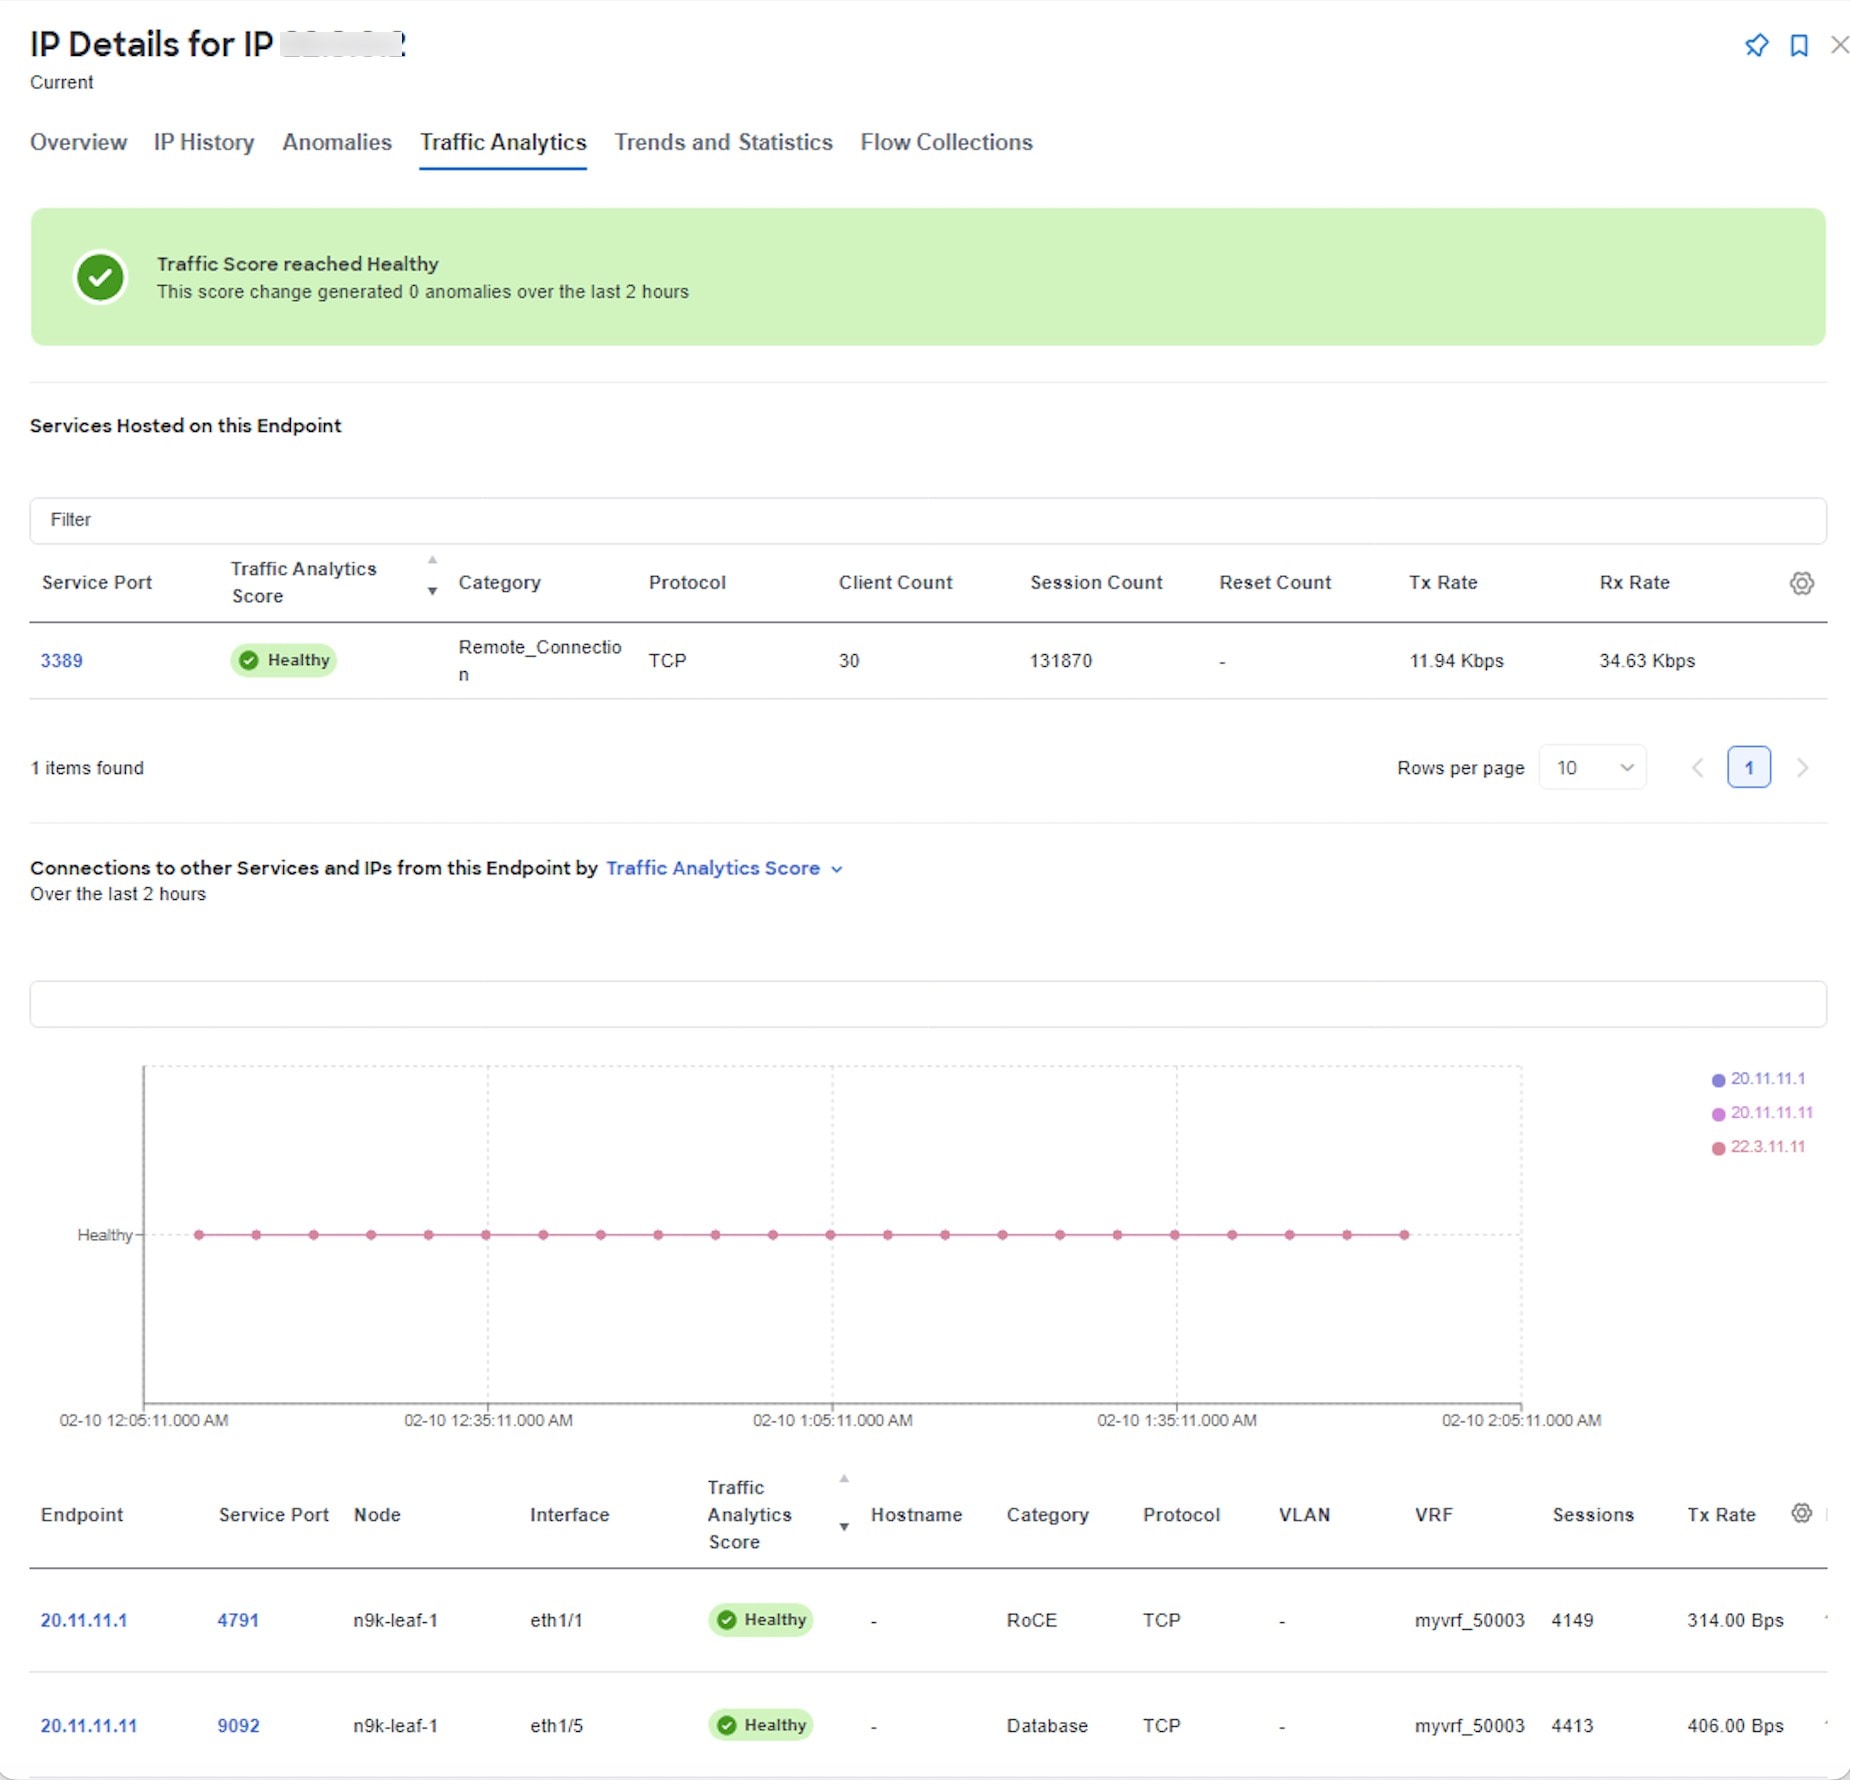
-
View traffic analytics for service endpoints
You can view the service endpoint details from the Analysis hub page.
Follow these steps to view Service Endpoint details.
-
Navigate to Analyze > Analysis hub > Traffic analytics.
-
Scroll down to the Service Endpoints table.
-
Click on a port number listed in the Service port column in the endpoints table to view the Service Endpoints Details page.
-
In the Service Endpoints Details page, scroll down to the Client Endpoint table to view the Client Endpoint, Attributes, L4-L7 cluster, L4-L7 attach, and other field information.
The Attributes column displays various flags, an "L4-L7" flag indicates the flow is passing through an L4-L7 device.
The L4-L7 cluster column displays the name of the device and interface details if the interface details are available. The L4-L7 attach column displays where it is attached.
For example, you can click on the service port 80 for the endpoint
51.1.1.250to launch the Service Endpoint Details page for the endpoint51.1.1.250.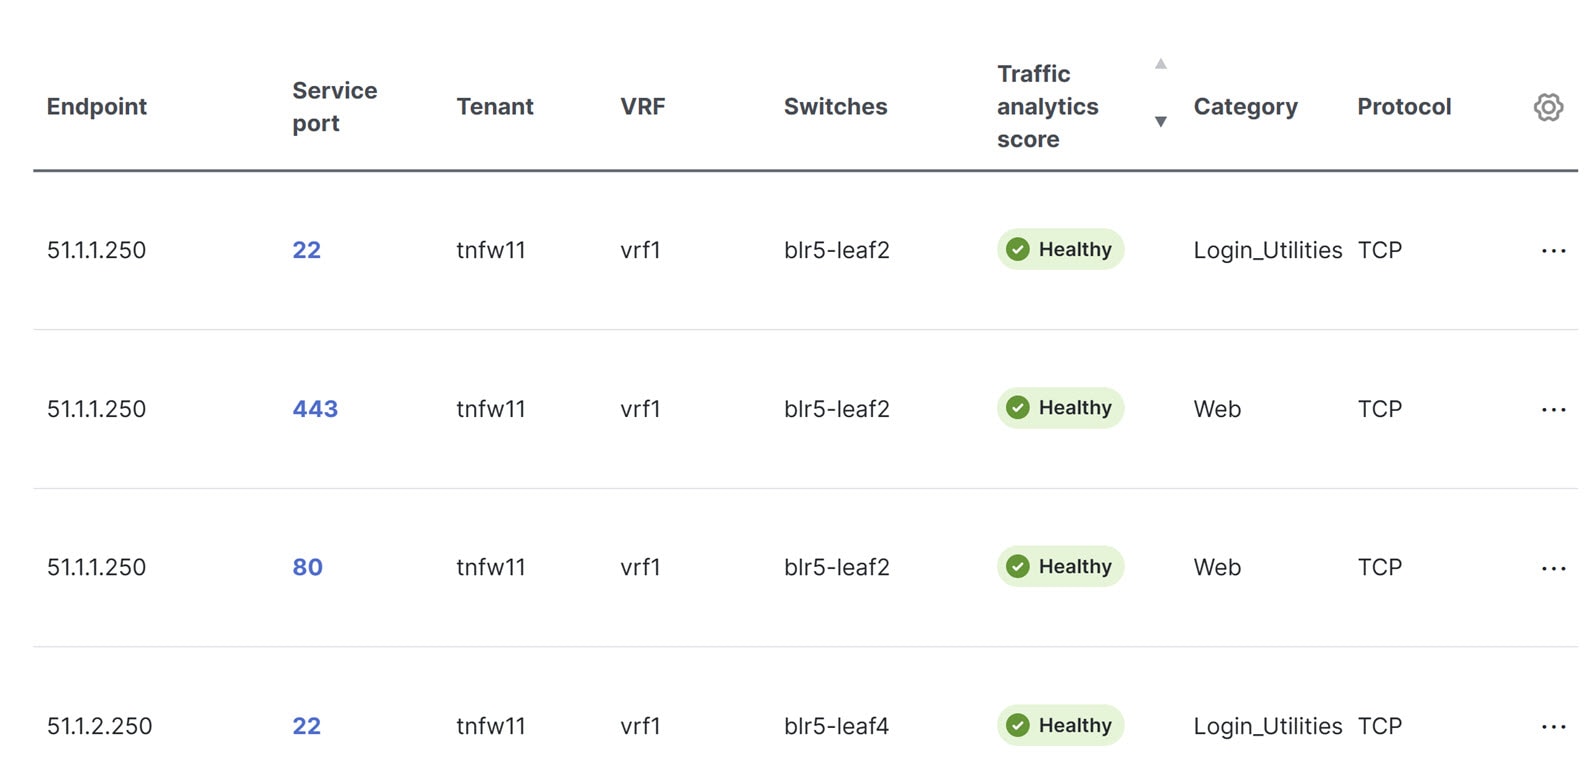
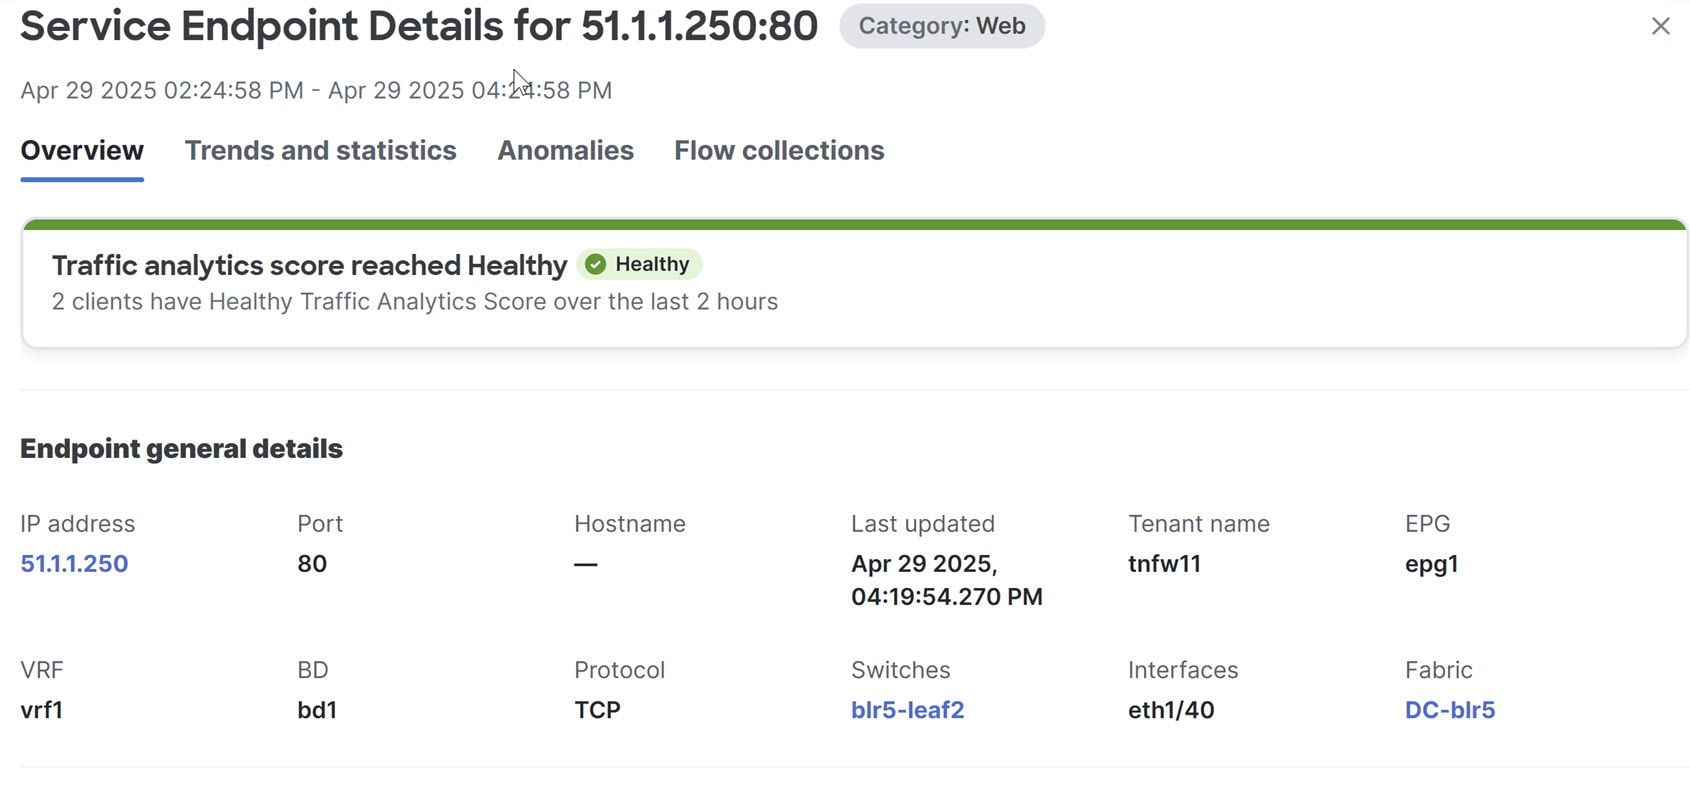
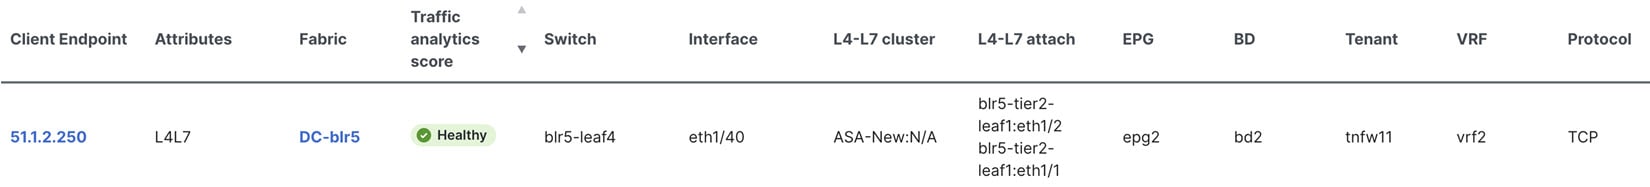
The L4-L7 value in the Attribute column for the Client Endpoint
51.1.2.5indicates traffic flowing through an L4-L7 device.The L4-L7 cluster column displays the name of the device and interface details, if the interface details are available. The L4-L7 attach column displays where it is attached.
View service endpoint details for a fabric
Follow these steps to view service endpoint details for a fabric.
-
Navigate to Manage > Fabrics page.
-
Click the fabric name.
-
In the fabric overview page, navigate to Connectivity > Endpoints.
You can also navigate to the Connectivity area in your fabric’s Overview page and click on Endpoints to launch the Endpoints page.
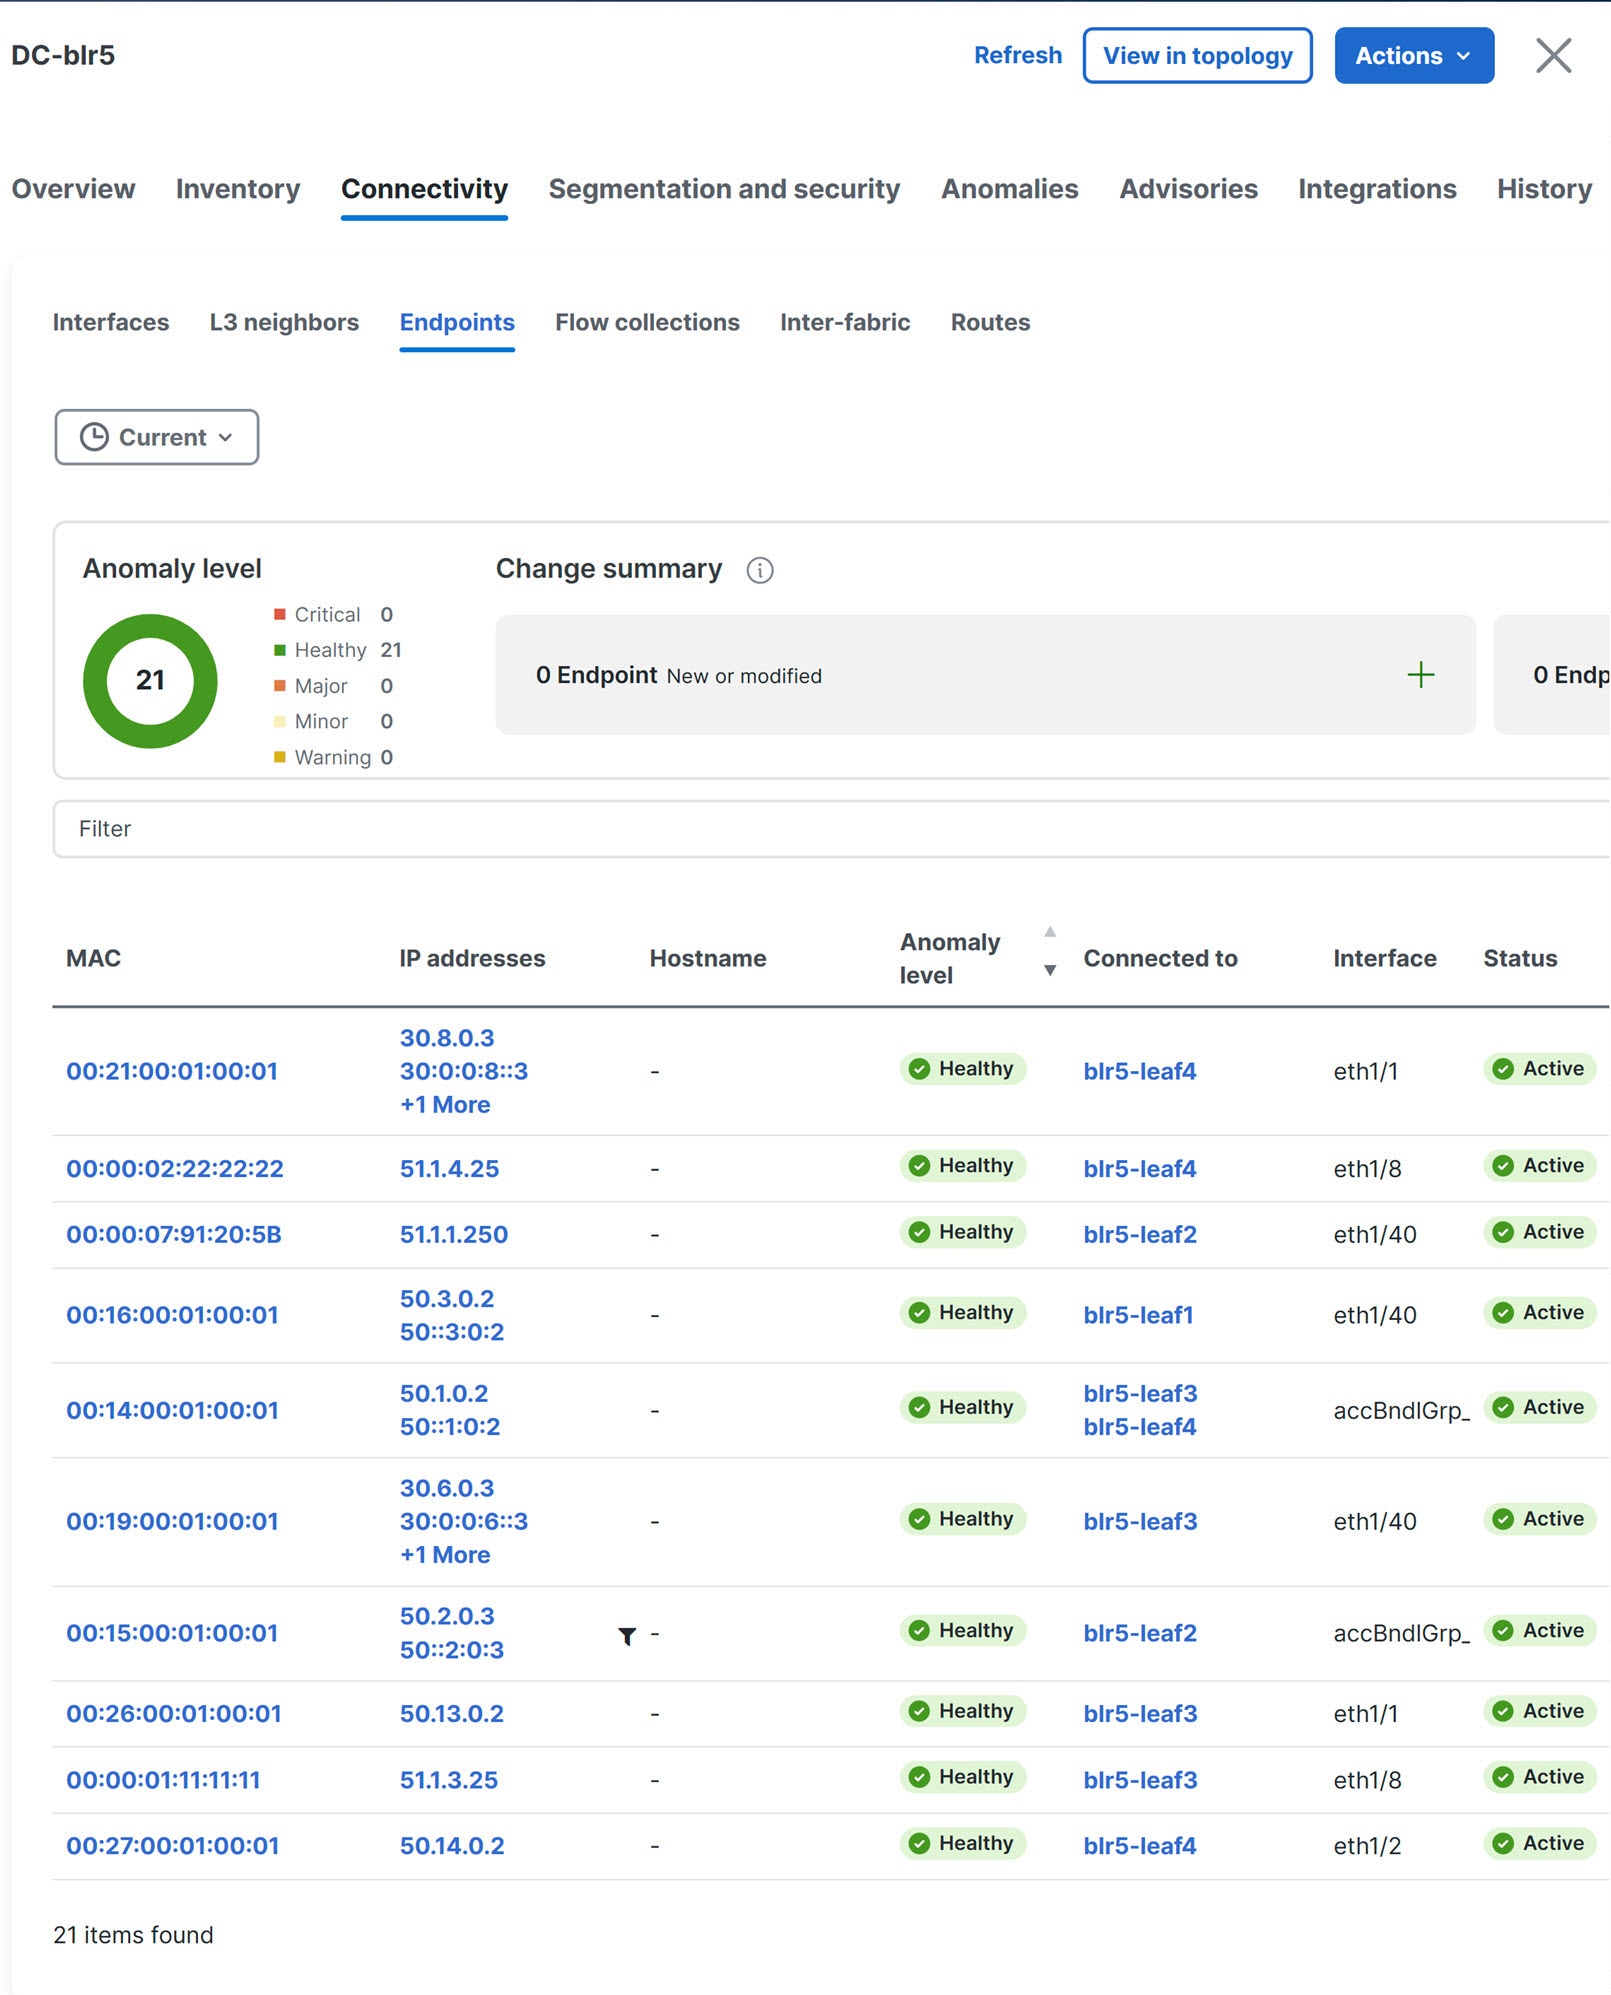
-
Locate the IP address for the endpoint and click on the IP address to launch the IP details page for the endpoint. For example, you can click on the endpoint
51.1.1.250. -
Click on the Traffic analytics tab.
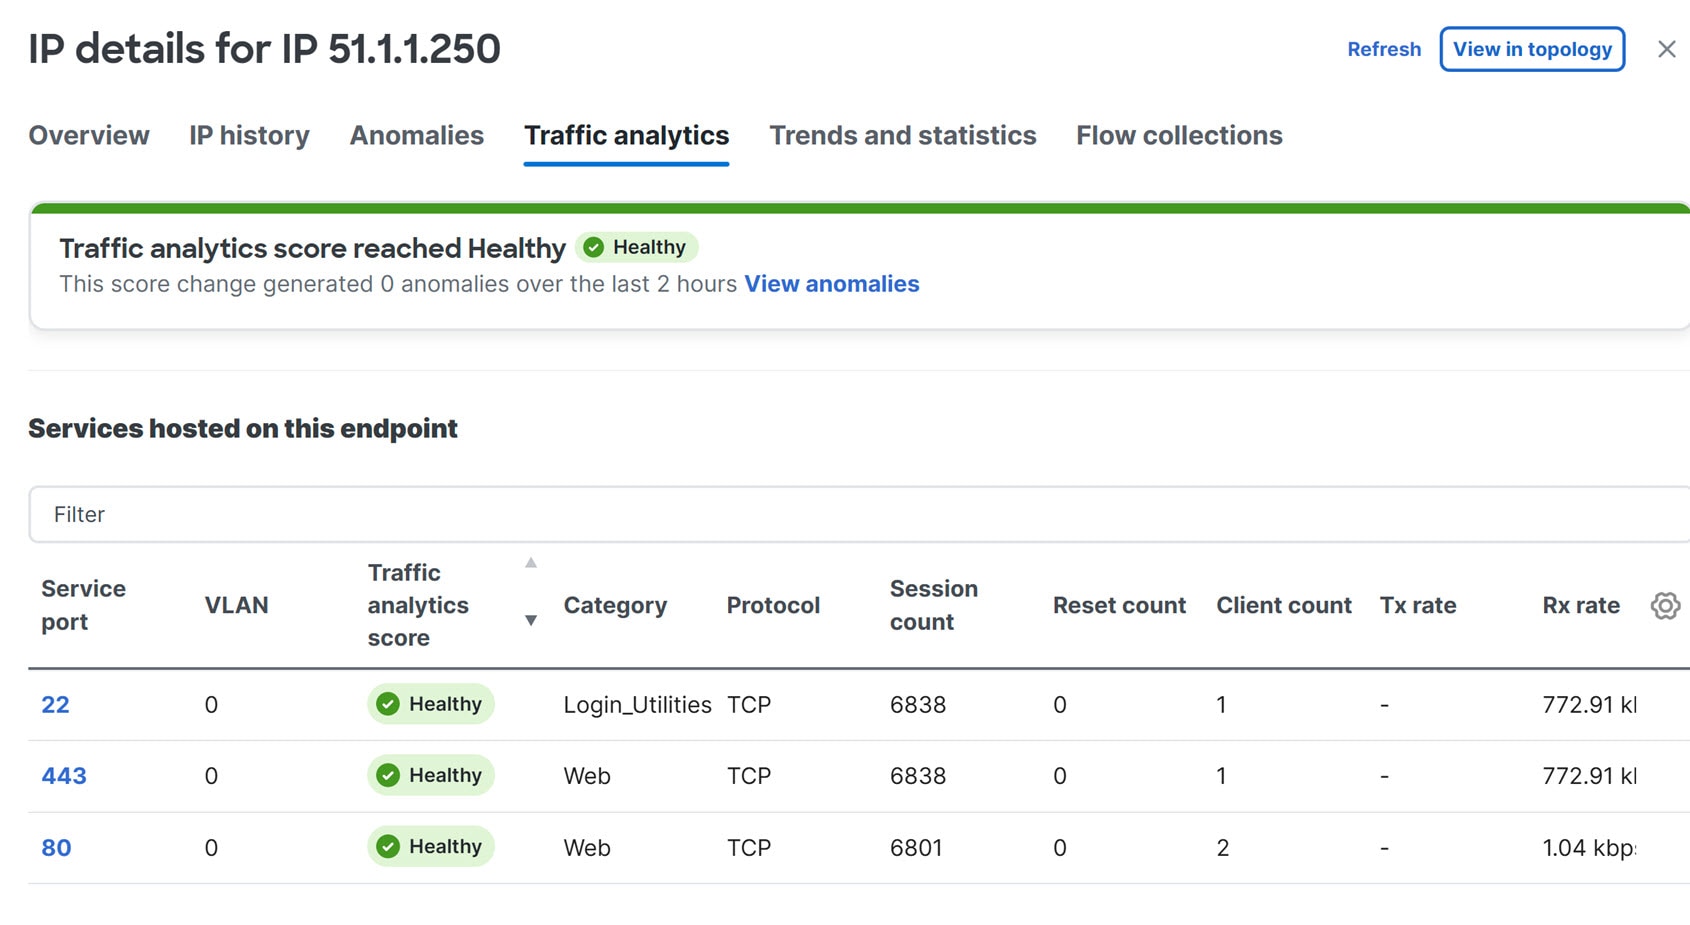
Service port numbers are displayed for TCP traffic, for ICMP traffic, no service port is displayed.
-
In Service hosted on this endpoint table, click on the service port to launch the Service Endpoint Details page for the endpoint. For example, click service port 80 to launch the Service Endpoint Details page for the endpoint 51.1.1.250.80.
Viewing ESG and endpoint association
This section describes how to view the ESGs and endpoints that are associated with ACI fabric.
-
Navigate to the fabrics page.
Manage > Fabrics
-
Click any fabric to view.
The Overview page appears.
-
Click Segmentation and security.
-
Click ESGs (Security Groups).
The ESG details are listed with the endpoint count.
-
Click any number that is displayed in the Endpoints column.
The endpoints associated to ESG page appear with the list of endpoints.
-
-
Click Connectivity.
-
Click Endpoints.
-
Click settings icon, in the Table Configuration page to enable ESG option.
-
Click Save.
The ESG values associated with each endpoint are displayed in the ESG column alongside.
-
-
Click on an endpoint MAC or IP/IPV6 address to view Endpoint Details for the MAC or IP/IPV6.
If the endpoint attribute is associated with an ESG, the configured ESG name is displayed in the ESG field in the Endpoint Details page.
Use the flow troubleshoot workflow
The flow troubleshoot workflow enables you to collect all the flow records between two endpoints. Nexus Dashboard allows you to specify the duration for flow collection and then collect records between specific endpoints for the specified duration. As a result you can view the path visualization, 5-tuple flow information, and any issues seen on individual flows.
The flow troubleshoot workflow feature is not supported in Traffic analytics compatibility mode.
Follow these steps to use the flow troubleshoot workflow.
-
Navigate to Analyze > Analyze Hub > Traffic analytics.
-
Choose a fabric from the drop-down list.
-
Choose a time range from the drop-down list. By default the current time (last 2 hours) is chosen.
-
Click on a port number listed in the Service port column in the endpoints table to view the Service Endpoints Details page.
-
In the Service Endpoint Details page, click the ellipsis icon for a client IP address and choose Start Flow Collection. You might need to scroll all the way to the right in the table of client IP addresses to see the ellipsis icon.
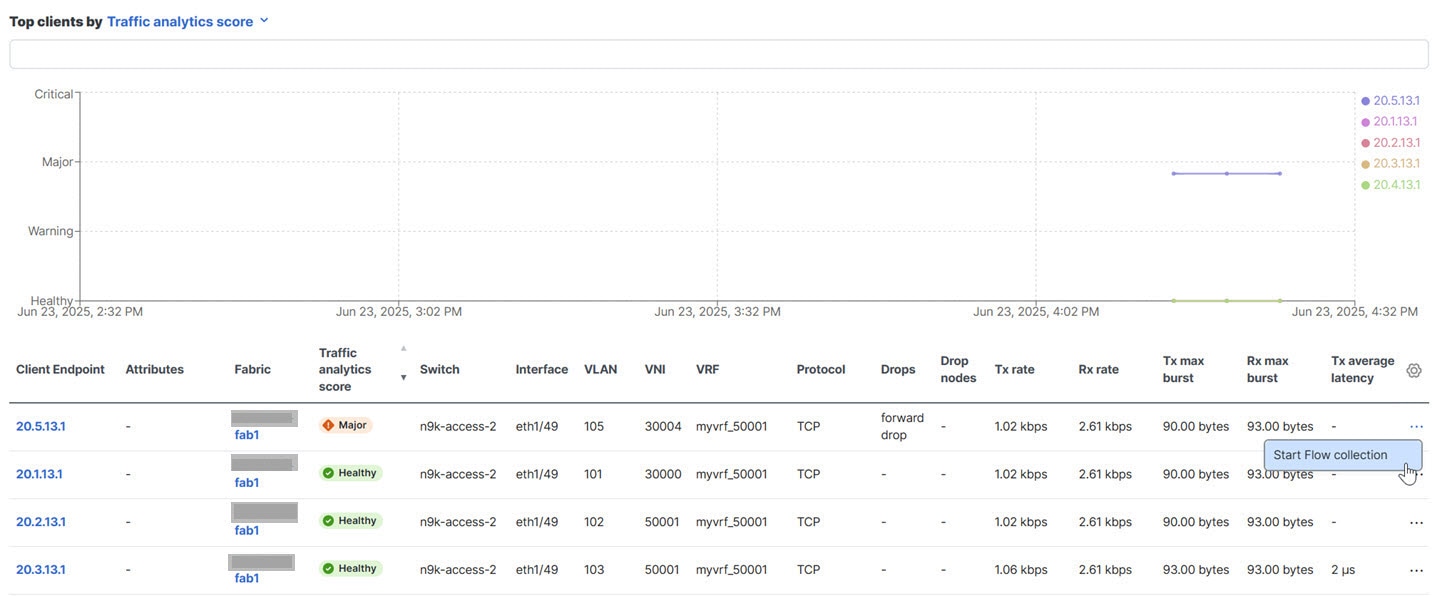
-
Choose the duration to collect flow records for a specific time period. Click Start and go to Flow Collections Tab.
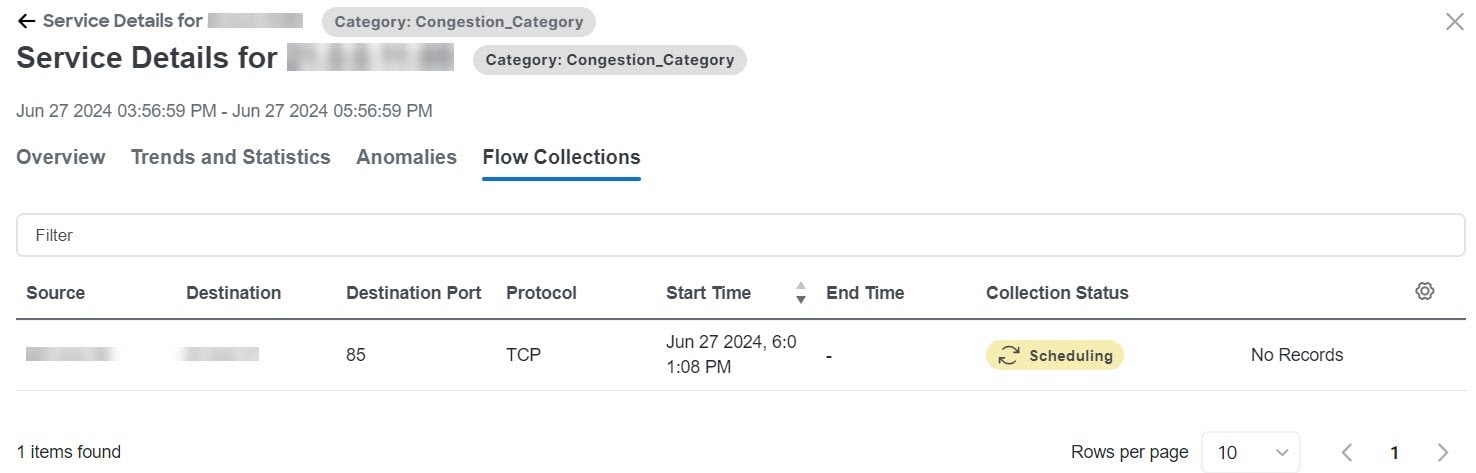
-
After the Collection Status displays Completed, click View Records to view the flow record details for that specific service endpoint.
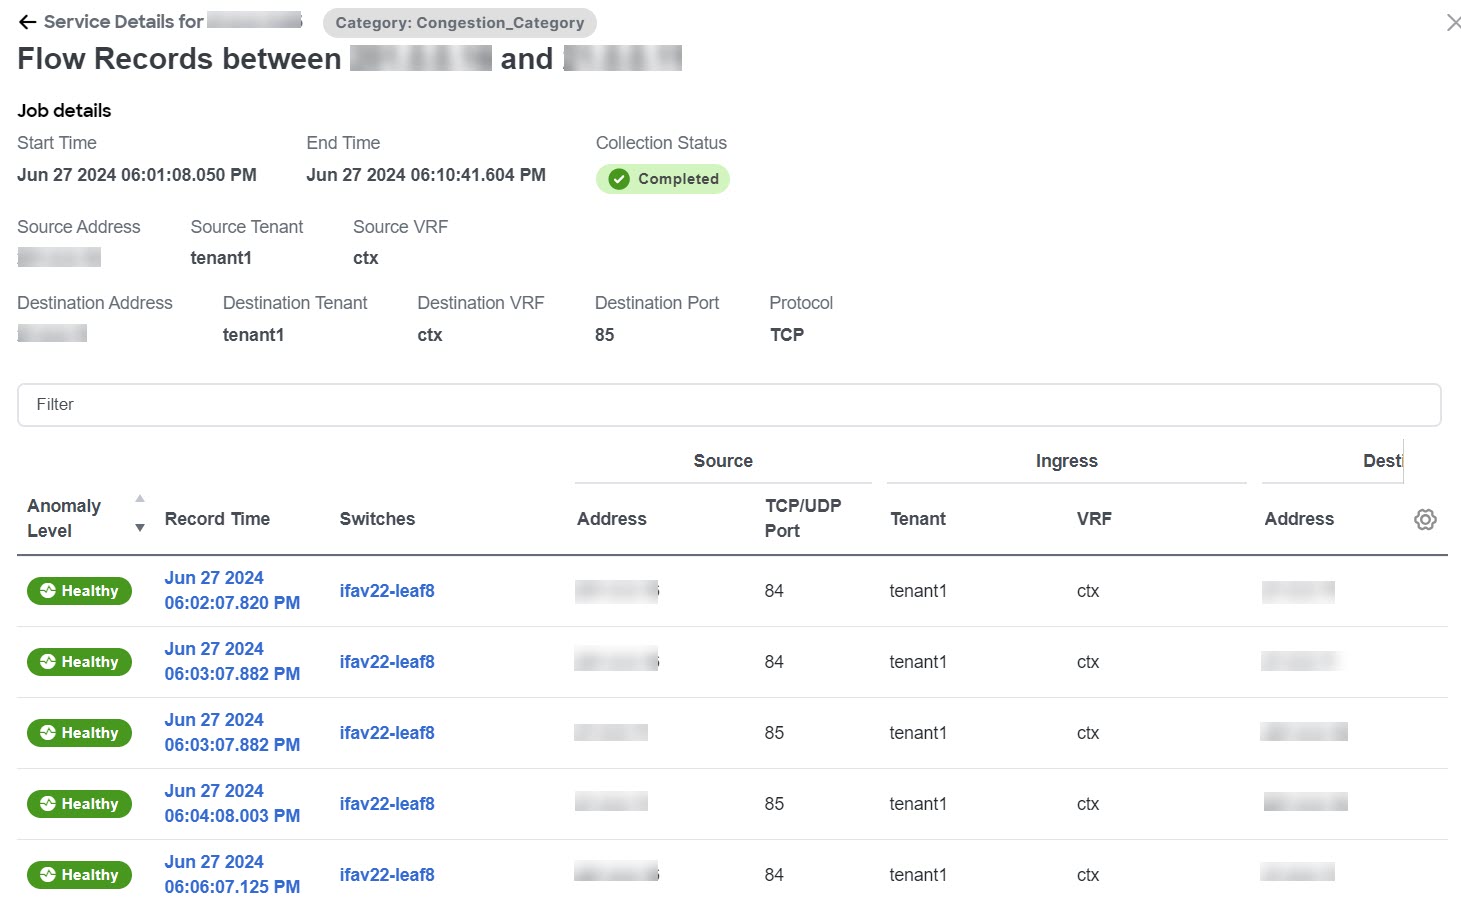
-
To view the flow collection for a fabric, navigate to Manage > Fabrics, choose a fabric, and click Connectivity > Flow Collections.
-
To perform flow collection for non-TCP flows follow these substeps.
-
In the endpoints table, click the service port for an endpoint. The Service Endpoint Details page for that endpoint appears.
-
In the Endpoint general details area, click the IP address. The IP details page for that IP address appears.
-
Click the Traffic analytics tab.
-
In the endpoints table, click the ellipsis icon for an endpoint and choose Start Flow Collection. You might need to scroll all the way to the right in the table of endpoints to see the ellipsis icon.
-
Exploring the energy usage for your network using Sustainability
The Nexus Dashboard sustainability report helps you monitor, predict, and improve your network’s energy usage, its related carbon emissions, and its total energy cost. The sustainability report enables you to get insights on energy utilization, CO2 emissions, and energy cost for all your fabrics on a monthly basis.
The report is generated by calculating the monthly values for Power Consumption and by summing the usage data across all of your devices at each of your fabrics for every single day in the chosen month. This data is then combined with the Cisco Energy Manager to provide greater insight into what that usage means in terms of energy cost, estimated emissions, and estimated switch power consumption. For more information about the Cisco Energy Manager, see Cisco Energy Manager.
The summary area of the report contains information such as estimated cost, estimated switch power consumption, sources of emission, and estimated emissions.
-
Estimated Cost gives you insight into any expected increase or decrease in your fabrics' energy bills based on your monthly energy use.
-
Estimated Switch Power Consumption gives you insight into how efficiently your switches are using electricity. Estimated PDU Power Consumption gives you insight into how much electricity your devices or Panduit power distribution units (PDUs) are using.
-
Estimated Emissions gives you insight into the sustainability your fabrics have on your total CO2 emissions, based on the sources and amount of energy used.
If you have Panduit PDUs onboarded to Nexus Dashboard, you can use the Data Source toggle to see two different electricity values on the sustainability report: one for switches only, and one for PDUs.
-
Switch Data: Uses only the electricity data reported by individual switches added to a fabric.
-
PDU Data: Uses the electricity data reported by a supported PDU, which could include switches, fans, and any other devices physically plugged into the PDU.
Depending on which value you choose in the Data Source toggle, the values calculated for your other metrics, including estimated cost and emissions, will vary.
The retention time for the sustainability report in Nexus Dashboard is 12 months.
Cisco Energy Manager
The Cisco Energy Manager is a service developed by Cisco that collects data from various data providers and consolidates the GHG emissions and the source of the energy from the data. The Cisco Energy Manager is hosted in a Cisco Intersight cloud.
View the sustainability report for switches
-
Navigate to Analyze > Analysis Hub > Sustainability Report.
-
Choose an online fabric or multiple online fabrics from the drop-down menu.
-
Choose a time range from the drop-down menu.
-
Use the Display data from toggle to display data from switches.
-
Click Prepare Report.
The sustainability report displays At A Glance, Cost, Energy, and Emissions information for a particular fabric in the chosen month.
-
Examine the At A Glance area to see a summary of the estimated cost, estimated switch power consumption, and estimated emissions in the chosen month. Click the Learn More icon for more information.
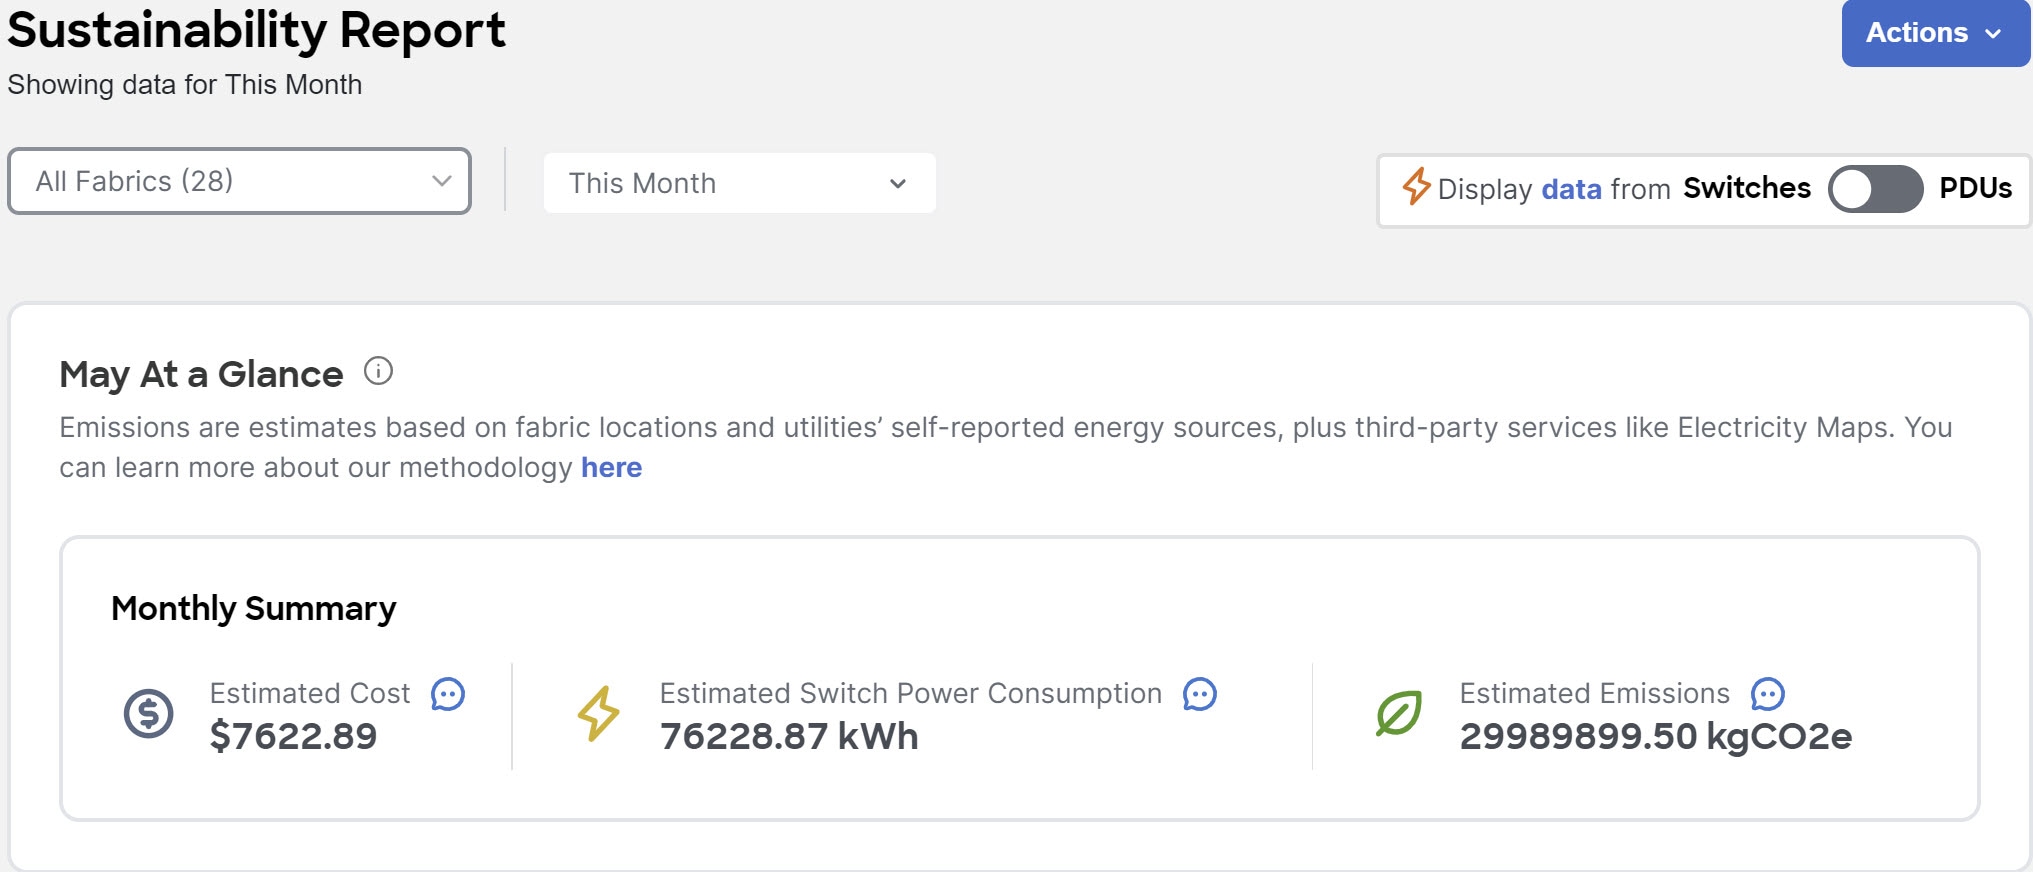
-
Examine the Cost area to see the estimated daily cost in the chosen month and share of daily cost per fabric.
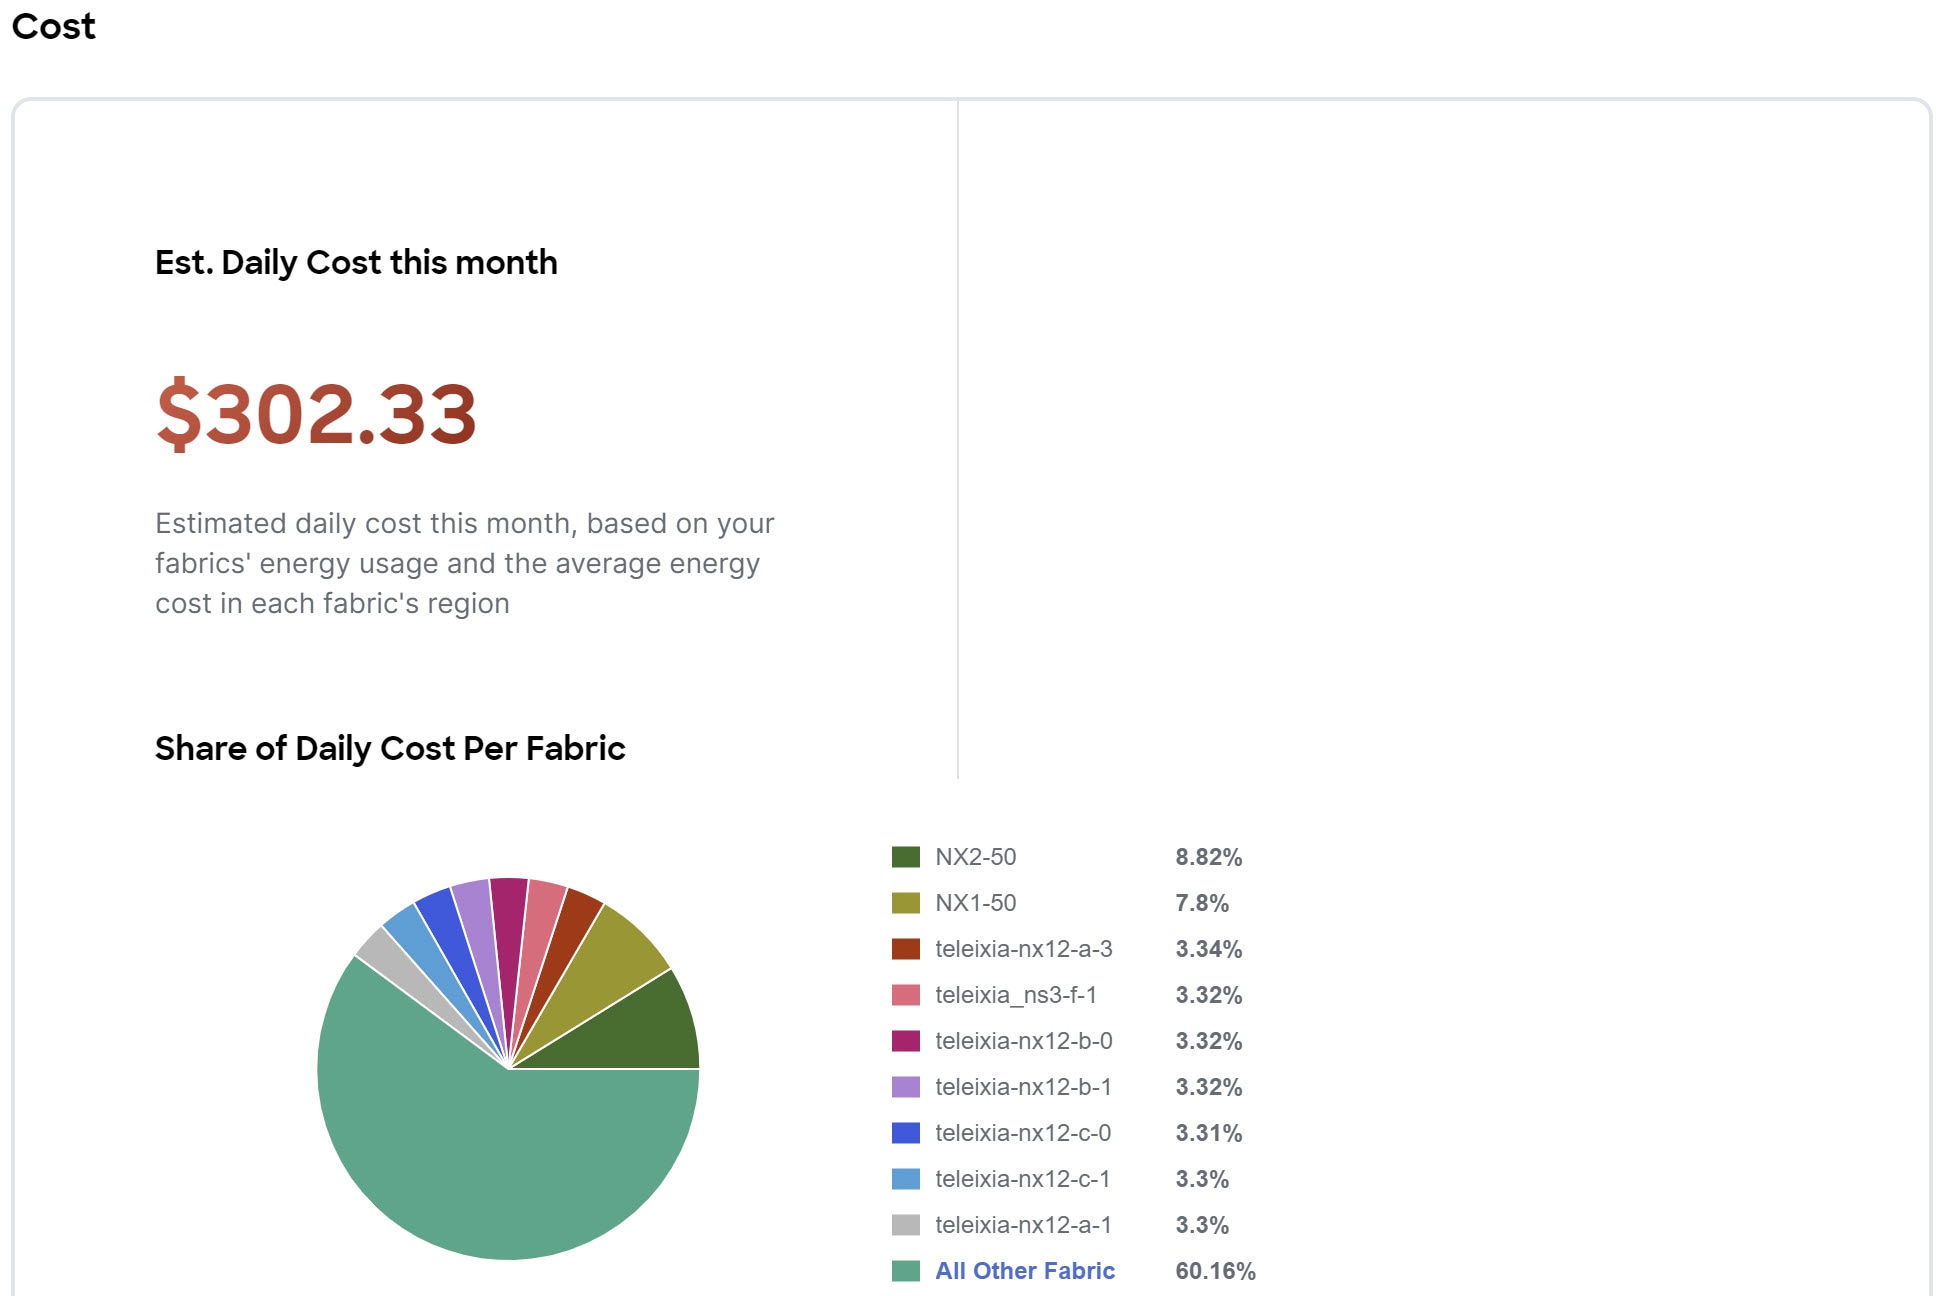
-
(Optional) From the Actions menu, choose Fabric Energy Settings to customize your average cost for the current month for a more accurate estimate. To calculate cost estimates, Nexus Dashboard uses values based on the average cost of grid energy for each region.
-
Examine the Energy area to see the energy usage in the chosen month in kWh.
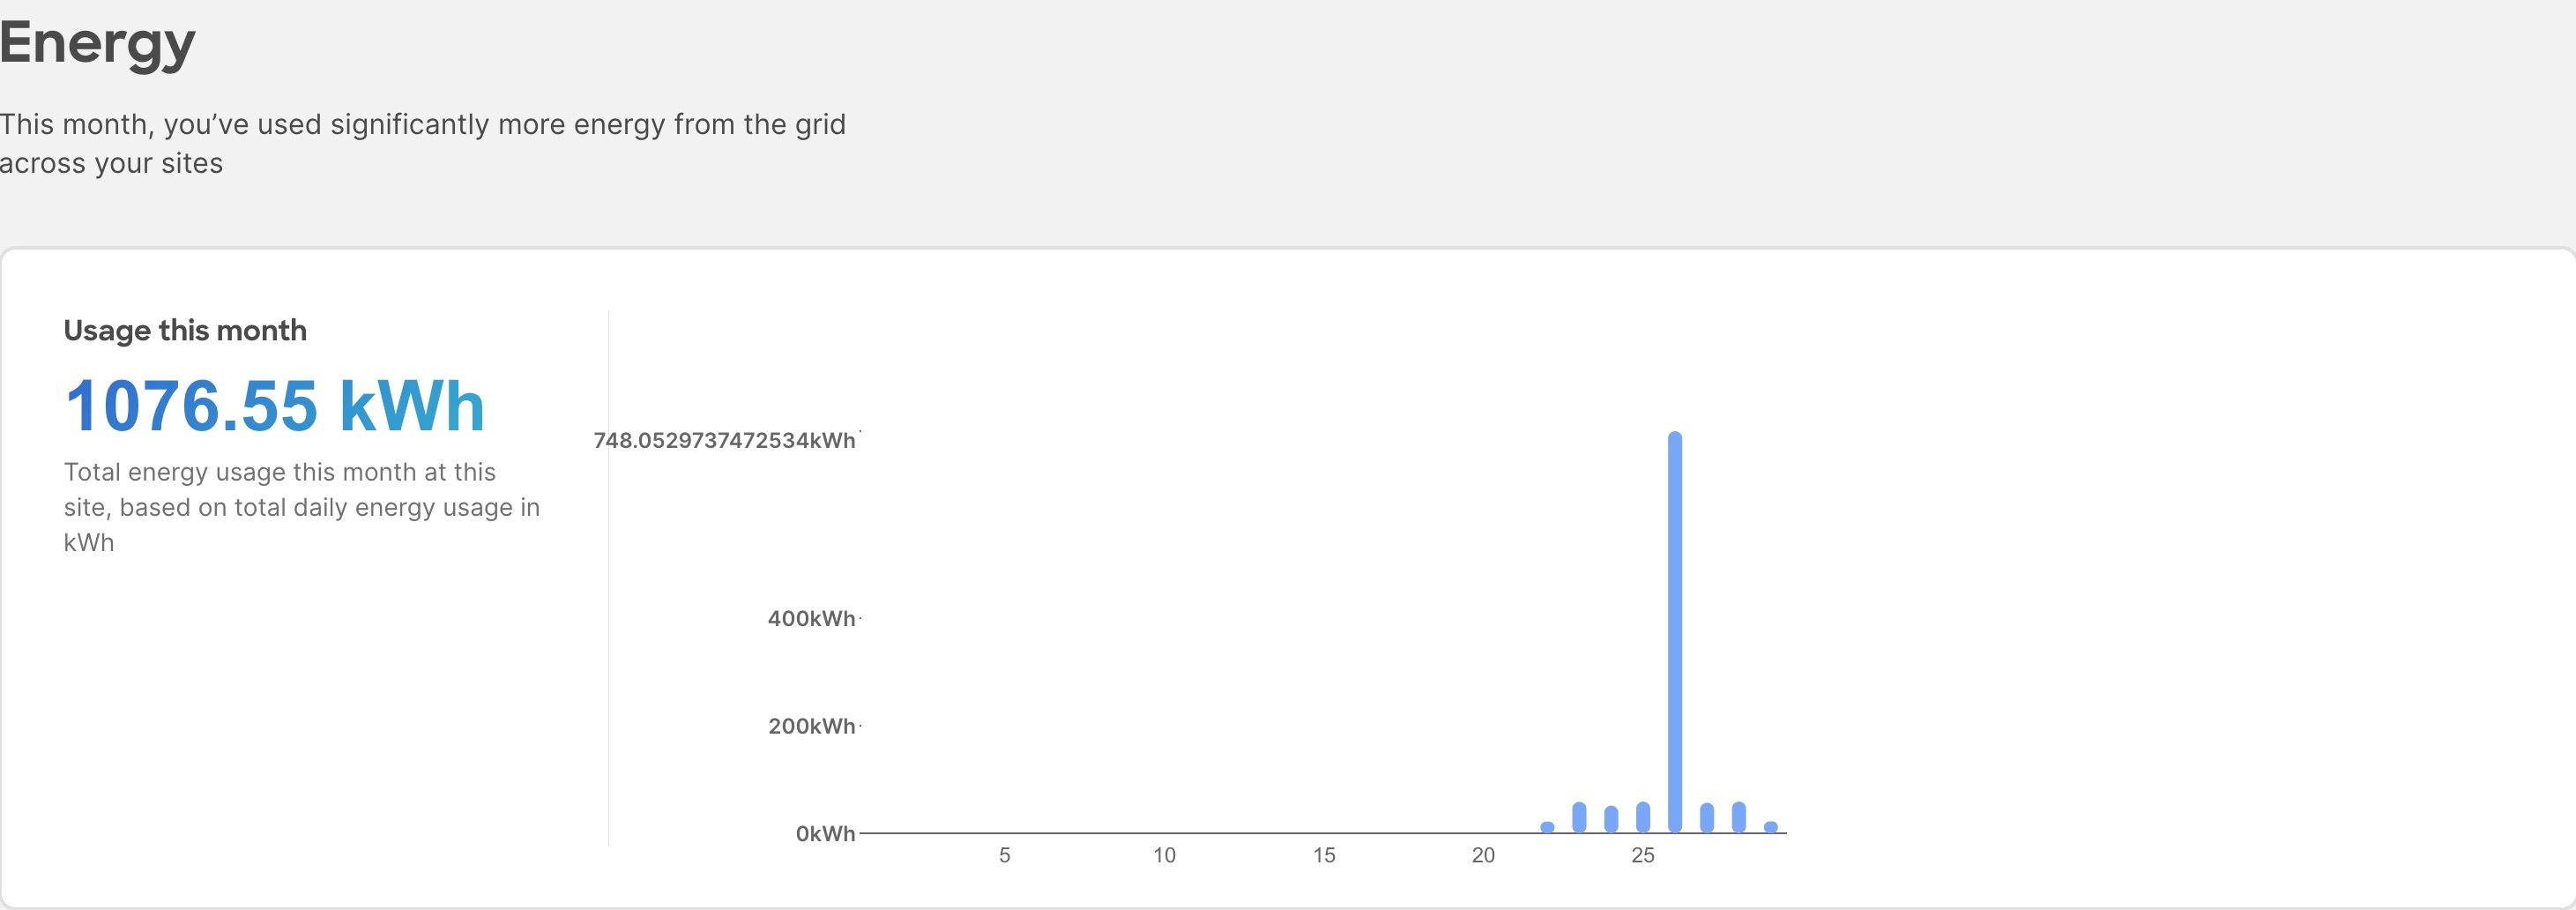
-
Examine the Emissions area to see the total emissions or efficiency index per fabric, estimated monthly carbon dioxide equivalent emissions, average percentage of energy from low-carbon sources and other sources, and percent of total energy used during each three-hour reporting period by source over all of the days in the chosen month.
For total emissions or efficiency index per fabric, use the toggle to view the information in graphical format or tabular format.
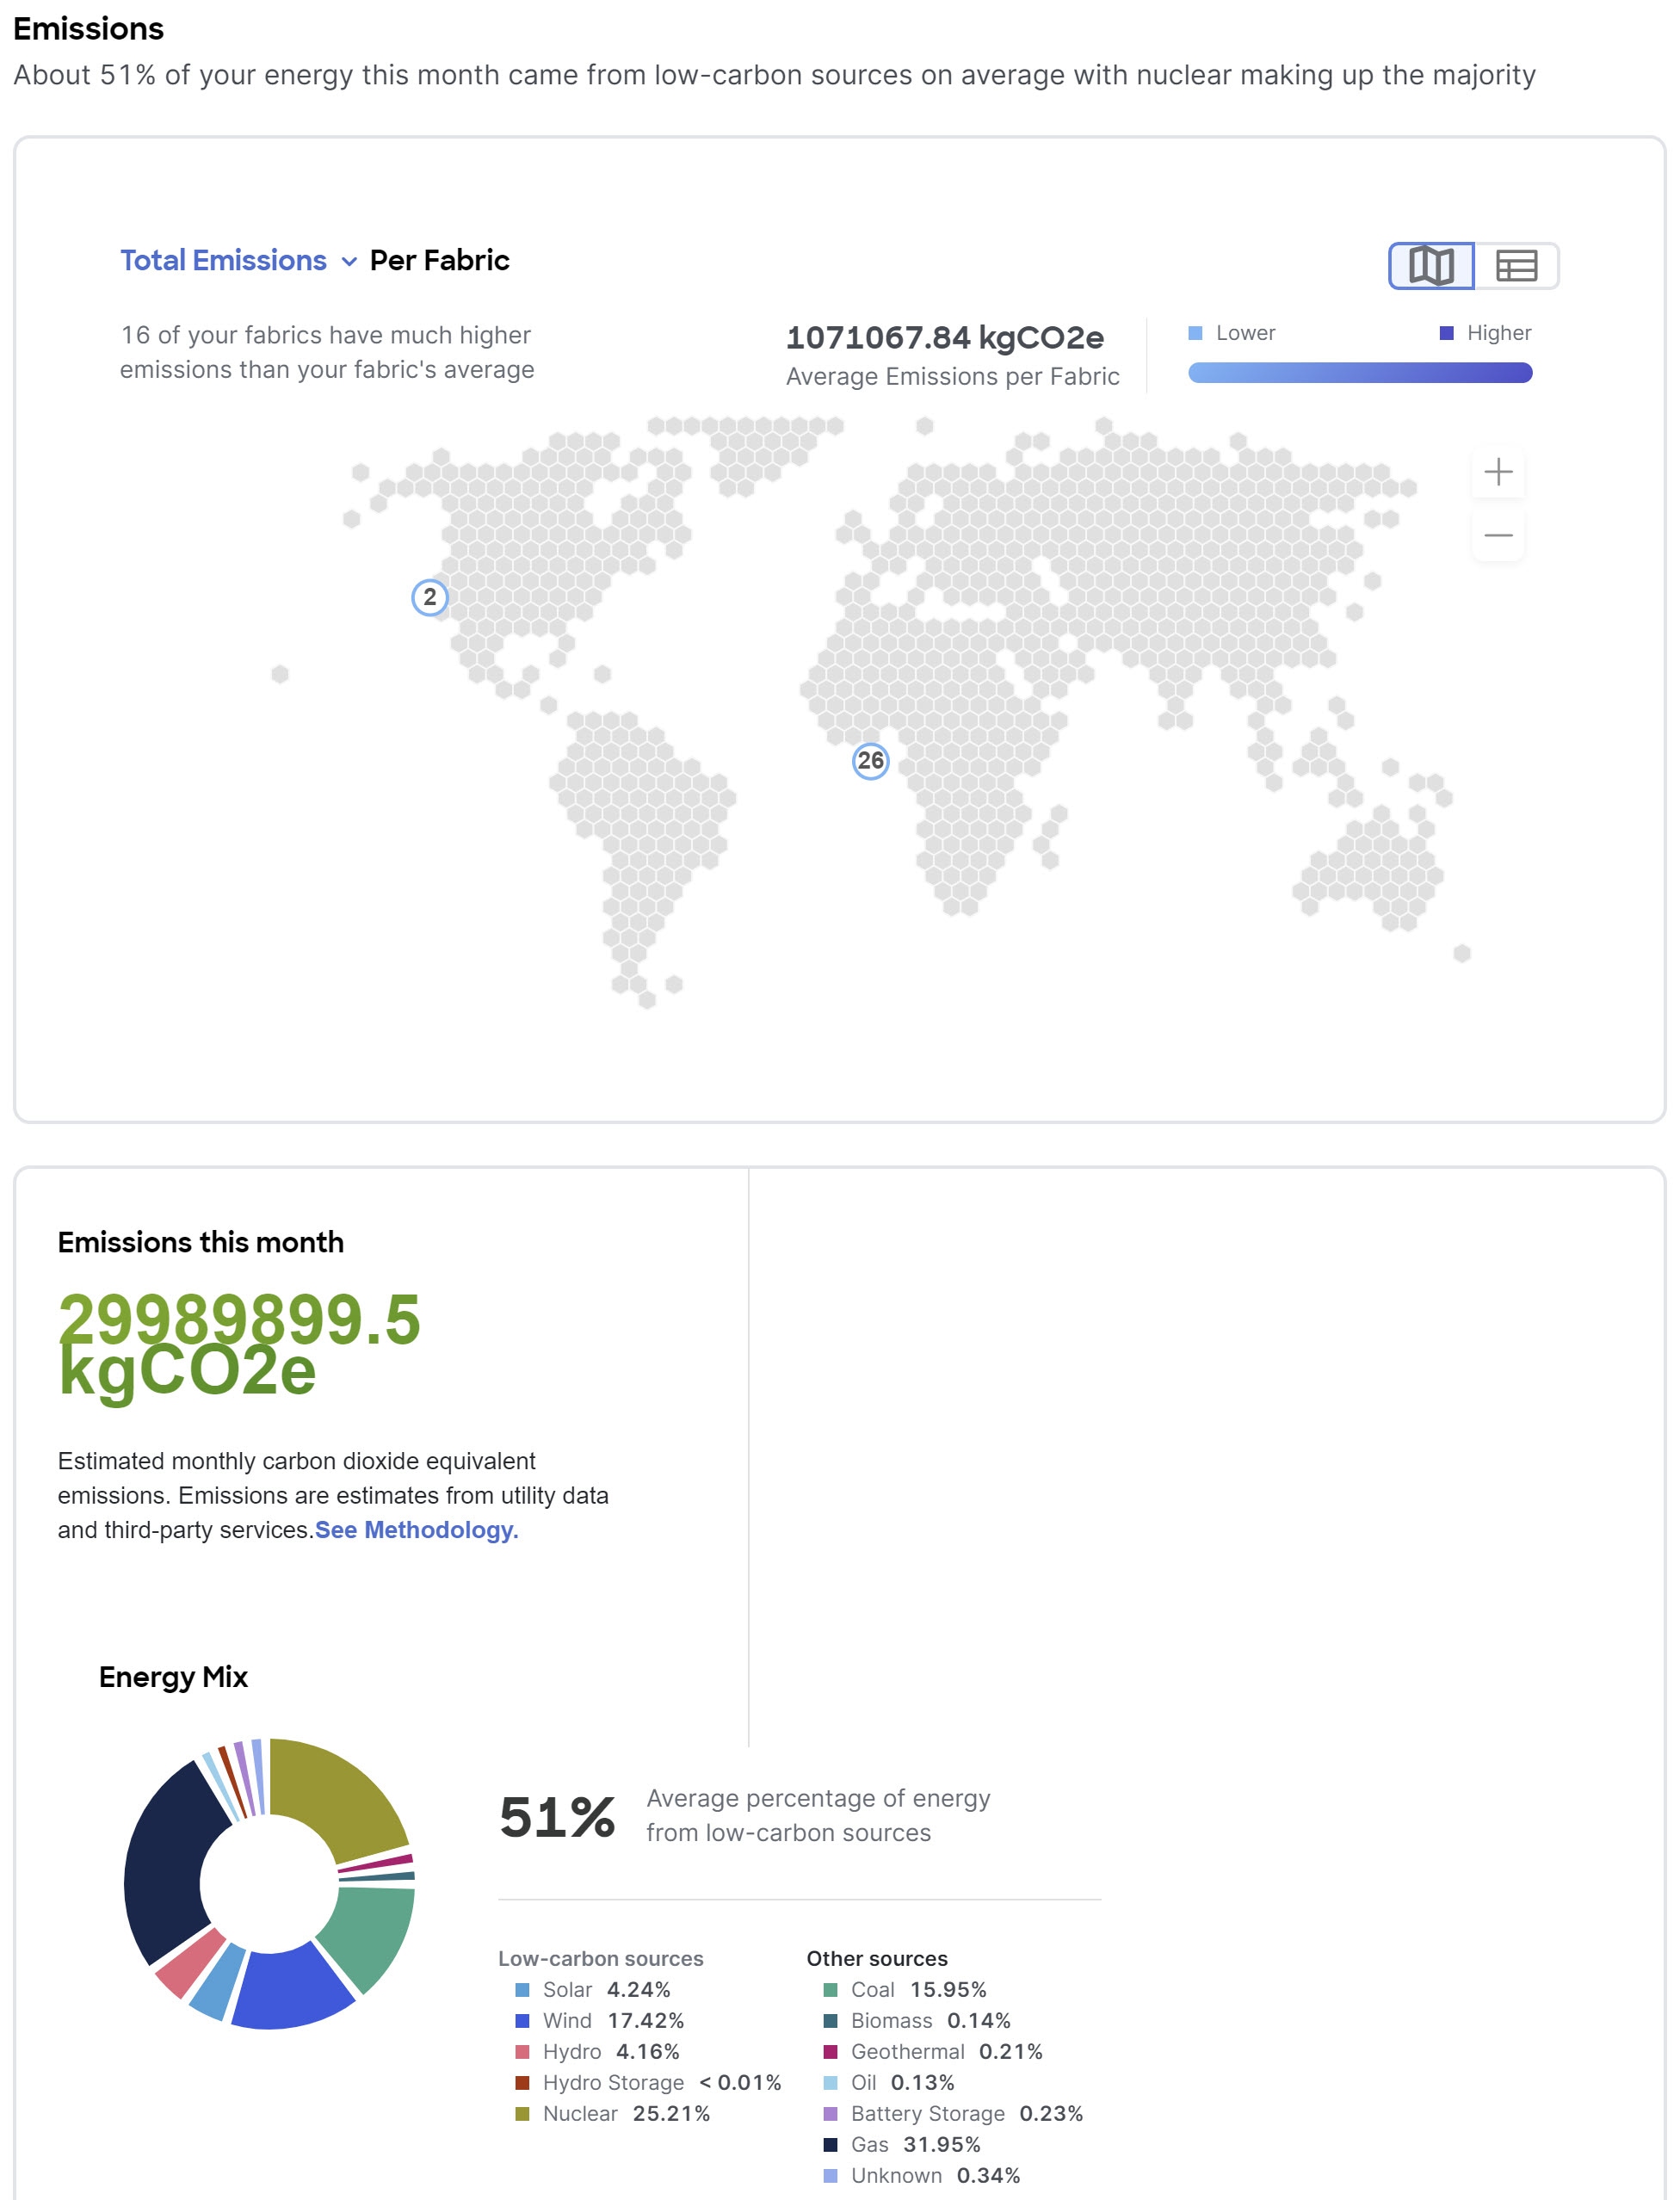
-
Examine the Top 5 Devices area to see the top 5 devices for the highest estimated cost, most energy consumed, and highest estimated greenhouse gas (GHG) emissions.
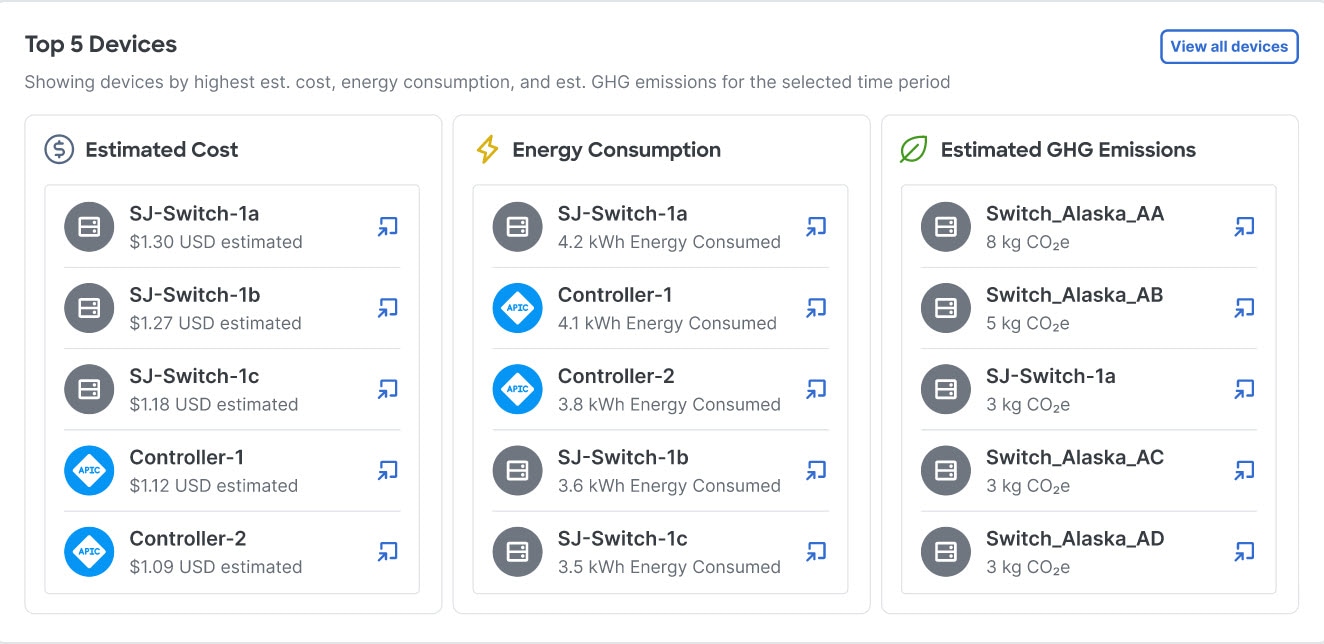
Click View all devices to see the data for all devices, not just the top 5.
-
Choose a fabric from the fabric drop-down menu to view the hourly energy mix.
Hourly energy mix displays the amount of total energy used during each three-hour reporting period by source, over all of the days in the chosen month. The minimum period before you can generate the next report is 3 hours.
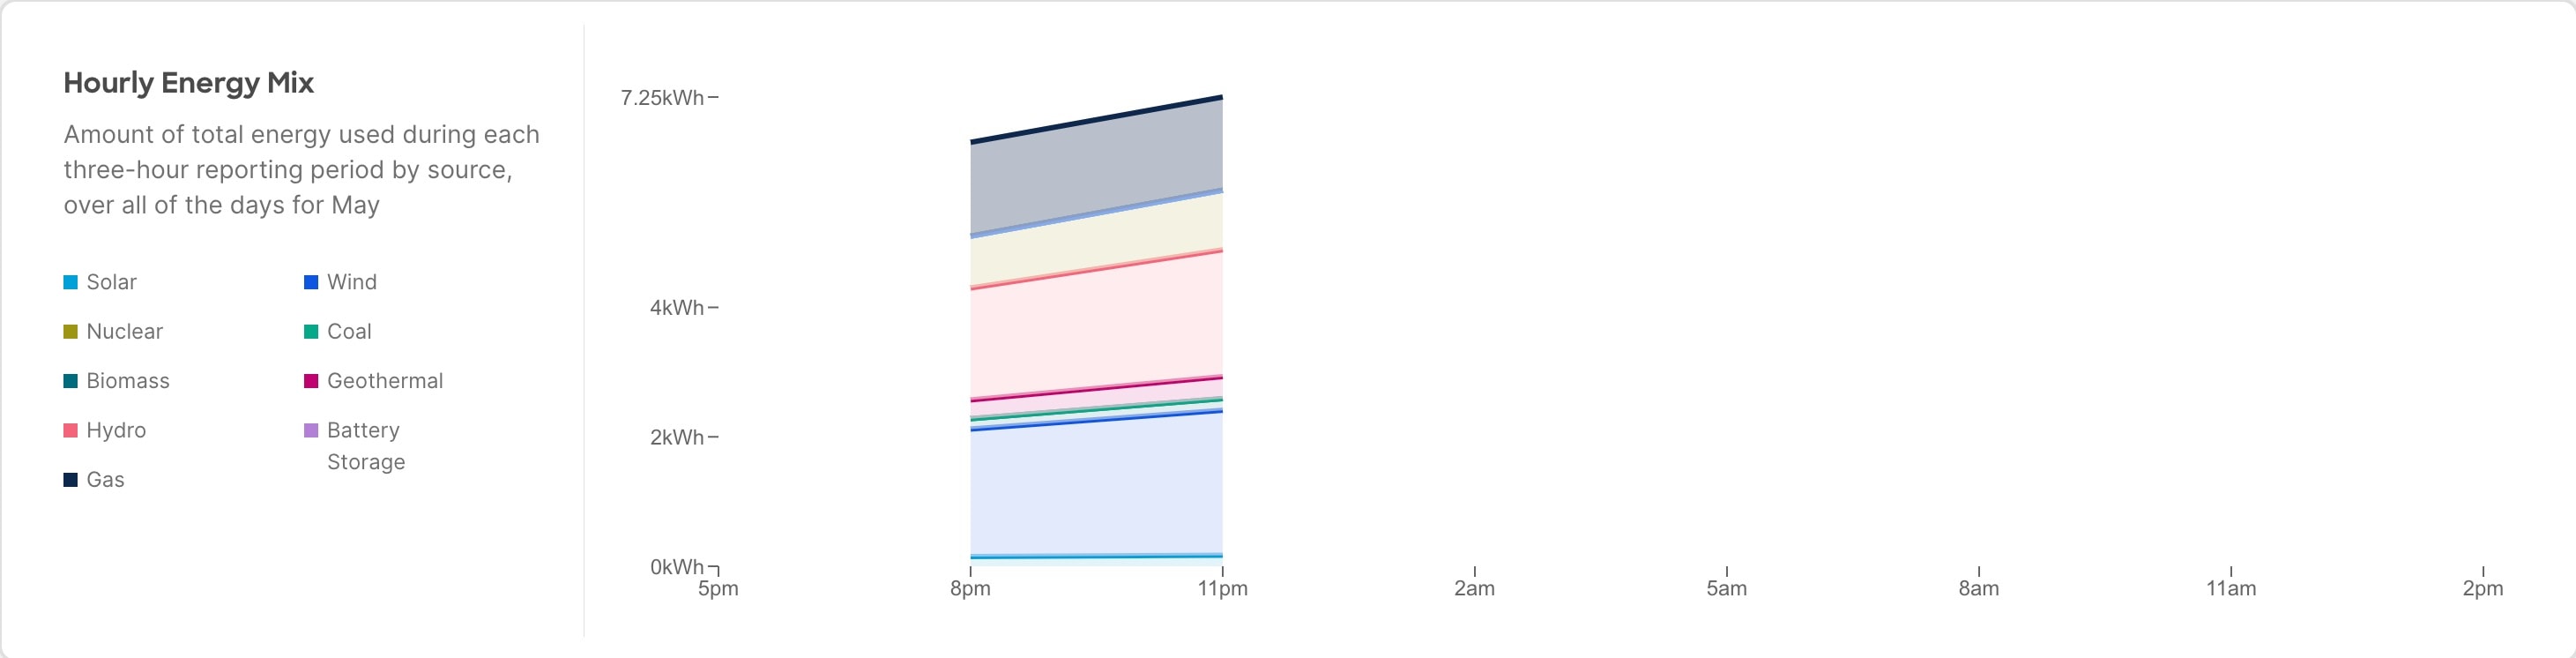
View the sustainability report for PDUs
-
Navigate to Analyze > Analysis Hub > Sustainability Report.
-
Choose an online fabric or multiple online fabrics from the drop-down menu.
-
Choose a time range from the drop-down menu.
-
Use the Display data from toggle to display data from PDUs.
-
Click Prepare Report.
The sustainability report displays At A Glance, Cost, Energy, and Emissions information for a particular fabric in the chosen month.
-
Examine the At A Glance area to see a summary of the estimated cost, estimated switch power consumption, and estimated emissions in the chosen month. Click the Learn More icon for more information.
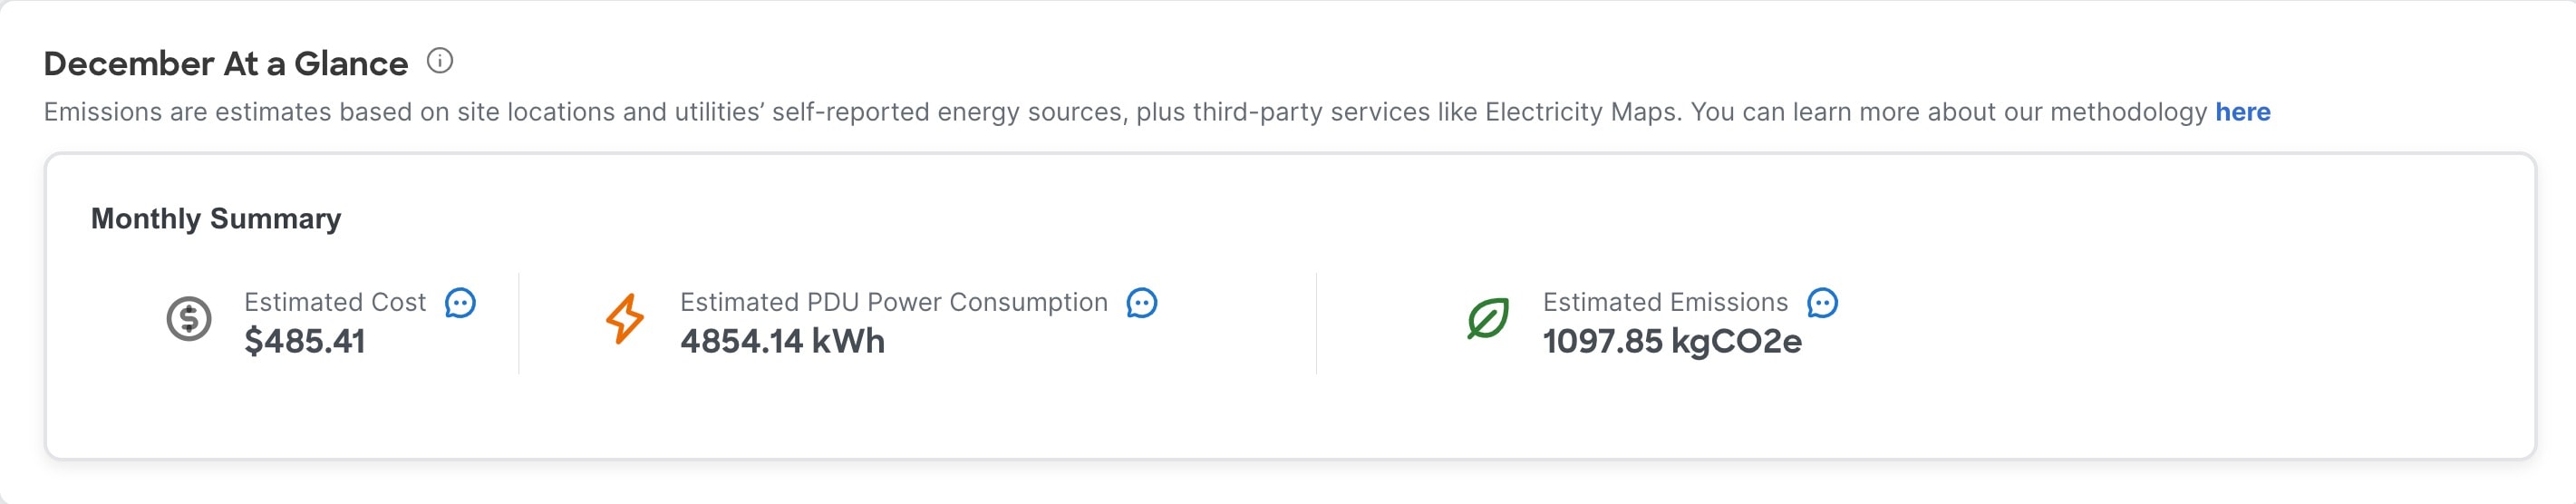
-
Examine the Cost area to see the estimated daily cost in the chosen month and share of daily cost per fabric.
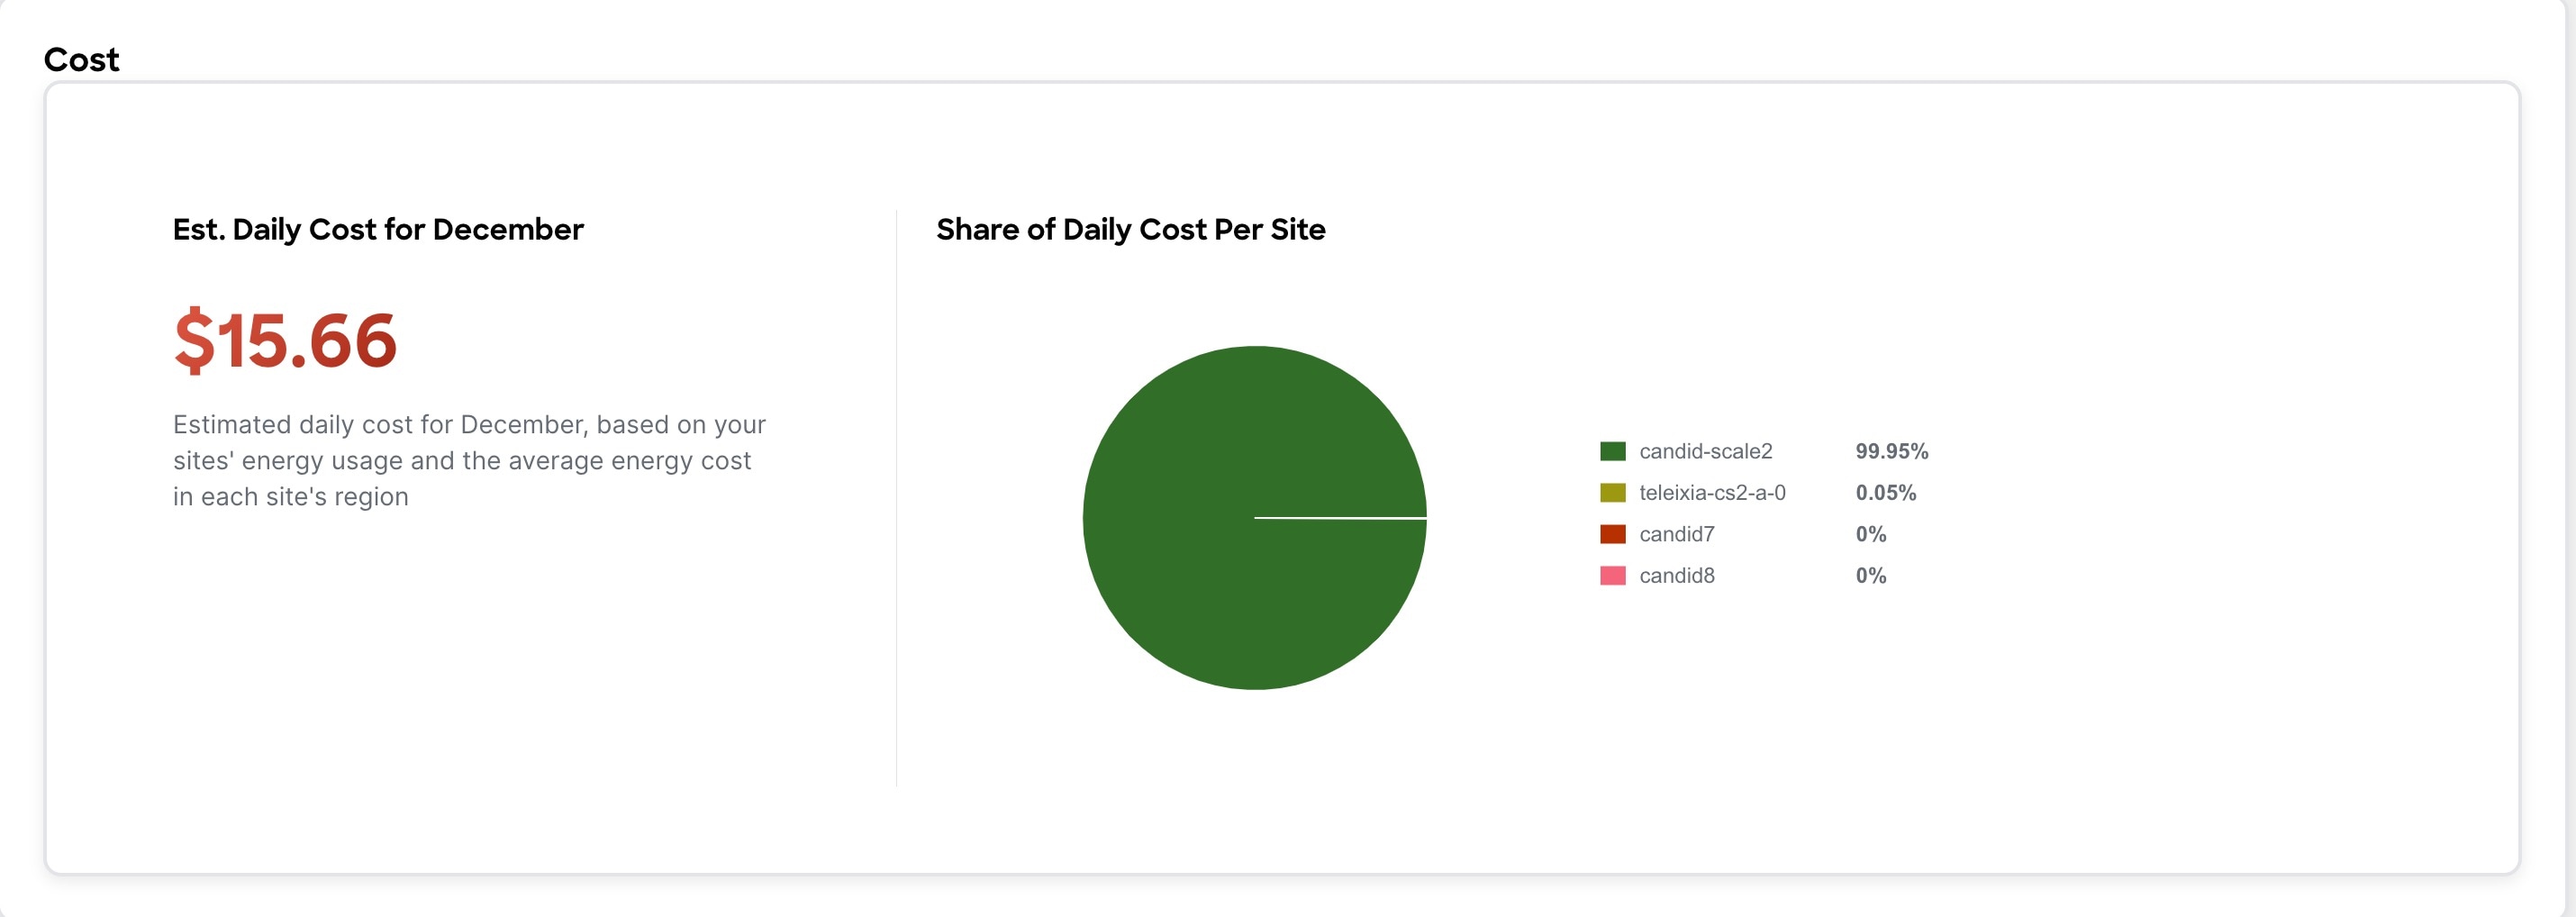
-
(Optional) From the Actions menu, choose Fabric Energy Settings to customize your average cost for the current month for a more accurate estimate. To calculate cost estimates, Nexus Dashboard uses values based on the average cost of grid energy for each region.
-
Examine the Energy area to see the energy usage in the chosen month in kWh.
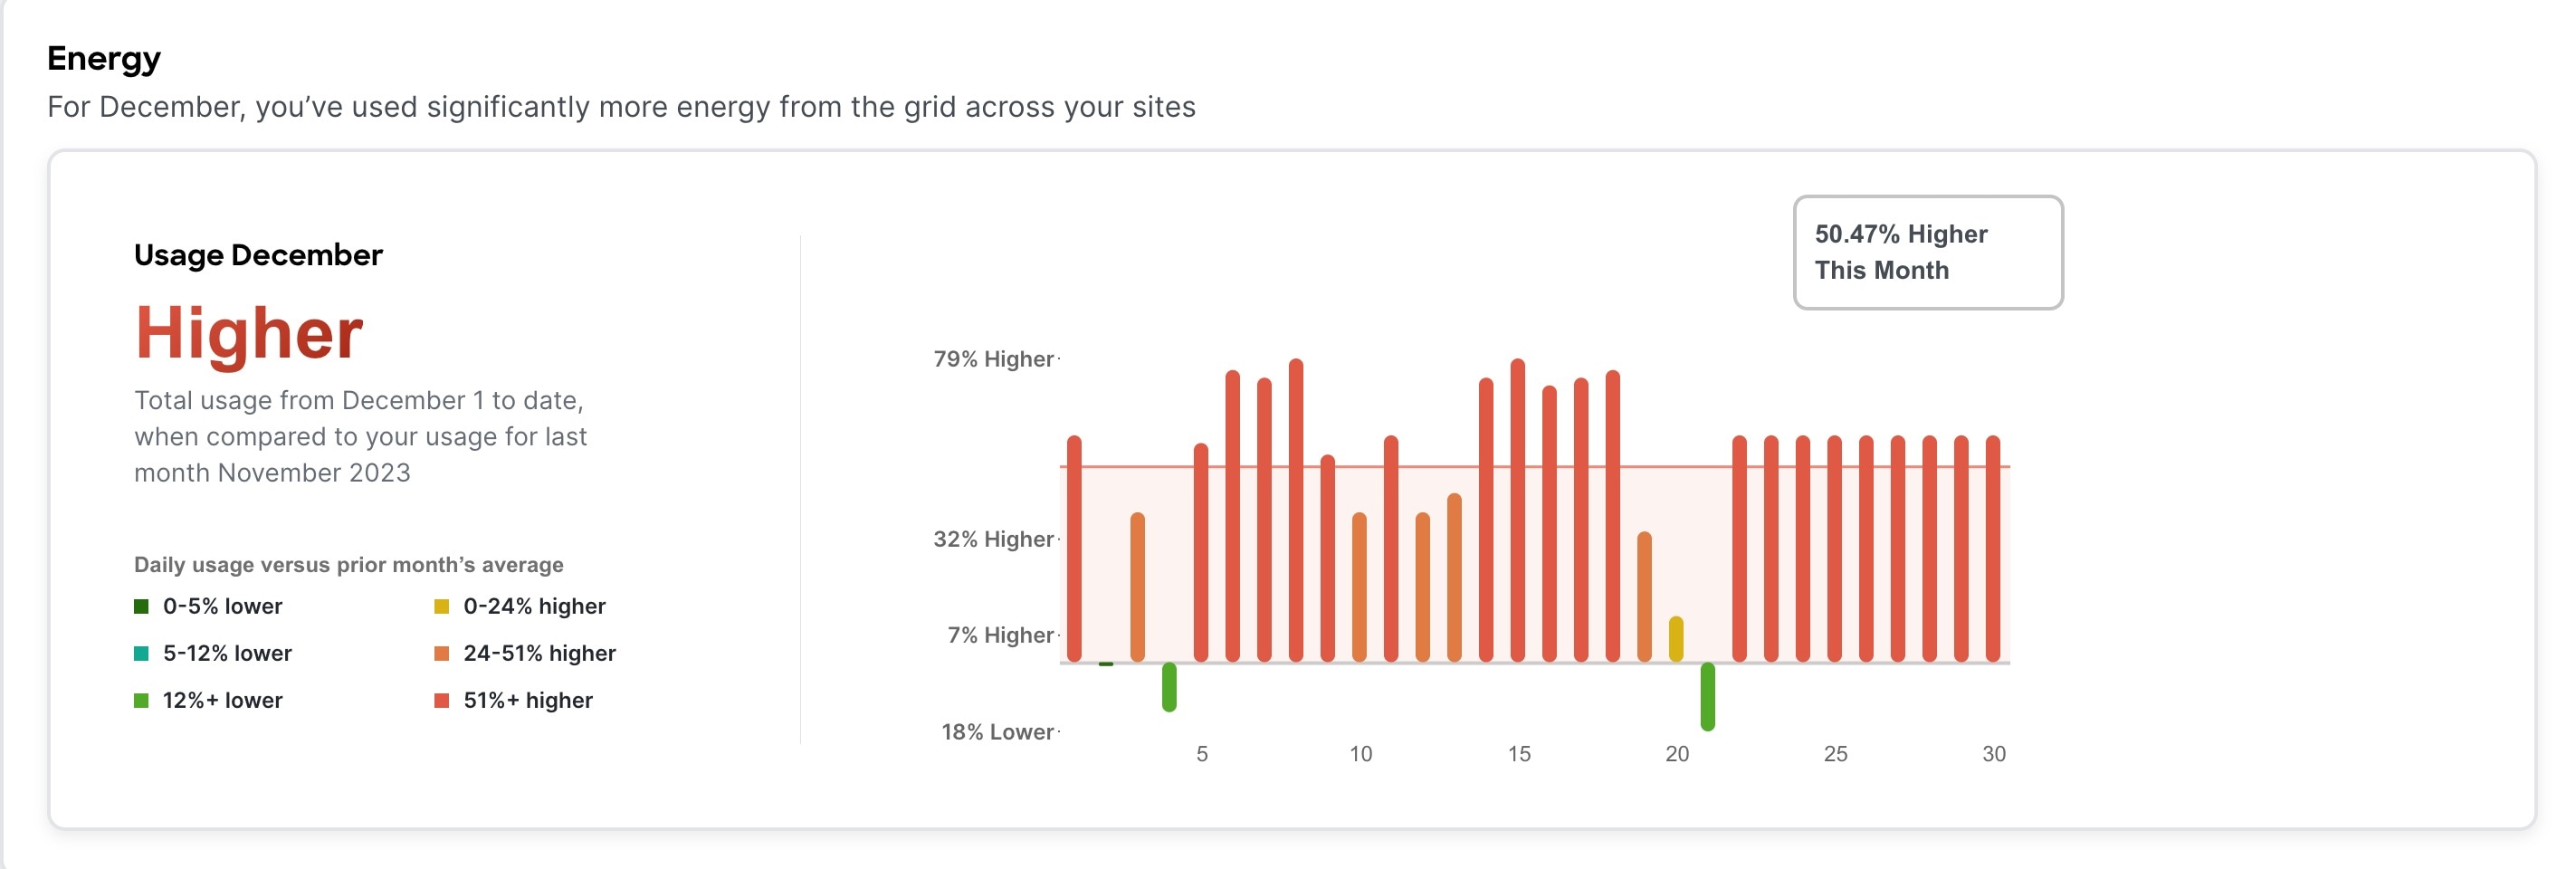
-
Examine the Emissions area to see the total emissions per fabric, estimated monthly carbon dioxide equivalent emissions, average percentage of energy from low-carbon sources and other sources, and percent of total energy used during each three-hour reporting period by source over all of the days in the chosen month.
For total emissions per fabric, use the toggle to view the information in graphical format or tabular format.
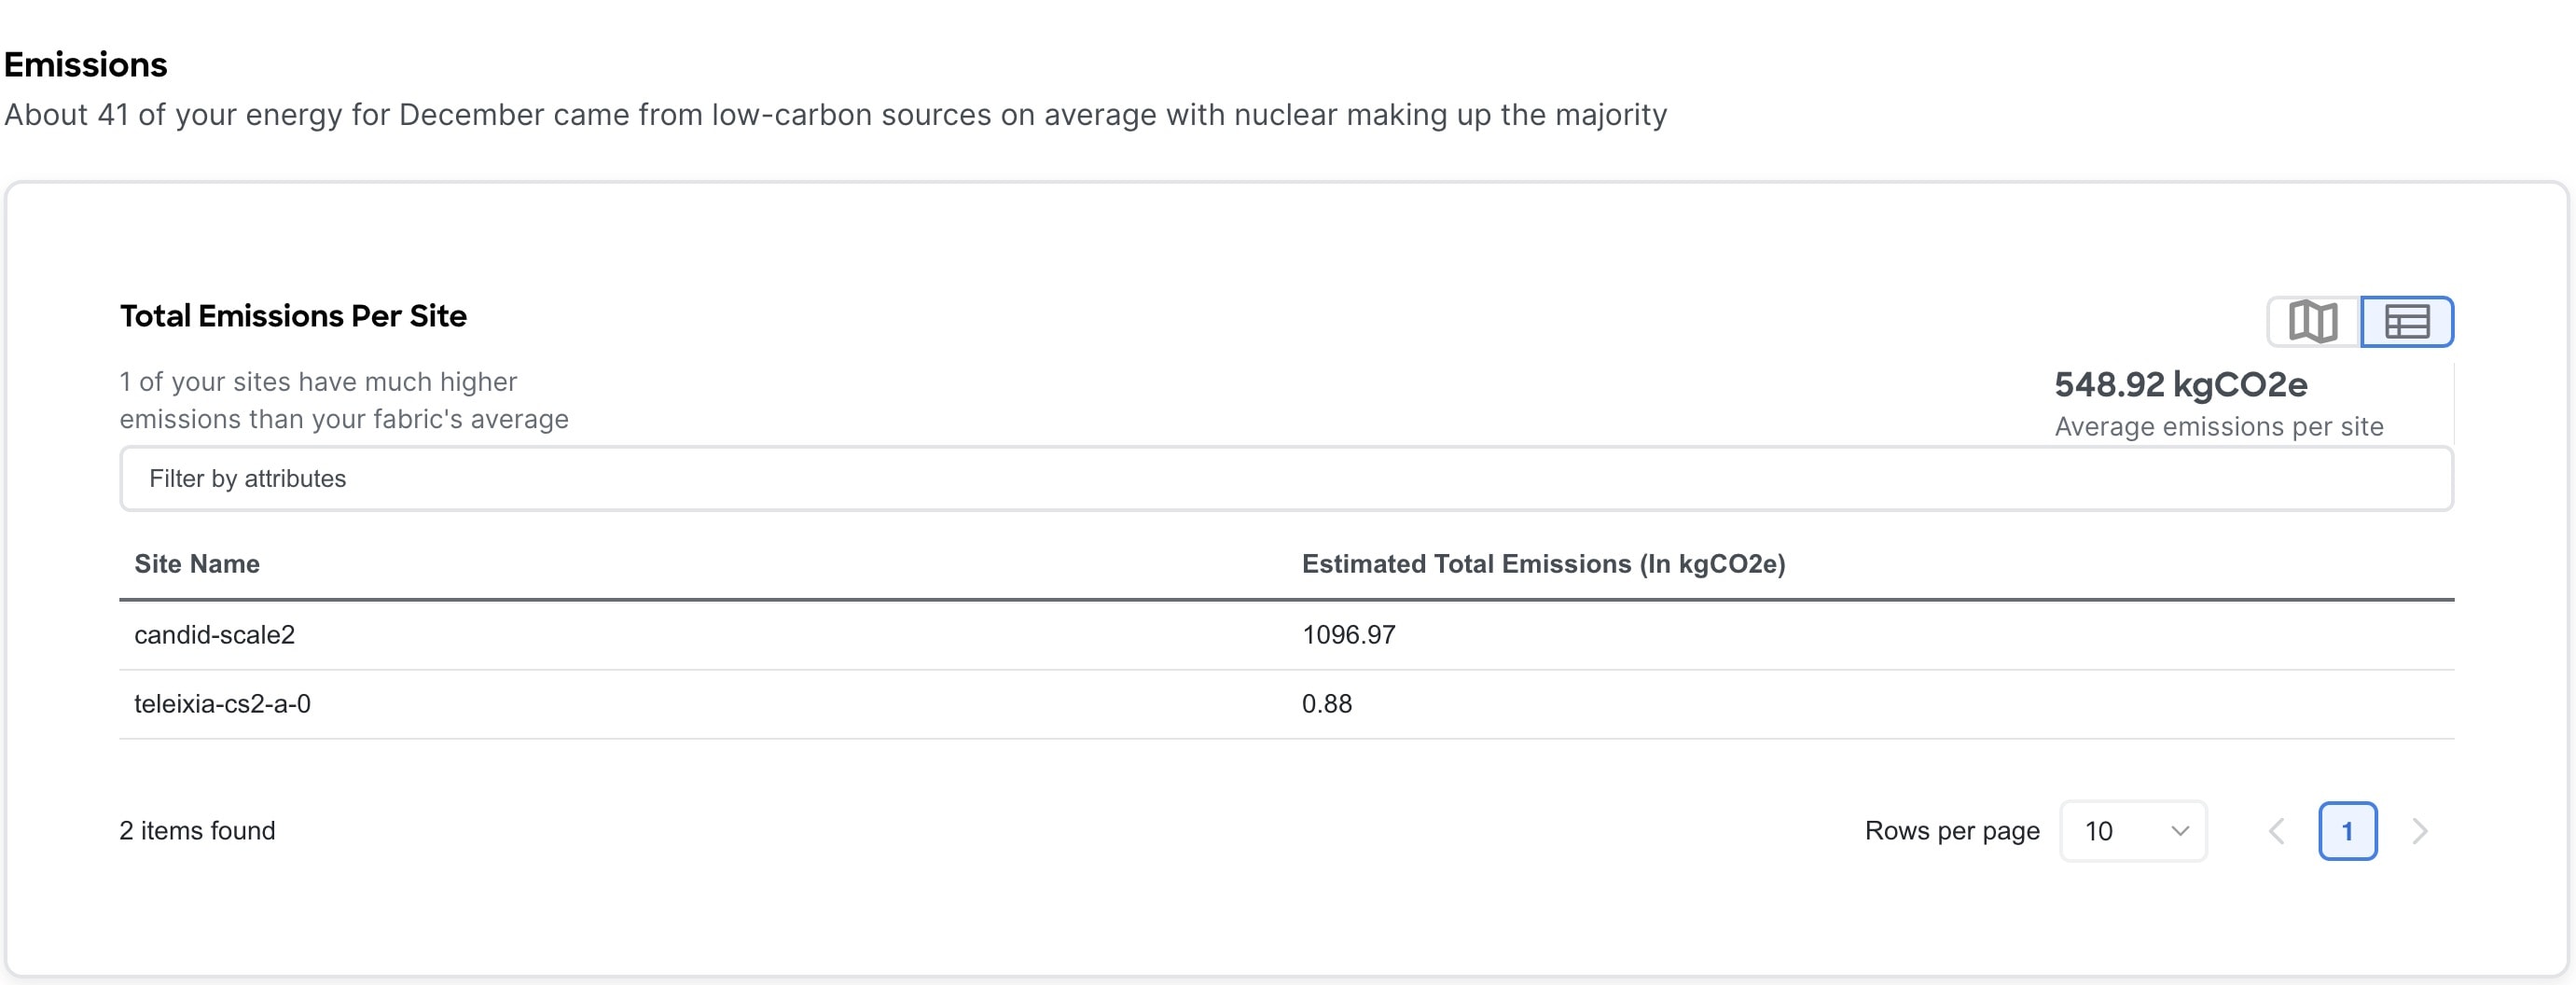
-
Examine the Top 5 Devices area to see the top 5 devices for the highest estimated cost, most energy consumed, and highest estimated greenhouse gas (GHG) emissions.
Click View all devices to see the data for all devices, not just the top 5.
-
Choose a fabric from the fabric drop-down menu to view the hourly energy mix.
Hourly energy mix displays the amount of total energy used during each three-hour reporting period by source, over all of the days in the chosen month. The minimum period before you can generate the next report is 3 hour.
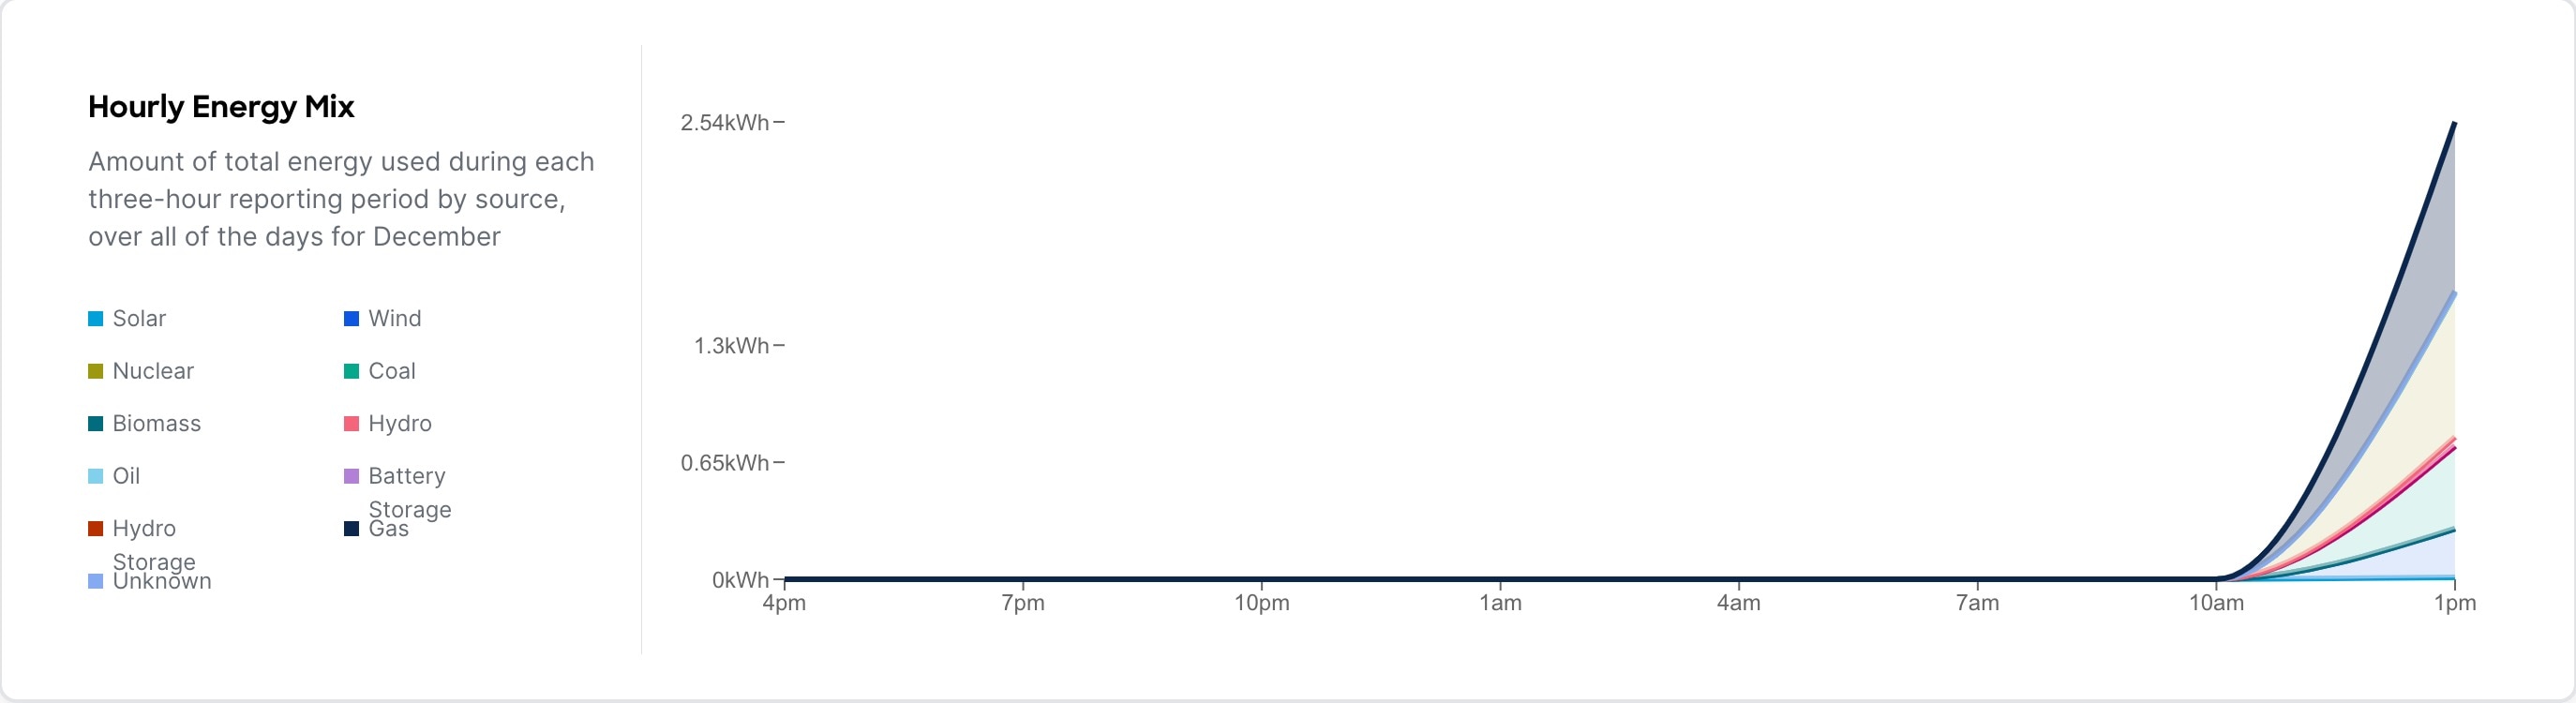
Comparing the configurations between two time periods for your fabric using Delta analysis
Nexus Dashboard performs analysis of fabrics at regular intervals and the data is collected at an interval depending on the number of nodes.
| Number of nodes | Interval |
|---|---|
|
Fewer than 100 |
2 hours |
|
100 to 400 |
3 hours |
|
Greater than 400 |
12 hours |
At each interval, Nexus Dashboard captures a snapshot of the controller policies and the fabric run time state, performs analysis, and generates anomalies. The anomalies generated describe the health of the network at that snapshot.
Delta analysis enables you to analyze the difference in the policy, run time state, and the health of the network between two snapshots.
Create Delta Analysis enables you to create a new delta analysis and manage existing analysis. See Create delta analysis.
Health Delta
Health Delta analyses the difference in the health of the fabric across the two snapshots.
See Health Delta for more details.
Policy Delta for ACI
Policy Delta for ACI fabrics analyzes the differences in the policy between the two snapshots and provides a co-related view of what has changed in the ACI Fabric.
See Policy Delta for more details.
Policy Delta for standalone NX-OS
Policy Delta for standalone NX-OS fabrics analyzes the changed nodes or switches across two snapshots and obtains a co-related view of what has changed in the NX-OS switches.
See View policy delta analysis for more details.
Guidelines and limitations for delta analysis
-
For NX-OS fabrics, the Delta Analysis functionality currently supports the local authentication domain only.
-
While you are currently allowed to create more than one Delta Analyses at any given time, we recommend that you do not queue more than one Delta Analysis at any given time. In addition, we recommend that you wait for some time (approximately 10 minutes) between creating new analyses to avoid the risk of adversely impacting the run time of the concurrent online fabric analysis.
The interdependency arises because the Delta Analysis results in an increased load on the database. Sustained high-database load from multiple back-to-back Delta Analyses may affect the run-time of the online analysis.
-
For ACI fabrics, the APIC Configuration Export Policy must be of the same format (XML/JSON) for both the snapshots.
-
For ACI fabrics, the policy delta will not be performed if there are any APIC configuration export policy collection errors.
-
For ACI fabrics, the toggle for 'Include Acknowledged Anomalies' which allows you to filter out the acknowledged anomalies from the results displayed does not show anomalies that are manually acknowledged.
-
For NX-OS fabrics, when you choose a switch in the Changed Nodes area, in Policy Delta, the difference in the configuration between the two snapshots is displayed.
-
For NX-OS fabrics, for Policy Delta, Audit Logs is not currently supported.
Create delta analysis
For ACI Assurance Group users, APIC admin writePriv privileges allow information collection on the APIC host and leaf switches. You must have APIC admin writePriv privileges to configure the APIC Configuration Export Policy. This is not a requirement for NX-OS fabrics.
Choose Analyze > Analysis Hub > Delta Analysis > Create Delta Analysis.
-
In the Delta Analysis Name field, enter the name. The name must be unique across all the analyses.
-
Click Fabric to choose the fabric.
-
Click Choose Earlier Snapshot and choose the first snapshot for the delta analysis. Click Apply.
-
Click Choose Later Snapshot and choose the second snapshot for the delta analysis. Click Apply.
The two snapshots chosen for the delta analysis must belong to the same fabric.
-
View the Summary of the Delta Analysis created in Summary.
-
Click Save. The status of the delta analysis is displayed in the Delta Analysis table. Post completion, you can View Delta Analysis or Create another Delta Analysis.
You can perform one delta analysis at a time. To perform another delta analysis, you must stop the current delta analysis and then start the another delta analysis.
-
(Optional) From the Status column, choose an In Progress or Scheduled analysis and click STOP in the "…" option to stop the delta analysis.
-
The Delete in the "…" allows you to delete the analysis created.
If there are any errors in the creation of a delta rule, it will be displayed on the summary page of the rule creation as a banner.
View delta analysis
The delta analysis page displays the analysis in a tabular form. The analysis are sorted by status. The Create Delta Analysis button lets you create a new delta analysis. Click any delta analysis to view more details.
The status of analysis can be either Aborted, Pending, Scheduled, Stopped, Stopping, Success, Failed, Partially Failed, Queued, Completed or In progress.
The filter bar allows you to filters the analysis by the following factors:
-
Name
-
Status
-
Fabric
-
Submitter ID
The delta analysis dashboard displays the general details of the analysis along with the health and policy delta.
-
To view the results of health delta analysis, see View health delta analysis.
-
To view the results of policy delta analysis, see View policy delta analysis.
View health delta analysis
Health Delta analyses the difference in the health of the fabric across the two snapshots. The results are displayed in the following areas:
The toggle for 'Include Acknowledged Anomalies' allows you to filter out the acknowledged anomalies from the results displayed if enabled. If it is disabled, manually acknowledged anomalies are included in the Anomaly Count.
-
Anomaly Count: Displays the difference in anomaly count per severity across the snapshots. If you click on the difference that shows, the All Anomalies table gets filtered accordingly.
The first count represents the anomalies found only in the earlier snapshot. The second count represents the anomalies common in both the snapshots. The third count represents the anomalies found only in the later snapshot.
Delta analysis now performs an object delta rather than a count delta. So along with the count, you can now view how many anomalies were cleared, how many are unchanged and how many are new anomalies.
The anomaly count also displays the difference for the different types of anomalies. It is displayed for Critical, Major and Warning.
-
Delta by Resources: Displays the count of resources by type that are new, lost or unchanged. You can also specifically view the resources who’s count has changed by clicking the View Changed Only toggle. The filter bar allows you to filter the data by resource. The gear icon allows you to customize the columns as per your view. The table also shows the count delta and the health delta. Count delta includes both healthy and unhealthy resources. Healthy resources will not have any anomalies associated with it if filtered. Health delta shows only unhealthy resources and will return anomalies if filtered by anomalies.
If you click any of the counts for the Count and Health Delta resources, you can view the list of resources along with the node information. For SVI, the node column provides the VNI association.
-
All Anomalies: The Grouped view displays the delta status for grouped anomalies across the snapshots. The Ungrouped view displays the delta status for each anomaly across the snapshots.
For ACI fabrics, the Anomalies can be listed for the following kinds of snapshots:
-
Earlier Snapshot
-
Later Snapshot
-
Earlier Snapshot Only
-
Later Snapshot Only
-
Both Snapshots
For NX-OS fabrics, the Anomalies can be listed for the following types:
-
New
-
Unchanged
-
Cleared
-
From Earlier Snapshot
-
From Later Snapshot
The anomalies are displayed in a tabular form with the following fields:
-
Title
-
Anomaly Level
-
Category
-
Count
For ACI fabrics, you can filter the results based on the following attributes:
-
Anomaly Level
-
App Profile DN
-
BD DN
-
Title
-
Contract DN
-
EPGs
-
External Routes
-
Interfaces
-
Internal Subnets
-
L3Out DN
-
Leaf DN
-
Tenant DN
-
Endpoints
-
VRF DN
For NX-OS fabrics, you can filter the results based on the following attributes:
-
Border Gateways (Leaf)
-
Border Leafs (Leaf)
-
Interfaces
-
L2VNIs
-
L3VNIs
-
Leafs
-
Spines
-
SVIs
-
VLANs
-
VNIs
-
VPCs
-
VRFs
Choose an anomaly to view the anomaly details.
View policy delta analysis
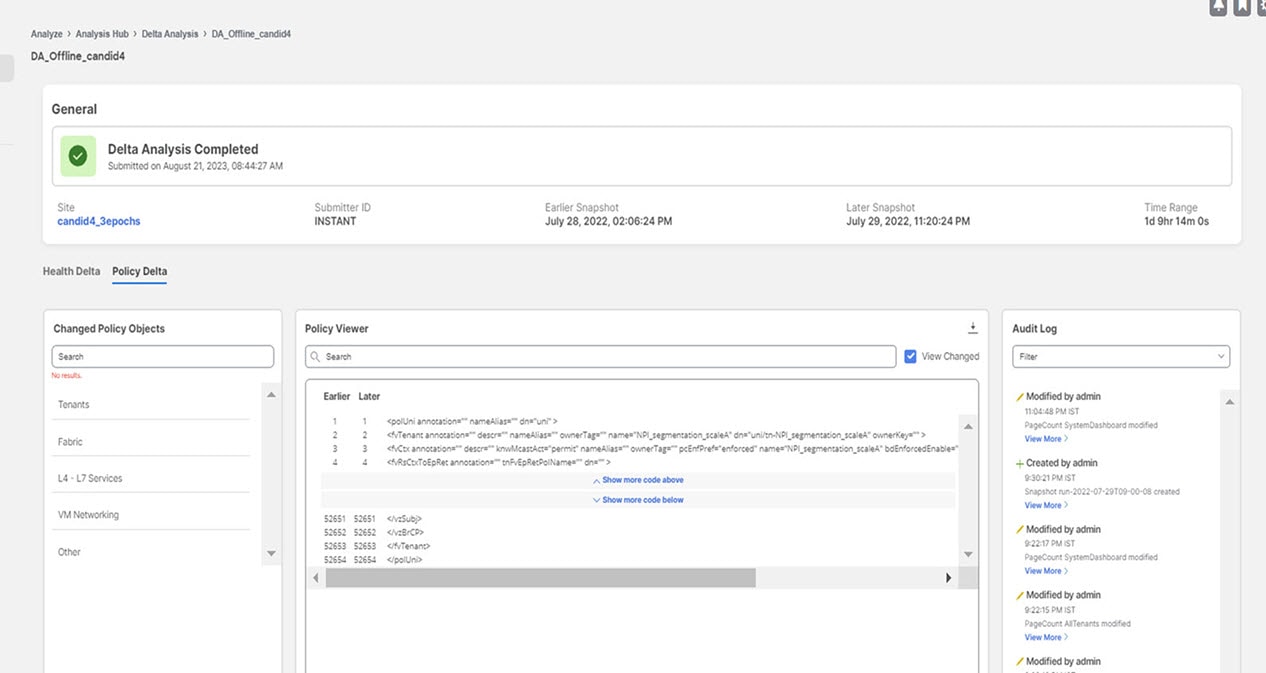
Click Policy Delta to view the policy changes across the two snapshots. Policy Delta includes Changed Policy Object and Policy Viewer. ACI fabrics also include Audit Log.
-
Changed Policy Object displays the changed policy object tree across the two snapshots. The corresponding changes in the Policy Viewer and Audit Log panels are highlighted. Use the Search bar to perform a DN search.
-
Drill down on a particular object to view the object types that have changed. The number indicates the number of changes to the object.
-
Choose the changed object type to view the anomalies that have changed.
-
Click DN link to access the affected object type in APIC.
-
Click Show Changes to view the changes in the Policy Viewer and Audit Log panels.
-
-
The Policy Viewer panel displays the policy configuration across the earlier and later snapshots. It also helps view the added, modified, and deleted policy configurations between the two snapshots and view the context around the modified areas in the policy delta.
-
Use the color coding to visualize the added, deleted, modified, and unchanged content across the two policies.
-
Click Show More Code Above or Show More Code Below to display more content.
-
Click the download icon to export the policy configuration for the earlier snapshots policy and later snapshots policy.
-
Enter a value in the Search bar to perform a text search in added, modified, deleted, and unchanged areas in the policy delta.
-
-
The Audit Log panel then displays all the audit logs that were created between the two snapshots. Nexus Dashboard collects audit logs from APIC and computes the difference in the audit logs between the two snapshots.
A correlated view of what has change in the data center is displayed in the Audit Log panel. When you choose a particular object in the Changed Policy Objects panel, the relevant difference is highlighted in the Policy Viewer panel and the relevant audit log is highlighted in the Audit Log panel. APIC audit logs are records of user-initiated events such as logins and logouts or configuration changes that are required to be auditable. For every snapshot, the audit log history is limited to last 24 hrs.
-
Use the Filter bar to filter by DN, User ID, or Any.
-
Click View More on an audit log entry to view when the changes were made and who made the changes. The timestamp on the audit log entry corresponds to the the timestamp on the APIC audit log.
-
Click Audit Log entry to access the affected object type in APIC.
Viewing the impact of configuration changes using Pre-Change analysis (ACI fabrics)
Navigate to Analyze > Analysis Hub > Pre-Change.
Pre-Change Analysis allows you to change a configuration for a fabric, to model the intended changes, perform a Pre-Change Analysis against an existing base snapshot in the fabric, and verify if the changes generate the desired results.
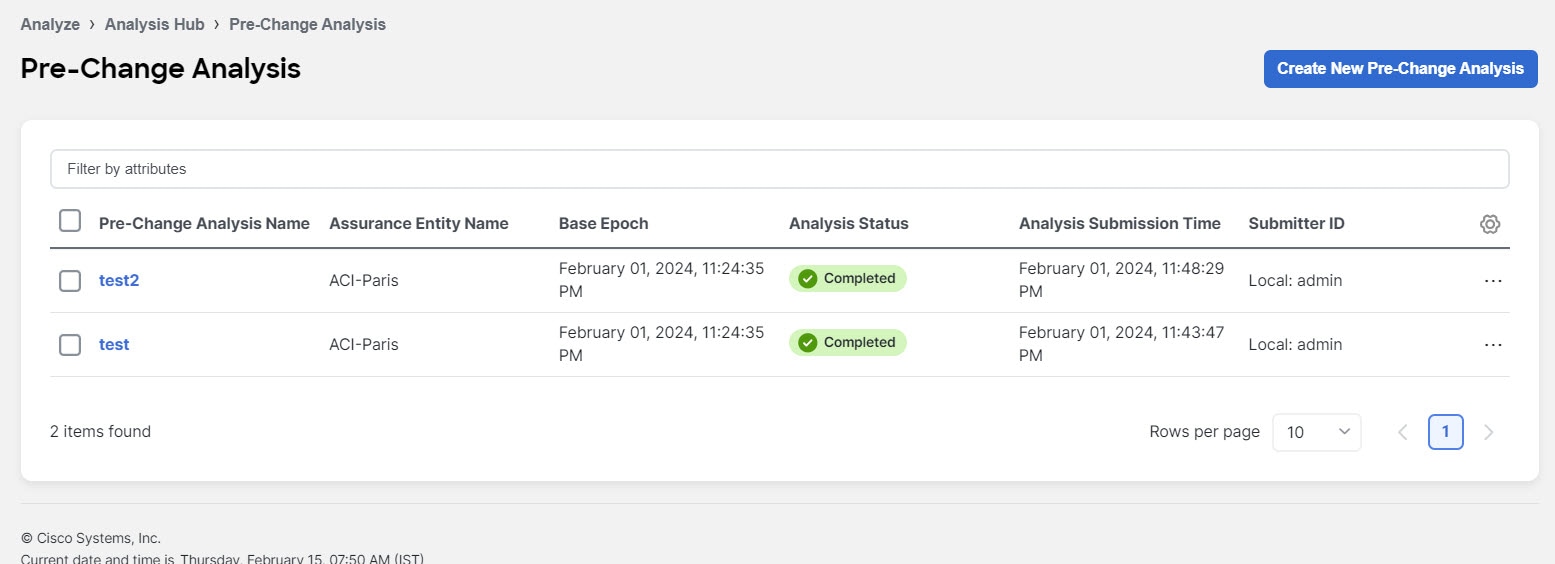
After you model the changes for a Pre-Change Analysis job, you can choose Save or Save And Analyze. By choosing Save, you can save the Pre-change Analysis job without having to start the analysis right away. You can return to the job later, edit the changes if required, and then run the analysis later. The Save option is supported only for a Pre-Change Analysis job with manual changes.
If you choose Save And Analyze, the job gets scheduled and an analysis is provided. The changes are applied to the chosen base snapshot, the analysis is performed, and results are generated. For every pre-change analysis job listed in the table, a delta analysis is performed between the base snapshot and the newly generated snapshot.
In Pre-Change Analysis, to see the details of a completed Pre-Change Analysis job, click that job in the table. This opens a new page that displays the following information:
-
Dashboard
-
Delta Analysis
-
Compliance Analysis
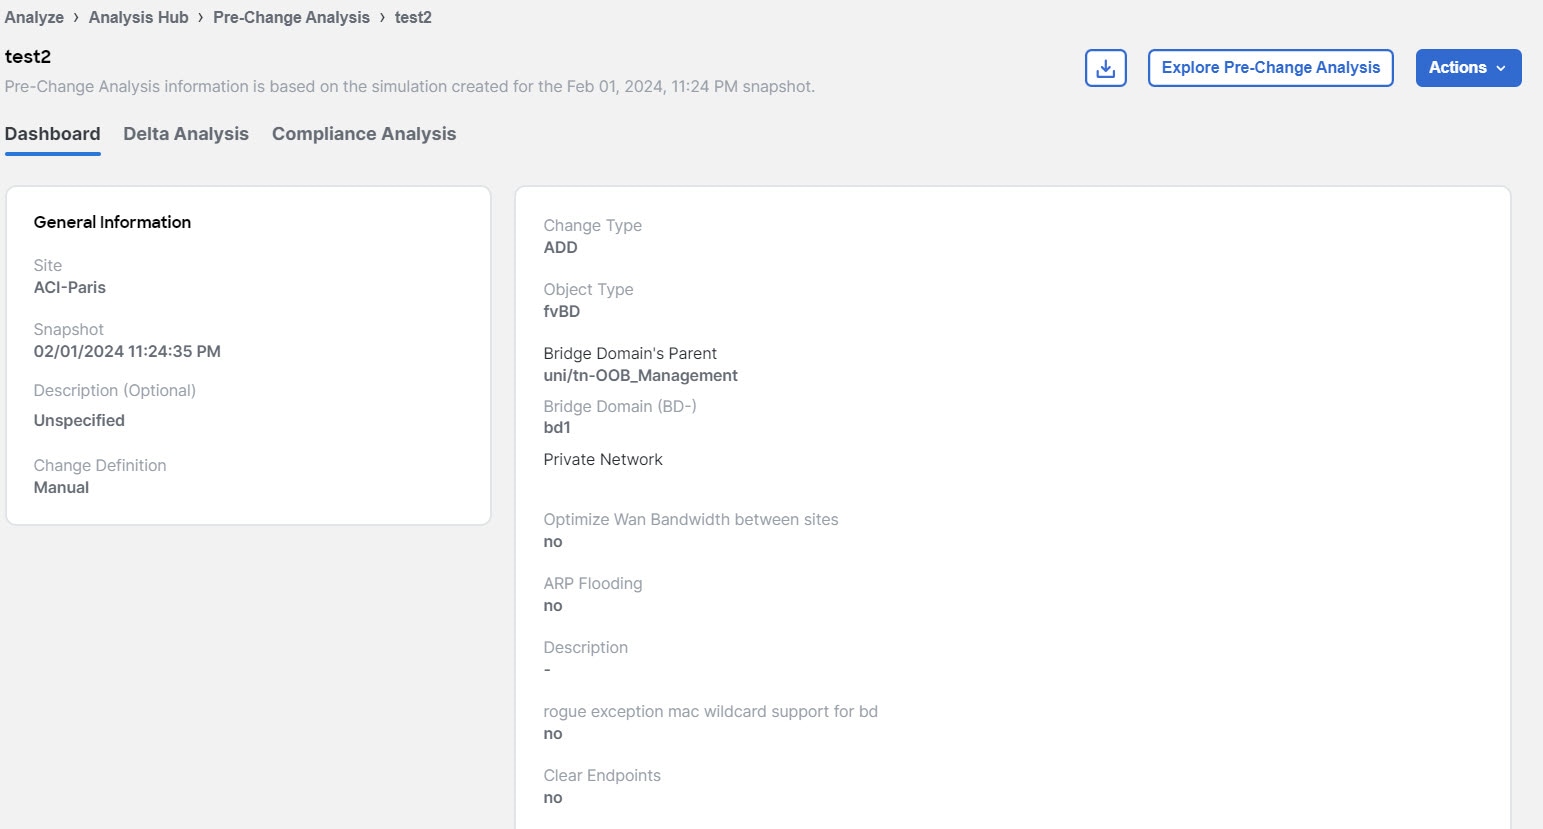
General Information shows the following data:
-
Fabric name
-
Snapshot details
-
Description
-
Change Definition
In case of Manual Changes, you see list of changes that were modeled for that job(Change type, Object type, name alias, Priority, Description, App profile) and in case of JSON/ XML file upload you see the Change Simulation.
As the job is complete, the severity area displays the anomalies that are generated for these changes. To understand the data displayed under Delta Analysis, view [Delta analysis].
To understand the data displayed under Compliance Analysis, view [Compliance].
The … button allows you to perform the following actions:
-
Edit Pre Change Analysis
-
Clone Pre Change Analysis
-
Delete Pre Change Analysis
If anomalies are raised in the analysis, make the required modifications based on the results and re-run the analysis until you obtain satisfactory results. The download option in a Pre-Change Analysis job allows you to download a JSON file that can be uploaded to Cisco APIC. However, if you choose the file upload approach, you can upload a JSON or an XML Cisco APIC configuration file to run a Pre-Change Analysis job.
Once the analysis starts, the status of the job will be shown as Running. During this time, the specified changes will be modeled on top of the base snapshot, and complete logical checks will be run, including Policy Analysis and Compliance. No switch software or TCAM checks will be performed. The status of the Pre-Change Analysis job is marked Completed when the entire analysis including Delta Analysis completes. The Delta Analysis is automatically triggered and the associated Pre-Change Analysis job is displayed as running during that time. The Delta Analysis is performed only on checks supported in Pre-Change Analysis job.
You can view changes applied by a user to a specific Pre-Change Analysis job by clicking the job in the table. If the changes are applied manually, you can view the different changes chosen by the user. If the job is created using a JSON file, the Change Definition field displays the name of the JSON file from where the changes were imported.
Pre Change Analysis lists all the analyses performed in a tabular form with the following fields:
-
Analysis Name
-
Assurance Entity Name
-
Base Epoch
-
Analysis Status
-
Submitter ID
Pre-change analysis options
The following list specifies the options you can choose on your pre-change analysis job. Only the objects listed are supported.
-
Add, modify, or remove Tenant.
-
Add, modify, remove App EPG (supported attributes: preferred group member, intra EPG isolation; relations for App EPG: BD, provided, consumed and taboo contracts; export/import of contracts is not supported.)
-
Add, modify, or remove a VRF (supported attributes: policy control enforcement preference, policy control enforcement direction, BD enforcement status, preferred group member, description).
-
Add, modify, or remove a BD (supported attributes: description, optimize WAN bandwidth, type, ARP flooding, IP learning, limit IP learning to subnet, L2 unknown unicast, unicast routing, multi-destination flooding, multicast allow, and L3 unknown multicast flooding).
-
Add, modify, or remove a contract (supported attributes: scope, description).
-
Add, modify, or remove a contract subject (supported attributes: reverse filter ports, description, priority, target DSCP, filter name, forward filter name, and reverse filter name).
-
Add, modify, or remove subnets (supported attributes: scope, preferred, description, primary IP address, virtual IP address, and subnet control).
-
Add, modify, or remove an App profile (priority, description).
-
Add, modify, or remove an L3Out (supported attributes: description, VRF name, Target DSCP, and route control enforcement).
-
Add, modify, or remove an L2Out (supported attributes: description, BD name, encapsulation type, and encapsulation ID).
-
Add, modify, or remove an L3 Ext EPG (supported attributes: preferred group member, description, priority; supported relations: VRF, provided contracts, consumed contracts, taboo, and target DSCP).
-
Add, modify, or remove an L2 Ext EPG (supported attributes: preferred group member, description, priority, target DSCP and provided contracts, supported contracts, and taboo contracts).
-
Add, modify, or remove L3 Ext EPG Subnets (supported attributes: description, and scope).
-
Add, modify, or remove a Taboo Contract (supported attributes: description).
-
Add, modify, or remove a Taboo Subject (supported attributes: name, description; supported relations: vzRsDenyRule).
-
Add, modify, or remove a Filter and Filter entries.
Guidelines and limitations for pre-change
When using Pre-Change Analysis follow these guidelines and limitations:
-
Pre-change Analysis can be conducted for fabrics and uploaded files.
-
More than one Pre-change Analysis can be run on the same base snapshot.
-
Pre-Change Analysis cannot be run for a pre-change snapshot being used as a base snapshot.
-
Only logical configuration anomalies are modeled and run in a Pre-Change Analysis. Switch software and TCAM changes are not modeled. After the analysis completes, a Delta Analysis will automatically start to compare the snapshot, generated due to the Pre-Change Analysis, with the base snapshot. Delta Analysis is performed only on checks supported in the Pre-Change Analysis job.
-
During a pre-change analysis, certain anomalies that exist in the base snapshot will not be analyzed in the pre-change analysis. As a result, these anomalies will not appear in the Pre- Change Analysis snapshot even though the violation continues to exist. The reason that such an event is not analyzed in a pre-change analysis is because these anomalies require not just logical data, but they also require switch software and TCAM data.
-
Compliance Analysis displays the results of compliance checks in the Pre-Change Analysis snapshot.
-
A local search of anomalies from a Pre-Change Analysis snapshot can be performed and viewed in the results section by navigating to specific tabs for Dashboard, Delta Analysis, Compliance Analysis, and Explore.
-
Pre-Change Analysis does not support or analyze any service chain related changes or objects.
-
Delta Analysis does not allow a Pre-Change Analysis snapshot to be chosen.
-
If configuration data does not exist for a base snapshot, and you run a pre-change analysis job using this snapshot, new logical configuration files will not be generated. For such pre-change analysis jobs, the Download icon will be grayed out/disabled in the side panel. You will not be able to download a new logical configuration.
-
The Pre-Change Analysis could go into a Failed state if an imported configuration has unsupported objects. Figure out the Cisco ACI objects that are unsupported by referring to the Pre-change analysis options section, remove them, and import the configuration again before starting another Pre-Change Analysis job. If there is a failed Pre- Change Analysis, the error message for the failure is displayed in the Pre-Change Analysis table under Analysis Status.
-
The Pre-change Analysis feature is supported in Cisco APIC release 3.2 or later. If you attempt to run a Pre-change Analysis with a Cisco APIC release earlier than release 3.2, an ERROR message indicates that Pre-Change verification is supported on APIC 3.2 or higher, and you cannot run the analysis.
-
If there is an analysis that is currently running when you start a Pre-Change Analysis, that job is completed first. The new jobs are serviced in the order the jobs are scheduled. Nexus Dashboard runs the jobs in the order that best suites the schedule and the available resources. All jobs, including the Pre-Change Analysis job are given the same priority.
-
You can upload a JSON or an XML Cisco APIC configuration file to run a Pre-Change Analysis job.
-
The maximum file size is 10 MB for vND and 50 MB for pND.
-
An uploaded file will be pruned by removing white spaces and endpoint objects (fvCEp) to reduce the file size.
-
-
You can save as many Pre-Change Analysis jobs as you want. However, for a fabric, you can only run a Pre-Change Analysis job one at a time.
-
If you modify an object that belongs to a tenant, the pre-change analysis file size for that tenant cannot be more than 10 MB.
Support for multiple objects in pre-change analysis
In addition to multiple tenants, you can also add multiple infrastructure objects as part of a Pre-Change Analysis JSON or XML job. The Pre-Change Analysis upload path allows you to add, modify, and delete multiple objects across the policy universe. There are no additional configurations required to use this feature. Your Pre-Change Analysis job for multiple objects will run, based upon the files you upload.
The following file upload formats are accepted:
-
A JSON or XML file with IMDATA of size 1.
-
An IMDATA that contains a single subtree of the intended changes. The root of the subtree can be the UNI or any other Managed Object as long as the changes are represented as a single subtree.
-
Use the file that you had uploaded from a JSON or XML path to perform a Pre-change Analysis. After the Pre-Change Analysis is complete, you can upload the same file to ACI to be used to make the changes.
Known issues for pre-change analysis
-
When pre-change analysis scale limits are exceeded, the analysis can fail with no error message.
-
For pre-change analysis jobs, you must not modify configurations where the total number of EPGs, BDs, VRFs are greater than 16,000.
-
When creating a new pre-change analysis, note the following:
-
If the JSON/XML file size being uploaded is less than 100 MB but greater than 15 MB, then the API validates the file and throws a validation error as follows: Uploaded file size exceeds the 15MB(pND)/8MB(vND) maximum limit. When users access Nexus Dashboard, and try to create a pre-change analysis job with a file size greater than 15MB(pND)/8MB(vND), the UI throws the following error: File size cannot be larger than 15MB(pND)/8MB(vND). Therefore, files larger than 15MB(pND)/8MB(vND) are not supported in pre-change analysis.
-
If you upload a file with unsupported objects, Nexus Dashboard will remove the unsupported object and run the job.
-
-
A pre-change analysis job may fail or return incorrect results if the Cisco ACI configuration has features that are unsupported by Nexus Dashboard.
-
Pre-change analysis is not supported in Cisco ACI configurations that contain service chains.
-
Nexus Dashboard performs a limited set of checks on the JSON file uploaded for pre-change analysis. Cisco ACI may reject this file.
-
Pre-change analysis may incorrectly report errors for attributes of subnets of external routed networks.
-
Pre-change analysis is supported in the following Cisco APIC releases:
-
For the 3.2(x) release, 3.2(9h) and earlier
-
For the 4.0(x) release, 4.0(1h) and earlier
-
For the 4.1(x) release, 4.1(2x) and earlier
-
For the 4.2(x) release, 4.2(7s) and earlier
-
For the 5.0(x) release, 5.0(2e) and earlier
-
For the 5.1(x) release, 5.1(4c) and earlier
-
For the 5.2(x) release, 5.2(4d) and earlier
-
For the 5.3(x) release, 5.3(1b) and earlier
-
For the 6.0(x) release, 6.0(4c) and later
-
Create pre-change analysis job
-
Navigate to Analyze > Analysis Hub > Pre-Change.
-
In Pre-Change, click Create Pre-Change Analysis. In Create Pre-Change Analysis, perform the following actions:
General
-
In the Pre-Change Analysis Name field, enter a name.
-
In the Description field, add a description for the analysis if you would like to.
-
In the Fabric field, choose the appropriate fabric.
-
In the Snapshot field, specify the appropriate snapshot.
Change
-
Under Change, choose the appropriate option. (Import JSON/XML File or Manual Changes).
Depending upon your selection, the relevant fields are displayed for you to populate.
Complete the selections as appropriate, and click Save or Save & Run.
After a Pre-Change Analysis job is completed, the Pre-Change Analysis table displays the status for the job as completed.
Click the Pre-Change Analysis Name for which you want to view the details. In a sidebar to the right, the details are displayed in a column including the general information such as the name of the job, snapshot, and change definition type. The list of changes modeled for the job are also available. If you are viewing a completed job, the anomalies that were generated as a result of the changes are displayed at the top of this page.
For completed jobs, click the icon on the top right of the sidebar to navigate to the results page. Further details about the job are available here under the specific tabs for Dashboard, Delta Analysis, Compliance Analysis.
Download pre-change analysis job
You can download an existing Pre-Change Analysis as follows:
-
In the Pre-Change Analysis table, click the appropriate pre-change analysis name for a completed Pre-Change Analysis job. Click the download icon to download the file.
-
The pre-change analysis downloads as an offline tar file with the pre-change analysis contents displayed in JSON format.
In the downloaded file, you can view all the attributes which include attributes that are modified and those that are not modified. If desired, the downloaded file can be uploaded to your Cisco APIC.
Collecting and analyzing your device logs using Log Collector
The Log Collector feature enables you to collect support logs for local usage and optionally upload the logs for the devices in your network to Cisco Intersight Cloud. It also enables Cisco TAC to trigger on-demand collection of logs for devices on the fabric and pulls the logs from Cisco Intersight Cloud.
The Log Collector has two modes:
-
User initiated - The user collects the logs for devices on the fabric and then uploads the collected logs to Cisco Intersight Cloud after the log collection job is completed. You can automatically upload the log files to Cisco Intersight Cloud after the log collection job is completed.
-
TAC initiated - Cisco TAC triggers on-demand collection of logs for specified devices and pulls the logs from Cisco Intersight Cloud.
Device connectivity notifier for TAC-initiated collector
Nexus Dashboard uses the device connectivity issue notifier on Nexus Dashboard to communicate with the devices. The notifier checks for TAC triggered on-demand collection of logs. In case the fabric is not configured properly to communicate with the device, Nexus Dashboard notifies the following:
-
The device is not configured for node interaction.
-
You can not run a Log Collector job on the device.
-
Nexus Dashboard cannot connect to the device.
If the node interaction is not healthy on the device, you cannot choose the device for Log Collector to collect logs. In the GUI, the device is greyed out.
Guidelines and Limitations
-
If you see the error message
Unable to Add Fabricwhen you try to create a new log collector job, this can sometimes occur if the local time is not synchronized properly on the PC where you are accessing the Nexus Dashboard GUI. Synchronize the local time on your PC and attempt to create the log collector job again to resolve the issue.
Log collector dashboard
Navigate to Analyze > Analysis Hub > Log Collector.
The Log Collector dashboard displays a graph of Logs by Job status for a particular fabric and displays the latest log collections.
The filter bar allows you to filters the logs by Status, Name, Node, start time, and end time. For standalone NX-OS fabrics, you can also filter by Type.
Use the following operators for the filter refinement:
| Operator | Description |
|---|---|
|
== |
With the initial filter type, this operator, and a subsequent value, returns an exact match. |
|
!= |
With the initial filter type, this operator, and a subsequent value, returns all that do not have the same value. |
|
contains |
With the initial filter type, this operator, and a subsequent value, returns all that contain the value. |
|
!contains |
With the initial filter type, this operator, and a subsequent value, returns all that do not contain the value. |
The page also displays the log collection jobs in a tabular format. The jobs are sorted by status. Choose the log collection job in the table to view additional details.
General
This displays the status of the job along with a graph showing the number of devices by status.
Details
The following information is listed:
-
Creation Time
-
End Time
-
Nodes
-
Job ID
Selected Nodes
This displays the list of nodes in a tabular form along with the status of each job and the upload status for the files uploaded.
Upload All Files allows you to upload all the files.
TAC-initiated log collector
The TAC initiated log collector enables Cisco TAC to trigger on-demand collection of logs for specified user devices in the Cisco Intersight Cloud to the Device Connector.
When the TAC assist job is complete, the new job appears in the Log Collector table. Choose the log collection job in the table to display additional details. The Log Collection status displays information such as status, general information, and node details.
You can save TAC assist job details as a PDF with the browser print option (Only supported on Chrome and Firefox).
Upload logs to Cisco Intersight Cloud
-
Ensure that Nexus Dashboard is connected to Cisco Intersight Cloud.
-
Ensure that Nexus Dashboard is connected to Cisco Intersight Device Connector.
Choose Analyze > Analysis Hub > Log Collector > Create Log Collector Job.
-
In the Log details section, enter a name in the Name field.
-
Click the drop-down list in the Fabric name field to choose a fabric.
-
(Optional) Check Auto Upload Log Files to automatically upload the log files to Cisco Intersight Cloud after the log collection job is completed.
-
Click Next.
-
In the Select Nodes section, use the Switches and Controllers tabs to choose the required nodes.
-
Click Next. The Summary section displays the entire job summary.
-
Click Submit to initiate the log collection process. When the job is completed, displays a message that says the job was successfully completed.
-
Click View log collector jobs to view log collection information in the Log Collector table.
-
Click on a job name listed in the Name column to view the details.
-
Choose the node and click
 icon.
icon. -
Click Upload File to TAC Assist to upload a single file for the chosen node manually.
-
Click Upload All to upload all the log files generated for the job.
The status of the upload is displayed in the Selected Nodes table.
Guidelines and Limitations
-
If the upload logs fails for some of the nodes and succeeds for the rest of the nodes, then in the Selected Nodes table, the status is displayed as Completed.
-
If the collection fails for some of the nodes, then the collection will continue for other nodes. After the collection is completed, the upload will start. In the Selected Nodes table, the combined status is displayed in the Status column.
-
If the collection succeeds for some of the nodes, but the upload fails, then in the Selected Nodes table, the status is displayed as Failed.
-
Auto Upload Log Files can be performed only on one node at a time.
Collecting information on bugs that might affect your network using Bug Scan
Beginning with Nexus Dashboard release 4.1.1, Bug Scan no longer detects Active bugs. You can only find information on Known Bug detection using the software version information. The Active bugs detection functionality will be re-introduced in a future release.
Nexus Dashboard collects technical support information from all the devices and runs them against known set of signatures, and flags the corresponding defects and PSIRTs. Nexus Dashboard also generates advisories for PSIRTs and anomalies for defects. See Detecting Anomalies and Identifying Advisories in Your Nexus Dashboard to learn more about Metadata support. Nexus Dashboard bug signatures are updated through Metadata information. The Metadata file is updated automatically if Nexus Dashboard is connected to Working with Cisco Intersight or can be manually updated.
The Bug Scan feature collects technical support logs from devices in a fabric and scans them for bugs that could have been hit. If the CPU and memory usage of the switches is below the set threshold of 65% then the tech support logs are collected and the Bug Scan is carried out for the devices. If the CPU and memory usage is above the set threshold, the devices are excluded from the Bug Scan and eventually will be reconsidered for the next default Bug Scan or when you run an on-demand Bug Scan for that device.
The switch connectivity must be healthy on the device for the Bug Scan process to successfully collect logs from the device.
You can also run an on-demand Bug Scan for a fabric. For more information, see the On-Demand Analysis section in Understanding your Nexus Dashboard Fabrics.
Bug scan schedule
Bug Scan runs for all the fabrics onboarded to Nexus Dashboard with a timer auto-scheduled every 7 or 14 days for each device, depending on the number of nodes and fabrics on the Nexus Dashboard cluster. This schedule is fixed and is not customizable.
Bug Scan for all switches of a fabric are included in the auto-schedule once they are onboarded in Nexus Dashboard. After that initial bug scan run occurs, it is then run again every 7 or 14 days. In situations where the bug scan either executes correctly or fails to execute on the device (for example, if the CPU and memory of the switch is higher than the target threshold), bug scan will run again in the next auto-scheduled timer.
On-demand Bug Scans are a user-triggered collection of technical support information from selected switches of a fabric. Those on-demand scans are prioritized over auto-scheduled runs and do not consider the CPU and memory metrics. On demand bug scans can be executed for up to 10 switches concurrently. If auto-scheduled Bug Scan is in progress and on-demand Bug Scan is initiated on other switches, based on the available resources in the Nexus Dashboard nodes the on-demand Bug Scan will start while the current Bug Scan is in progress or after the current Bug Scan is completed.
Only one Bug Scan at the time can run on a specific device.
A Bug Scan is triggered automatically in the following scenarios:
-
Switch or APIC controller upgrade or downgrade
-
Switch or APIC controller reloads
View known bugs
The Bug Scan feature collects technical support logs from devices in a fabric and scans them for bugs. You can view the known bugs affecting your network after the Bug Scan is completed.
Known Bugs - Bugs present in the software version that may potentially impact your network. These bugs do not require a bug signature but are based only on the software version match and not on switch configurations or tech-support.
Only Severity 1 to Severity 3 bugs attached to the Release Notes of a certain ACI or NX-OS release are considered known bugs.
-
Navigate to Analyze > Analysis Hub > Bug Scan.
-
Choose an online fabric or multiple online fabrics from the drop-down list.
-
Choose the software version from the drop-down list. The known bugs for the chosen fabrics and software versions are displayed.
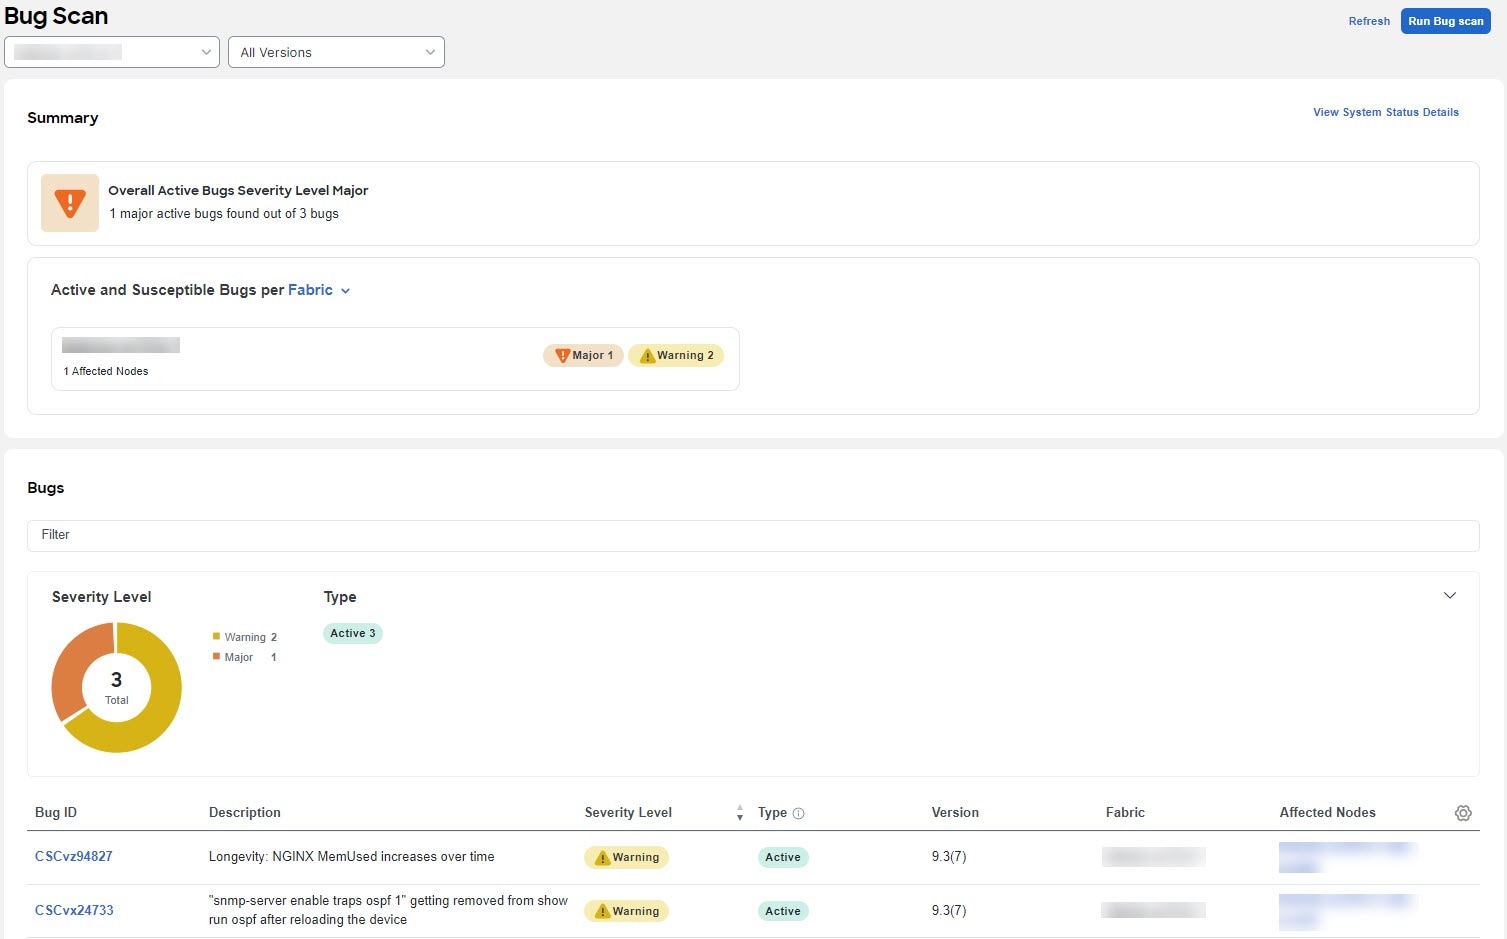
-
The Summary area displays the overall bugs by severity. You can also view the Bugs per fabric or software version using the drop-down list.
-
In the Bugs area, use the filter bar to filter the bugs by bug ID, description, severity level, type, and affected nodes.
-
View the Severity Level donut chart to see the total number of bugs of Critical, Major, and Warning severity.
-
View the bugs table to see the filtered bugs.
-
Click the column heading to sort the bugs in the table.
-
Click the gear icon to configure the columns in the table.
-
Click Bug ID to view bug details.
-
-
Click Run Bug Scan to run an on-demand Bug Scan. Choose a fabric and click Run Now. For more information, see the On-demand analysis section in Understanding your Nexus Dashboard Fabrics.
View known bugs for an individual fabric
In Nexus Dashboard, you can also view the bugs for an individual fabric in the following ways:
-
Navigate to Mange > Fabrics
-
Choose Online Fabrics from the drop-down list.
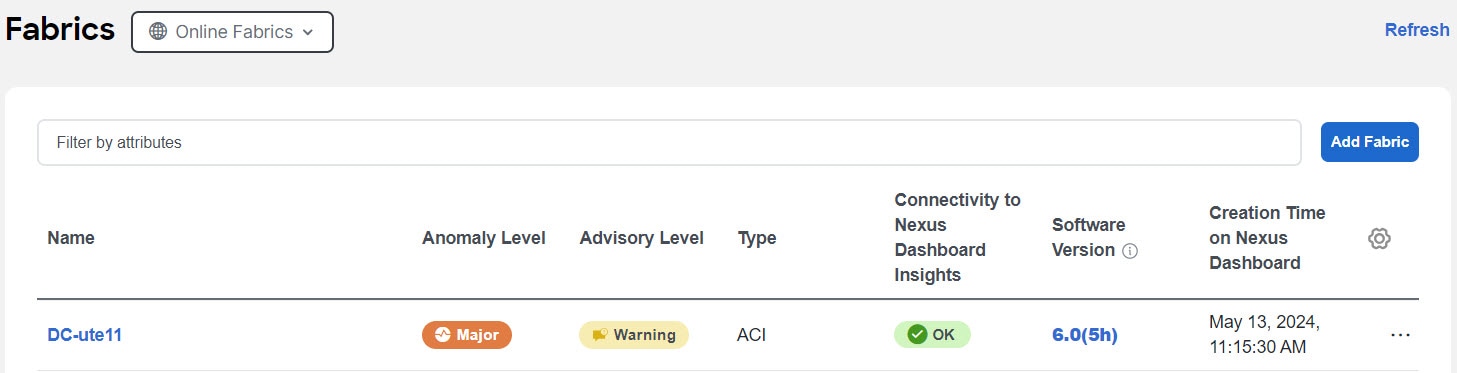
-
In the Software Version column, click on a version to open the drawer that lists the software versions, number of nodes on each version, and total bugs.
-
Click View all in the drawer to view the known bugs for that fabric and version.
OR
-
Navigate to Manage > Fabrics.
-
Choose a fabric.
-
In the General area, click on Show more under Fabric bugs to open the software version drawer.
-
Click View all in the drawer to view the known bugs for that fabric and version.
-
For ACI fabrics, you can also click the APIC software version to directly view the known bugs for that version.
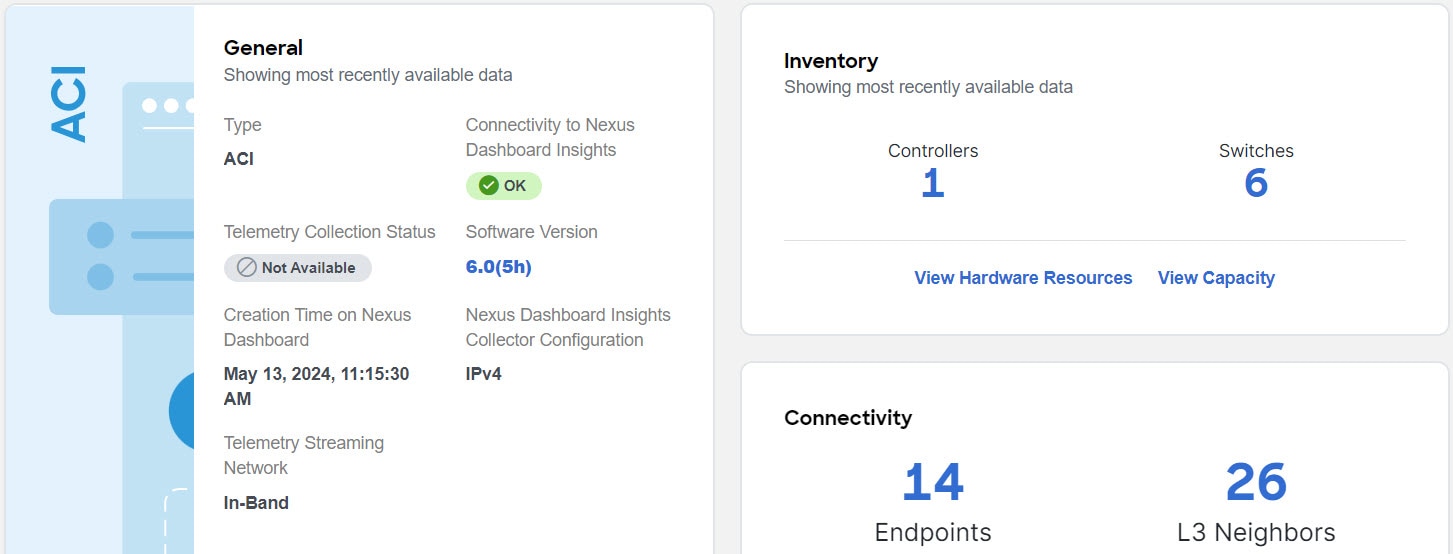
-
OR
-
Navigate to Manage > Inventory
-
Choose Online Fabrics from the drop-down list.
-
In the Controllers tab click the software version in the Controller table to directly view the known bugs for that fabric and version.
-
Click the Switches tab and click the software version in the Switches table to directly view the known bugs for that fabric and version.
-
Click Run Bug Scan from the Actions drop-down list in any of these views to run an on-demand Bug Scan. For more information, see the On-demand analysis section in Understanding your Nexus Dashboard Fabrics.
The option to view bugs through Manage > Fabric Software Management > Firmware Summary is no longer valid.
Tracking endpoints within a data center using Endpoint Locator (NX-OS fabrics)
The Endpoint Locator (EPL) feature allows real-time tracking of endpoints within a data center. The tracking includes tracing the network life history of an endpoint and getting insights into the trends that are associated with endpoint additions, removals, moves, and so on. An endpoint is anything with at least one IP address (IPv4 and\or IPv6) and MAC address. EPL feature is also capable of displaying MAC-Only endpoints. By default, MAC-Only endpoints are not displayed. An endpoint can be a virtual machine (VM), container, bare-metal server, service appliance and so on.
-
EPL is supported for VXLAN BGP EVPN fabric deployments only in the Nexus Dashboard LAN fabric installation mode. The VXLAN BGP EVPN fabric can be deployed as Easy fabric, Easy eBGP fabric, or an External fabric (managed or monitored mode). EPL is not supported for 3-tier access-aggregation-core based network deployments.
-
EPL displays endpoints that have at least one IP address (IPv4 and/or IPv6). EPL is also capable of displaying MAC-Only endpoints. Select the Process MAC-Only Advertisements checkbox while configuring EPL to enable processing of EVPN Route-type 2 advertisements having a MAC address only. L2VNI:MAC is the unique endpoint identifier for all such endpoints. EPL can now track endpoints in Layer-2 only network deployments where the Layer-3 gateway is on a firewall, load-balancer, or other such nodes.
EPL relies on BGP updates to track endpoint information. Hence, typically the Nexus Dashboard must peer with the BGP Route-Reflector (RR) to get these updates. For this purpose, IP reachability from the Nexus Dashboard to the RR is required. This can be achieved over in-band network connection to the Nexus Dashboard Data Network interface. There is no option to configure static routes for pods on ND, so the selected RRs must be reachable through the default data network gateway.
Some key highlights of the Endpoint Locator are:
-
Support for dual-homed and dual-stacked (IPv4 + IPv6) endpoints
-
Support for up to two BGP Route Reflectors or Route Servers
-
Support real-time and historical search for all endpoints across various search filters such as VRF, Network, Layer-2 VNI, Layer-3 VNI, Switch, IP, MAC, port, VLAN, and so on.
-
Support for real-time and historical dashboards for insights such as endpoint lifetime, network, endpoint, VRF daily views, and operational heat map.
-
Support for iBGP and eBGP based VXLAN EVPN fabrics. The fabrics may be created as Easy Fabrics or External Fabrics. EPL can be enabled with an option to automatically configure the spine or RRs with the appropriate BGP configuration.
-
You can enable the EPL feature for upto 4 fabrics.
-
EPL is supported on Multi-Site Domain (MSD).
-
IPv6 underlay is not supported.
-
Support for high availability
-
Support for endpoint data that is stored for up to 60 days, amounting to a maximum of 2 GB storage space.
-
Support for optional flush of the endpoint data to start afresh.
-
Supported scale: Maximum of 50K unique endpoints per fabric. A maximum of 4 fabrics is supported. However, the maximum total number of endpoints across all fabrics should not exceed 100K.
If the total number of endpoints across all fabrics exceeds 100K, an alarm is generated and is listed under the Alarms icon at the top right of the window. This icon starts flashing whenever a new alarm is generated.
-
Persistent or External IP addresses are required to enable EPL. For each VXLAN fabric, a specific container is spawned running a BGP instance to peer with the spines of the fabric. This container must have a persistent IP associated that is then configured as a iBGP neighbor on the spines. A different container is used for each fabric, so the number of fabrics that are managed by Nexus Dashboard where EPL is enabled decides how many persistent IP addresses must be distributed for EPL. Also, the EPL establishes iBGP sessions only over the Nexus Dashboard Data interface. The reachability from Nexus Dashboard to the switches must be over the in-band, also known as the front-panel ports.
-
You can disable promiscuous mode on the port-groups that are associated with the Nexus Dashboard Management or Data vNICs. The Persistent IP addresses are given to the pods (for example, SNMP Trap/Syslog receiver, Endpoint Locator instance per Fabric, SAN Insights receiver, and so on). Every POD in Kubernetes can have multiple virtual interfaces. Specifically for IP stickiness an extra virtual interface is associated with the POD that is allocated an appropriate free IP in the external service IP pool. The vNIC of the POD that has the Persistent IP shares the same MAC address of Nexus Dashboard bond0 or bond1 interface. Therefore, the POD sources the packets using the same MAC address of Nexus Dashboard bond0 or bond1 interfaces that are known by the VMware ESXi system.
If you are using a Virtual Cisco Nexus Dashboard Cluster before you begin, ensure that the Persistent IP addresses, EPL feature, and required settings are enabled. See the Nexus Dashboard Installation and Upgrade Guide for more information. === EPL behavior with NX-API configuration
When the NX-API option is enabled on supported fabrics, such as the VXLAN, Enhanced Classic LAN, eBGP, and Campus fabrics, the EPL feature behavior is as follows:
-
Dashboard counter for dual attached endpoints is populated.
-
Endpoints discovered under a vPC pair will have the switch name set to the specific switch the endpoint is found under.
-
Endpoints under ports such as the vPC Peer-Link or as a port name that contains sup, for example, sup eth1(
R), will be filtered out from being discovered.
For more information on NX-API field related information, see the Advanced section in Fabric Management.
When the NX-API option is disabled, the EPL feature bahvior is as follows:
-
Dashboard counter for Dual Attached Endpoints is always 0.
-
VLAN and port for endpoints are left empty.
-
The VRF field for endpoints is set to VRF ID instead of VRF name.
-
Endpoints under a vPC pair will have the switch name set to the name of both switches in the vPC pair.
-
Endpoints with ports such as vPC Peer-Link(
R) or has a port name that contains sup, for example, supeth1(R), will be discovered without the port name and displayed as part of the dashboard data.
Backup and Restore
EPL only backups data for fabrics that EPL has been configured. If EPL is disabled for a fabric (even if EPL has previously been configured there), then you cannot backup the data for that fabric. Also, you can backup only historical data (data on the Endpoint Search page).
If a backup is initiated when EPL is enabled, then when restoring the backup, the same external data IPs that EPL was using must be available on ND. If those IPs are not available, then select the Ignore External Service IP Configuration option in the restore backup form. However, there are chances that the EPL pods will be brought up with different IPs, so any existing EPL policies become invalid. If EPL was previously configured with the Configure My Fabric option, you need to disable and enable EPL so that the old policy is cleaned up and an updated policy is deployed. If you did not use the Configure My Fabric option, then manually update their config with the new IPs.
EPL Connectivity Options
Sample topologies for the various EPL connectivity options are as given below.
Nexus Dashboard Cluster Mode: Physical Server to VM Mapping
Refer to the Nexus Dashboard Verified Scalability Guide for more information.
Configuring Endpoint Locator
The Nexus Dashboard OVA or the ISO installation comes with two interfaces:
-
Management
-
Data
The Management interface provides reachability to the devices via the mgmt0 interface either Layer-2 or Layer-3 adjacent. This allows Nexus Dashboard to manage and monitor these devices including POAP. EPL requires BGP peering between the Nexus Dashboard and the Route-Reflector. Since the BGP process on Nexus devices typically runs on the default VRF, in-band IP connectivity from the Nexus Dashboard to the fabric is required. The data network interface can be configured during Nexus Dashboard installation. You can’t modify the configured in-band network configurations.
The setup of Data network interface on the Nexus Dashboard is a prerequisite of any application that requires the in-band connectivity to the devices within fabric. This includes EPL and Network Insights Resources (NIR).
As mentioned earlier, for EPL to function, IP reachability must be present over the ND data interface to the spine BGP loopback interface IPs. Typically the reachability to the remote ND cluster is established via the border switches in the default VRF.
For redundancy purposes, it is always advisable to have the server on which the Nexus Dashboard is installed to be dual-homed or dual-attached. With the OVA Nexus Dashboard deployment, the server can be connected to the switches via a port-channel. This provides link-level redundancy. To also have node-level redundancy on the network side, the server may be attached to a vPC pair of Leaf switches. In this scenario, the switches must be configured such that the HSRP VIP serves as the default gateway of the Data Network interface on the Nexus Dashboard.
After you establish the in-band connectivity between the physical or virtual Nexus Dashboard and the fabric, you can establish BGP peering.
During the EPL configuration, the route reflectors (RRs) are configured to accept Nexus Dashboard as a BGP peer. During the same configuration, the Nexus Dashboard is also configured by adding routes to the BGP loopback IP on the spines/RRs via the Data Network Interface gateway.
Cisco Nexus Dashboard queries the BGP RR to glean information for establishment of the peering, such as ASN, RR, and IP.
To configure Endpoint Locator from the Cisco Nexus Dashboard Web UI, in the fabric Overview page, choose Actions > Configuration > Configure Endpoint Locator. Similarly, you can configure EPL on the Topology page. Right-click on the required fabric, then click More > Configure Endpoint Locator. The Endpoint Locator window appears.
You can enable EPL for one fabric at a time.
Select the switches on the fabric hosting the RRs from the drop-down list. Cisco Nexus Dashboard will peer with the RRs.
By default, the Configure My Fabric option is selected. This option only configures EPL as a BGP neighbor of the switch and this option does not configure network reachability between EPL and the switch. This knob controls whether BGP configuration will be pushed to the selected spines/RRs as part of the enablement of the EPL feature. If the spine/RR needs to be configured manually with a custom policy for the EPL BGP neighborship, then this option should be unchecked. For external fabrics that are only monitored and not configured by Nexus Dashboard, this option is greyed out as these fabrics are not configured by Nexus Dashboard.
Select the Process MAC-Only Advertisements option to enable processing of MAC-Only advertisements while configuring the EPL feature.
If EPL is enabled on a fabric with or without selecting the Process Mac-Only Advertisements checkbox and you want to toggle this selection later, then you have to first disable EPL and then click Database Clean-up to delete endpoint data before re-enabling EPL with the desired Process Mac-Only Advertisements setting.
Select Yes under Collect Additional Information to enable collection of additional information such as PORT, VLAN, VRF etc. while enabling the EPL feature. To gather additional information, NX-API must be supported and enabled on the switches, ToRs, and leafs. If the No option is selected, this information will not be collected and reported by EPL.
For all fabrics except external fabrics, NX-API is enabled by default. For external fabrics, you have to enable NX-API in the external fabric settings by selecting the Enable NX-API checkbox in the Advanced tab of the External_Fabric_11_1 fabric template.
Click the Config preview button to view the configuration that will be pushed to the switches while enabling EPL. You can copy and paste this configuration on spines or border gateway devices to enable EPL on external monitored fabrics.
Once the appropriate selections are made and various inputs have been reviewed, click Submit to enable EPL. If there are any errors while you enable EPL, the enable process aborts and the appropriate error message is displayed. Otherwise, EPL is successfully enabled.
The Nexus Dashboard Data Service IP is used as BGP EVPN neighbor.
When the Endpoint Locator feature is enabled, there are a number of steps that occur in the background. Nexus Dashboard contacts the selected RRs and determines the ASN. It also determines the interface IP that is bound to the BGP process. Also, appropriate BGP neighbor statements are added on the RRs or spines in case of eBGP underlay, to get them ready to accept the BGP connection that will be initiated from the Nexus Dashboard. The external Nexus Dashboard Data Service IP address that is assigned to the EPL pod will be added as the BGP neighbor. Once EPL is successfully enabled, the user is automatically redirected to the EPL dashboard that depicts operational and exploratory insights into the endpoints that are present in the fabric.
For more information about the EPL dashboard, see Monitoring Endpoint Locator.
Configuring Endpoint Locator for Single VXLAN EVPN Site
In the following figure, the Nexus Dashboard service application is attached to the VPC pair of Leaf switches as it provides the link and node-level redundancy. The BGP instance running on EPL container establishes iBGP peering with the fabric spines. The iBGP peering is between Spine loopback addresses (loopback0) and EPL container persistent IP addresses. The loopback0 address of Spines is reachable via VXLAN Underlay, therefore, EPL container IP must have IP reachability towards the spines. We can configure an SVI on Leaf switches that can provide IP connectivity. The SVI will be a non-VXLAN enabled VLAN and will only participate in the underlay.
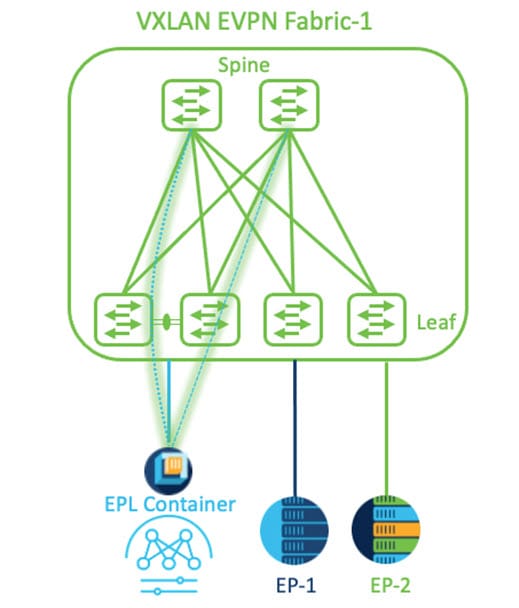
To configure endpoint locator for single VXLAN EVPN site, perform the following steps:
-
You must configure persistent IP addresses on Cisco Nexus Dashboard. On Nexus Dashboard, choose Admin > System Settings.
-
In the External Pools card, click Edit.
The External Service Pools window appears.
-
In the Persistent data IPs area, click + Add IP Address and enter the necessary persistent IP addresses. Click the checkmark for each IP address that you enter.
The IP address must be associated with Nexus Dashboard Data Pool. A single persistent IP address is required to visualize and track EPs for a single site.
-
Configure SVI using FHRP for ND Data Interface and Underlay IP connectivity.
You can use switch_freeform policy on fabric Leaf 1.
To create a freeform policy, perform the following steps:
-
Choose Manage > Fabrics, then click on the required fabric.
The fabric Overview page for this fabric appears.
-
Click Configuration Policies > Policies.
-
Click Actions > Add policy.
The Create Policy window appears.
-
Choose the appropriate leaf switch from the Switch List drop-down list and click Choose Template.
-
On Select Policy Template window, choose switch_freeform template and click Select.
Apply FHRP configurations and save the template.
Deploy the template configuration.
In this example, SVI 100 with HSRP gateway created on fabric Leaf 1. Similarly, repeat the steps for fabric Leaf 2.
The following is a configuration example:
feature hsrp
vlan 100
name EPL-Inband
interface Vlan100
  no shutdown
  no ip redirects
  ip address 192.168.100.252/24
  no ipv6 redirects
  ip router ospf 100 area 0.0.0.0
  hsrp 100
    ip 192.168.100.254
-
-
Verify IP reachability between Nexus Dashboard Data Interface and fabric switches.
-
Enable EPL at fabric level.
-
In the fabric Overview page, choose Actions > Configuration > Configure Endpoint Locator.
-
Choose the appropriate switches on the fabric hosting the Spine/Route Reflector RRs from the drop-down list.
Choose Configure my Fabric option for knob controls.
Whether BGP configuration will be pushed to the selected Spines/RRs as part of the enablement of the EPL feature. If the Spine/RR needs to be configured manually with a custom policy for the EPL BGP neighborship, then this option should be unchecked. For external fabrics that are only monitored and not configured on Nexus Dashboard this option is grayed out. As these fabrics are not configured on Nexus Dashboard.
Choose Process MAC-Only Advertisements option to enable processing of MAC-Only advertisements while configuring the EPL feature.
If EPL is enabled on a fabric with or without selecting the Process Mac-Only Advertisements checkbox and you want to toggle this selection later, you must first click Database Clean-up to delete endpoint data while EPL is still enabled. Attempting to clean the database while EPL is disabled will result in an error. After the cleanup is complete, you can disable and then re-enable EPL with the desired Process Mac-Only Advertisements setting.
Choose Yes in Collect Additional Information to enable collection of additional information such as PORT, VLAN, and VRF while enabling the EPL feature. To access additional information, NX-API must be supported and enabled on the switches, ToRs, and leafs. If you choose the No option, this information won’t be collected and reported by EPL.
For all fabrics except external fabrics, NX-API is enabled by default. For external fabrics, you must enable NX-API in the external fabric settings, choose Enable NX-API checkbox in the Advanced tab of the External_Fabric_11_1 fabric template.
Click the Preview icon to view a template of the configuration that is pushed to the switches enabling EPL. This configuration can be copied and pasted on spines or border gateway devices to enable EPL on external monitored fabrics.
Once the appropriate selections are made and various inputs have been reviewed, click Save Config to enable EPL. If there are any errors while you enable EPL, the enable process aborts and the appropriate error message are displayed. Otherwise, EPL is successfully enabled. Once the EPL is enabled, the Persistent IP will be in-use.
-
Configuring Endpoint Locator for interconnected VXLAN fabrics
The below figure enables EPL for interconnected VXLAN fabrics. The BGP peering’s are established between the Spines/RRs of each interconnected VXLAN fabric and Nexus Dashboard EPL Container. The Persistent IPs are required based on the number of VXLAN EVPN sites. The Nexus Dashboard application hosted on Cisco ND Cluster is located on Site 1. The routing information to reach the Spines/RRs deployed in the remote site must be exchanged across the interconnected VXLAN fabrics. Once the BGP session is formed, local EPs of Fabric 2 can be visualized and tracked.
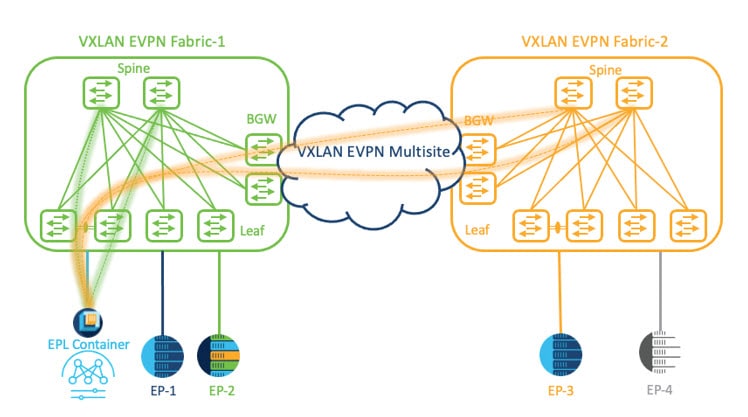
By default, Nexus Dashboard data Interface and Site 2 Spines/RRs loopback prefixes are not advertised across the BGWs. Therefore, prefixes must be exchanged using custom route maps and prefix lists across the sites. At the same time, route redistribution between OSPF and BGP is required as Spines/RRs loopback prefixes are part of OSPF protocol while BGWs peer with each other using BGP.
To configure endpoint locator for interconnected VXLAN fabrics, perform the following steps:
-
You must configure persistent IP addresses on Cisco Nexus Dashboard. On Nexus Dashboard, choose Admin > System Settings.
-
In the External Pools card, click Edit.
The External Service Pools window appears.
-
In the Persistent data IPs area, click + Add IP Address and enter the necessary persistent IP addresses. Click the checkmark for each IP address that you enter.
Ensure that the IP addresses are associated with Nexus Dashboard Data Pool. Two persistent IP addresses are required to visualize and track EPs for a multisite with two member fabrics. One Persistent Data IP address is used as EPL container IP to establish BGP session with Site 1 fabric. A new Persistent IP address is configured that can be used to peer with Site 2 fabric.
-
Configure Route Redistribution for VXLAN EVPN Fabrics.
Route Redistribution for Fabric 1
The following switch_freeform policy can be used on Fabric 1 BGWs. To create a new switch_freeform policy, refer to the above examples.
The example below shows a sample configuration:
ip prefix-list site-2-rr seq 5 permit 20.2.0.1/32 >> Site 2 RR
ip prefix-list site-2-rr seq 6 permit 20.2.0.2/32 >> Site 2 RR
ip prefix-list epl-subnet seq 5 permit 192.168.100.0/24 >> EPL Subnet

route-map bgp-to-ospf permit 10
   match ip address prefix-list site-2-rr
route-map ospf-to-bgp permit 10
   match ip address prefix-list epl-subnet

router ospf 100
   redistribute bgp 100 route-map bgp-to-ospf

router bgp 100
   address-family ipv4 unicast
       redistribute ospf 100 route-map ospf-to-bgp
Route Redistribution for Fabric 2
The following switch_freeform policy can be used on Fabric 2 BGWs. To create a new switch_freeform policy, refer to the above examples.
The example below shows a sample configuration:
ip prefix-list site-2-rr seq 5 permit 20.2.0.1/32 >> Site 2 RR ip prefix-list site-2-rr seq 6 permit 20.2.0.2/32 >> Site 2 RR ip prefix-list epl-subnet seq 5 permit 192.168.100.0/24 >> EPL Subnet route-map bgp-to-ospf permit 10 match ip address prefix-list epl-subnet route-map ospf-to-bgp permit 10 match ip address prefix-list site-2-rr router ospf 200 redistribute bgp 200 route-map bgp-to-ospf router bgp 200 address-family ipv4 unicast redistribute ospf 200 route-map ospf-to-bgp -
To configure EPL, in the fabric Overview page, choose Actions > Configuration > Configure Endpoint Locator.
-
Choose the appropriate switches on the fabric hosting the Spine/Route Reflector RRs from the drop-down list.
Once the appropriate selections are made and various inputs have been reviewed, click Save Config to enable EPL. If there are any errors while you enable EPL, the enable process aborts and the appropriate error message is displayed. Otherwise, EPL is successfully enabled. Once the EPL is enabled, the Persistent IP will be in-use.
You can view EPL enabled for fabric-1 and fabric-2 successfully. To view and track EPs, see Monitoring Endpoint Locator.
Configuring Endpoint Locator for vPC Fabric Peering Switches
Networks Administrator can create vPC between a pair of switches using a Physical Peer Link or Virtual Peer link. vPC Fabric Peering provides an enhanced dual-homing access solution without the overhead of wasting physical ports for vPC Peer Link. For Virtual Peer link, EPL can still be connected to vPC pair of Leaf switches for the link and node-level redundancy. However, VXLAN VLAN (Anycast Gateway) as the First hop for EPL will be used. The loopback0 address of Spines/RRs is reachable only via VXLAN Underlay, while VXLAN VLAN will be part of a Tenant VRF. Therefore, to establish IP communication, route-leaking is configured between Tenant VRF and Default VRF. For more information, refer to vPC Fabric Peering section.
To configure endpoint locator for vPC Fabric Peering switches perform the following steps:
-
You must configure persistent IP addresses on Cisco Nexus Dashboard. On Nexus Dashboard, choose Admin > System Settings.
-
In the External Pools card, click Edit.
The External Service Pools window appears.
-
In the Persistent data IPs area, click + Add IP Address and enter the necessary persistent IP addresses. Click the checkmark for each IP address that you enter.
-
Create a Tenant VRF and Anycast Gateway on the vPC fabric peering switches.
-
Configure Route-leaking between Tenant VRF and Default VRF.
Advertise from Tenant VRF to Default VRF.
The following switch_freeform policy can be used on fabric Leaf where ND is connected.
ip prefix-list vrf-to-default seq 5 permit 192.168.100.0/24 >> EPL subnet
route-map vrf-to-default permit 10
  match ip address prefix-list vrf-to-default
vrf context epl_inband
  address-family ipv4 unicast
    export vrf default map vrf-to-default allow-vpn
router ospf UNDERLAY
   redistribute bgp 200 route-map vrf-to-default
NOTE: For the hosts behind the orphan ports, the prefix-list used for route leaking in the route-map must include 'ge' keyword at the end for longer prefix matches, such as the /32 of a host route.
For example:
ip prefix-list vrf-to-default seq 5 permit 192.168.100.0/24 ge 24Advertise from Default VRF to Tenant VRF.
The following switch_freeform policy can be used on fabric Leaf where ND is connected.
ip prefix-list default-to-vrf seq 5 permit 20.2.0.3/32 >> Spine loopback IP ip prefix-list default-to-vrf seq 6 permit 20.2.0.4/32 >> Spine loopback IP route-map default-to-vrf permit 10 match ip address prefix-list default-to-vrf vrf context epl_inband address-family ipv4 unicast import vrf default map default-to-vrf router bgp 200 address-family ipv4 unicast redistribute ospf UNDERLAY route-map default-to-vrf -
Enable EPL at fabric level.
-
To configure EPL, in the fabric Overview page, choose Actions > Configuration > Configure Endpoint Locator.
-
Choose the appropriate switches on the fabric hosting the Spine/Route Reflector RRs from the drop-down list.
Once the appropriate selections are made and various inputs have been reviewed, click Save Config to enable EPL. If there are any errors while you enable EPL, the enable process aborts and the appropriate error message is displayed. Otherwise, EPL is successfully enabled. Once the EPL is enabled, the Persistent IP will be in-use.
-
Configuring Endpoint Locator for External Fabrics
In addition to Easy fabrics, Nexus Dashboard allows you to enable EPL for VXLAN EVPN fabrics comprising of switches that are imported into the external fabric. The external fabric can be in managed mode or monitored mode, based on the selection of Fabric Monitor Mode flag in the External Fabric Settings. For external fabrics that are only monitored and not configured by Nexus Dashboard, this flag is disabled. Therefore, you must configure BGP sessions on the Spine(s) via OOB or using the CLI. To check the sample template, click ℹ icon to view the configurations required while enabling EPL.
In case the Fabric Monitor Mode checkbox in the External Fabric settings is unchecked, then EPL can still configure the spines/RRs with the default Configure my fabric option. However, disabling EPL would wipe out the router bgp config block on the spines/RRs. To prevent this, the BGP policies must be manually created and pushed onto the selected spines/RRs.
Configuring Endpoint Locator for eBGP EVPN Fabrics
You can enable EPL for VXLAN EVPN fabrics, where eBGP is employed as the underlay routing protocol. Note that with an eBGP EVPN fabric deployment, there is no traditional RR similar to iBGP. The reachability of the in-band subnet must be advertised to the spines that behave as Route Servers.
To configure EPL for eBGP EVPN fabrics from the Cisco Nexus Dashboard Web UI, perform the following steps:
-
Choose Manage > Fabrics.
Select the fabric to configure eBGP on or create an eBGP fabric with the VXLAN template.
-
Use the leaf_bgp_asn policy to configure unique ASNs on all leaf switches.
-
Add the ebgp_overlay_leaf_all_neighbor policy to each leaf.
Fill Spine IP List with the spines' BGP interface IP addresses, typically the loopback0 IP addresses.
Fill BGP Update-Source Interface with the leaf’s BGP interface, typically loopback0.
-
Add the ebgp_overlay_spine_all_neighbor policy to each spine.
Fill Leaf IP List with the leaves' BGP interface IPs, typically the loopback0 IPs.
Fill Leaf BGP ASN with the leaves' ASNs in the same order as in Leaf IP List.
Fill BGP Update-Source Interface with the spine’s BGP interface, typically loopback0.
After the in-band connectivity is established, the enablement of the EPL feature remains identical to what is listed so far. EPL becomes a iBGP neighbor to the Route Servers running on the spines.
Flushing the Endpoint Database
After you enable the Endpoint Locator feature, you can clean up or flush all the Endpoint information. This allows starting from a clean-slate with respect to ensuring no stale information about any endpoint is present in the database. After the database is clean, the BGP client re-populates all the endpoint information learnt from the BGP RR. You can flush the endpoint database even if you have not re-enabled the EPL feature on a fabric on which the EPL feature was previously disabled.
To flush all the Endpoint Locator information from the Cisco Nexus Dashboard Web UI, perform the following steps:
-
In the fabric Overview page, choose Actions > Configuration > Configure Endpoint Locator
-
Click Database Cleanup.
-
Click Delete to continue or Cancel to abort.
Monitoring Endpoint Locator
Information about the Endpoint Locator is displayed on a single landing page or dashboard. The dashboard displays an almost real-time view of data (refreshed every 30 seconds) pertaining to all the active endpoints on a single pane. From this dashboard, you can access Endpoint History, Endpoint Search, and Endpoint Life. From this dashboard, you can access Endpoint History, Endpoint Search, and Endpoint Life.
Disabling Endpoint Locator
Follow these steps to disable endpoint locator from the Cisco Nexus Dashboard UI.
-
In the fabric Overview page, choose Actions > Configuration > Configure Endpoint Locator.
The Endpoint Locator page appears.
-
Click Disable.
When EPL is disabled, BGP neighbor configuration is removed from the switches and the EPL worker pod is terminated. Historical endpoint data is retained in the databases unless explicitly cleared using the Clear Fabric Data option.