
New and changed information
New and changed information
The following table provides an overview of the significant changes up to this current release. The table does not provide an exhaustive list of all changes or of the new features up to this release.
| Release Version | Feature | Description |
|---|---|---|
|
Nexus Dashboard 4.1.1 |
Improved navigation and workflow when working with inventory ACI fabrics |
Beginning with Nexus Dashboard 4.1.1, the navigation and workflow for managing inventory ACI fabrics is enhanced. |
|
Nexus Dashboard 4.1.1 |
Switch port visualization for Nexus Dashboard ACI fabrics |
With this release, Nexus Dashboard added a port legend for viewing switch ports and their attributes. Switch ports are color-coded based on operational status. Red indicates a down operational status, while green indicates a healthy operational status. For more information, see Switch port visualization details. |
Navigate to Inventory for ACI fabrics

In order to view ACI inventory information (Switches, Controllers, and vPC Pairs), you must first enable telemetry within the ACI fabric settings. Refer to Editing ACI Fabric Settings for more information.
Inventory provides information on controllers and switches in your Nexus Dashboard ACI fabrics.
To navigate to Inventory for ACI fabrics:
-
Click Manage > Fabrics > Local.
-
Click on the appropriate ACI fabric.
The Overview page for that ACI fabric appears.
-
Click Inventory.
-
Click Controllers to see high-level information on the controllers.
-
Click Switches to see high-level information on the switches.
-
Click vPC Pairs to see high-level information on the vPC pairs.
-
If a switch or hostname is modified, it takes around 2 hours for the updated switch or hostname to be reflected in Inventory.
Controllers
To navigate to Controllers for an ACI fabric:
-
Click Controllers.
Controllers provides the following high-level information on all of the controllers in Nexus Dashboard. The gear icon allows you to customize the table by hiding some of the columns. By default, all columns are visible.
The table can also be filtered based on the columns available.
| Field | Description |
|---|---|
|
Node Name |
The name of each controller |
|
Anomaly Level |
The anomaly levels experienced by each controller |
|
Advisory Level |
The advisory levels experienced by each controller |
|
Type |
The type for each controller (physical or virtual) |
|
Operational Status |
The operational status for each controller to Nexus Dashboard |
|
Software Version |
The version of the software on the controller |
|
Model |
The model type for each controller |
|
Serial Number |
The serial number for the specific switch |
Controller details
You’ll see Overview, Anomalies and Advisories that will provide more information on the controller, with Overview shown first by default.
Overview
Overview has the following additional information.
-
Anomaly Level
Click Anomaly Level to get more specific information on the anomalies present for this controller. A slide-in appears, showing all the anomalies that occurred for this controller. See Detecting Anomalies and Identifying Advisories in Your ND to understand how to navigate across the anomalies.
-
Advisory Level
Hover over the Advisory Level to see what category the advisories belong to. Click Advisory Level to get more specific information on the advisories present for this controller. A slide-in appears, showing all the advisories that occurred for this controller. See Detecting Anomalies and Identifying Advisories in Your ND to understand how to navigate across the advisories.
-
General
General displays the following information:
| Field | Description |
|---|---|
|
Fabric |
The fabric where each controller resides |
|
Role |
The role defines what the device is |
|
Connectivity to Insights |
This shows the connectivity of the controller. |
|
Software Version |
The version of the software on the controller |
|
Last Software Update |
The date when the software was last updated on this controller. |
|
Uptime |
The amount of time that this controller has been up. You will also see when the controller was last rebooted. |
|
Model |
The model type for each controller |
|
Serial Number |
The serial number for this controller. |
|
Out-of-Band IPv4 Address |
The IP address for the out-of-band management of this controller. |
|
Out-of-Band IPv6 Address |
The IP address for the out-of-band management of this controller. |
|
In-Band IPv4 Address |
The IP address for the in-band management of this controller. |
|
In-Band IPv6 Address |
The IP address for the in-band management of this controller. |
|
Type |
The type for each controller (physical or virtual) |
|
Created At |
The date when the controller was created. |
Anomalies
The Anomaly level shows the total number of anomalies that have occurred and the number of anomalies that have occurred in the last week.
Hover over the Anomaly Level to view the category of the anomalies occurred. Click the Anomaly Level to get specific information on the anomalies present for the specific controller or switch.
See Detecting Anomalies and Identifying Advisories in Your ND to understand how to navigate across the anomalies.
Advisories
The Advisories displays several levels of advisory severity for controller hardware and software in your network. To see an overall advisories dashboard for this controller, click Advisories. An advisories dashboard appears for this controller.
See Detecting Anomalies and Identifying Advisories in Your ND to understand how to navigate across the advisories. See Filtering information for filter refinement using certain operators.
Switches
To navigate to Switches for an ACI fabric:
-
Click Switches.
Switches provides the following high-level information on the switches. The gear icon allows you to customize the table by hiding some of the columns. By default, all columns are visible. The table can also be filtered based on the columns available.
To get additional information on any single switch, click that switch under the Name column.
| Field | Description |
|---|---|
|
Name |
The name of each switch |
|
Anomaly Level |
The anomaly levels experienced by each switch |
|
IP Address |
The IP address for each switch |
|
Model |
The model type for each switch |
|
Role |
Displays the role of switch. |
|
Serial Number |
The serial number for the specific switch |
|
Discovery Status |
The discovery status of the switches |
|
Advisory Level |
The advisory levels experienced by each switch |
|
vPC Role |
The vPC role for each switch |
|
vPC Peer |
The vPC peer for each switch |
|
Mode |
The mode for each switch |
|
Software Version |
The software version in which the switch is available |
|
Uptime |
The amount of uptime for each switch |
Switch details
You’ll see the following that will provide more information on that switch.
Overview details
These cards appear below Overview on the Switch Overview page.
-
Anomaly level
Hover over the Anomaly level to see what category the anomalies belong to. Click the Anomaly level to get more specific information on the anomalies present for this controller. A slide-in appears, showing all the anomalies that occurred for this controller. For more information, see Detecting Anomalies and Identifying Advisories in Your ND to understand how to navigate across the anomalies.
-
Advisory level
Hover over the Advisory level to see what category the advisories belong to. Click the Advisory level to get more specific information on the advisories present for this switch. A slide-in appears, showing all the advisories that occurred for this switch. For more information, see Detecting Anomalies and Identifying Advisories in Your ND to understand how to navigate across the advisories tab.
-
Recent activity
View recent activity for the switch.
-
Switch view
Within the Switch view, you can see a visual representation of the switch ports, where the state could be Up (green) or Down (red). Click All to see the switch view for all modules installed. Nexus Dashboard displays the Port Status Only tab by default. The port diagram key helps you understand the switch view. Click Anomalies Only to display switches with anomalies. The port diagram key helps you understand switch port status information. For more information, see Switch port visualization details.
If the switch has multiple modules installed, you can switch the views between the different modules.
View hardware resources
Click View hardware resources to view a slide-in that appears with information on the hardware resources for this switch in real time. Real-Time Visualization helps view up to date information about the resources. Hardware resources shows the variations in the hardware resources over the time range selected. The hardware resources displayed with the percentage utilized per component are CPU, Fan Utilization, Memory, Power Supply, Storage, and Temperature. Click any resource to view further details about it.
For hardware resources, all parameters are updated in real-time based on the cadence from the switch when it sends the data.
View capacity
Click View capacity to view a slide-in appears with capacity information for the switch. Capacity details shows the variations in operational, configuration, and interface resources over the time range selected.
| Type of Resource | List of resources |
|---|---|
|
Operational Resources |
ACI:
Standalone NX-OS:
|
|
Configuration Resources |
ACI:
Standalone NX-OS:
|
|
Interface Resources |
|
-
General
General provides the following information.
| Field | Description |
|---|---|
|
Fabric name |
The unique identifier of the fabric network to which each switch belongs |
|
Role |
The specific function assigned to the device within the fabric such as spine, leaf, border leaf, or any other defined role |
|
Management IP address |
The IPv4 or IPv6 address used for out-of-band management of the switch |
|
Software version |
The current version of the software on the switch |
|
Uptime |
The total time the switch has been operational since its last reboot |
|
Serial number |
The serial number for this switch |
|
Model |
The model type of the switch hardware |
|
VPC peer(s) |
The peer switches participating in a virtual port channel (VPC) domain, enabling link aggregation across multiple switches. |
|
VPC domain ID |
The identifier for the VPC domain to which the switch belongs |
|
Telemetry collection |
Indicates whether telemetry data collection is enabled or disabled on the device |
-
Interfaces
Interfaces provides the following information:
-
The total number of interfaces in this switch
-
The number of physical interfaces
-
The overall status of the interfaces in the switch (the number of interfaces that are up, down, or physical not in use)
Click on the number above the Total text to get additional information on the interfaces in this switch.
You can filter the list of interfaces based on Anomaly Level, *Admin Status, Operational Status, or Type. Click on a specific interface to get additional information on that particular interface. See Interface details for more information.
-
Connectivity
Connectivity provides the following information:
| Field | Description |
|---|---|
|
Endpoints |
The number of endpoints associated with this switch |
|
L3 Neighbors |
The number of Layer 3 neighbors associated with this switch |
|
Routes |
The number of routes associated with this switch |
Click on the number shown in either of these areas to get additional information on the endpoints or the Layer 3 neighbors.
-
Segmentation and security
Segmentation and security provides the following information:
| Field | Description |
|---|---|
|
VRFs |
The number of VRFs associated with this switch |
|
Security Groups |
The number of security groups associated with this switch |
|
EPGs |
The number of EPGs associated with this switch |
Click on the number shown in either of these areas to get additional information on the endpoints or the Layer 3 neighbors.
-
Analytics Summary
For standalone NX-OS fabrics, Analytics Summary displays the congestion level of the switch.
Switch port visualization details
You can access a color-coded visualization of all of your switch ports with detailed descriptions of the ports and their attributes. Real-time visualization of switch ports can help you to view up-to-date information on your hardware resources. Navigate to Manage > Inventory > and click on a Switch to view the switch port visualization details. For more information, see the View switch port details section.
You can click the All, Port status only, or Anomalies only tabs to customize your switch port visualization to display information on ports and anomalies, only the ports, or only anomalies.
-
All — The fill color of the port is mapped to the port status, while the border color of the port is mapped to the anomaly level
-
Port status only — Colors are mapped to the port status as described in the Port status colors section. This is also the default display option.
-
Anomalies only — Color of the port matches the anomaly level.
Port status colors
When you click the Port status only tab, the physical interfaces of a switch are displayed in these colors.
-
Gray — indicates the port is administratively down and operationally down.
-
Green — indicates the port is administratively up and operationally up.
-
Red — indicates the port is administratively up and operationally down.
When you hover over a port, you can see a tooltip that displays the port name, anomaly level and status, attributes, and CDP/LLDP neighbor information.
For breakout ports, the color displayed on the port is a summary of the breakout ports:
-
If all child breakout ports are green, the parent port is displayed in green.
-
If all child breakout ports are red, the parent port is displayed in red.
-
If some child breakout ports are green and some are red, the parent port is displayed in orange.
If there is a combination of attributes, Nexus Dashboard uses a plus symbol, indicating that there are multiple attributes. When you hover over a port, you can see a tooltip that lists all the attributes of that port. With this release, Nexus Dashboard added attributes for L3Out and Layer 3 ports. Nexus Dashboard considers Layer 2 ports, as opposed to L3Out or Layer 3 port, the default port type and such ports do not show any attributes in the Port Types category.
The Port diagram key area describes these keys to help you understand the switch port visualization.
| Field | Description |
|---|---|
|
Port Status |
Displays the port status color and the administrative state of the ports:
|
|
Anomaly Level |
Displays anomaly levels represented by these colors:
|
|
Port Channels |
Indicates the port channel type:
|
|
Port Connections |
Indicates the port connection types:
|
|
Port Types |
Indicates the port types:
|
|
Port Details |
Indicates breakout ports with a four square icon and multiple attributes with a + symbol. |
Guidelines and limitations for switch port visualization
-
Supported only for physical interfaces.
-
No support for the management port.
-
No support for ACI Fibre Channel (FC) ports.
-
Port attributes do not contain Endpoint Group (EPG) information unlike L3Outs
View switch port details
Follow these steps to view switch port details.
-
Navigate to Inventory for ACI fabrics, Manage > Inventory.
-
Click on a switch.
The Switch Overview page for that switch displays.
-
Navigate to the Switch view area of the page.
The Switch view > Port Status Only tab displays by default. You can click on the All and Anomalies Only tabs to view switch port details.
When you hover over a port, you can see a detailed description about this port.
Connectivity details
Click Connectivity to view connectivity information for this switch. The following appear below Connectivity, with Interfaces shown first by default.
Click any of these to view additional connectivity information for this switch:
-
Interfaces
Click Interfaces to view the Interfaces for this switch. The following information is available in Interfaces:
-
Anomaly level (Only interface down anomaly is in Realtime)
-
Admin Status (Real time visualization)
-
Operational status (Real time visualization)
-
Type
The Interfaces are listed in a tabular form with the following data available:
-
Anomaly level
-
Operational speed
-
Type
-
CDP/LLDP
-
Admin Status
-
Operational Status
There are various other columns that are optional and can be added to the table by clicking on the gear icon using the toggle to show or hide.
See Interface details for more information.
-
L3 Neighbors
Click L3 Neighbors to view L3 Neighbors for this switch. You can filter the results based on Neighbor, Local Switch, routing protocol, VRF, and Operational Status. BGP and OSPF protocols can be viewed in real time. The switch will report the interface logical neighbor event immediately upon modification or change or properties. OSPF support includes OSPF statistics, operational statistics, interface statistics, and neighbor statistics. Click the IP address in the Neighbor column to view details on this neighbor.
-
Endpoints
Click Endpoints to view the Endpoints for this switch. You can filter the results based on Anomaly Level, MAC Address, IP Addresses, Hostname, Connected To, Interface, Time, Status, Tenant, VRF, BD, EPG/l3out, Search Deleted IPs, VM Name, and Hypervisor.
Click a MAC address in the MAC column to get the following additional information on that endpoint:
-
Overview
-
General
-
VM Name
-
Hypervisor
-
MAC Address
-
IP Address
-
Hostname
-
Last Updated
-
Status
-
-
Network Configuration
-
Tenant
-
VRF
-
EPG/L3 Out
-
BD
-
Encap
-
-
Connected To
-
Nodes
-
Interface
-
-
-
Endpoint history - Determine how you want to show endpoint history. The time range for the history is only based on the time selector chosen at the fabric level.
-
Anomalies
You can also click the IP address or the hostname (if clickable) to view additional information about them.
-
Routes (standalone NX-OS)
-
Click Routes to view the route details for this switch.
-
You can choose from the drop-down list to view the details for either IPv4 or IPv6 routes.
-
Click Download to download any route table from the last 7 days.
-
You can filter the table based on route, protocol or VRF.
-
The Routes per VRF graph shows the number of routes per VRF for the top 10 VRFs.
-
The Change Summary helps view the number of the added, modified, and deleted routes. Click Change Summary to list all the routes which have had modified or deleted change made in a tabular form.
-
The Routes table displays information such as route, node name, protocol, VRF, and Next Hop. The Routes table only displays 10,000 route table entries and 10,000 history events. The Routes table always shows the current route table irrespective of the time range selected.
-
Click on any route listed to view General and Route History view along with the timeline for the change. The General page list of all the next hops available for that route. The Route History page shows detail of last 50 route events. The route history events shows deleted or modified events. Route add events are shown under modified routes category.
-
Each Next Hop IP address is subscripted with the node name and interface where it is configured.
-
Click View Details in the routing page banner to list any unsupported nodes, inactive nodes, switch connection, failure and if data is inconsistent for the selected time range.
-
-
vPC Domains
Click vPC Domains to view the vPC Domain for this switch. You can filter the results based on Domain ID.
The table lists the domain ID, the primary switch, the secondary switch and the number of vPCs up and down. Click a domain in the Domain ID column to view vPC domain details on that domain. For standalone NX-OS fabrics, click an interface in the Interface column to view additional information on that interface.
-
Multicast
The Multicast card lists the IGMP, IGMP snooping and the PIM details for the switch. The Instances table shows the following information:
| Protocol Type | Fields for Instances Table |
|---|---|
|
IGMP DETAILS |
|
|
IGMP SNOOPING DETAILS |
ACI:
Standalone NX-OS:
|
|
PIM DOMAINS DETAILS |
ACI:
Standalone NX-OS:
|
-
Multicast Routes
Click Multicast Routes to view the Multicast PIM Groups for this switch. You can filter the information by Source, Multicast Group, Tenant, VRF, Incoming Interface, Outgoing Interface, RPF Neighbor, RPF Source, and Flags.
Guidelines and limitations for standalone NX-OS fabrics
Guidelines and limitations for real-time visualization (RTEV)
-
Controller events are not in real-time and RTEV is limited to switches only.
-
For RTEV, 20 UI sessions are supported.
-
For the real-time connection to be established, you must enable the NX-API feature in Cisco NX-OS fabrics that do not have a controller.
Guidelines and limitations for Layer 3 neighbors
-
When a Layer 3 neighbor changes state, Nexus Dashboard updates the operational state in real-time. However, the timeseries database, which displays data from the last 2 hours, may still show deleted neighbors in the historical table when you choose the Current time view.
-
For BGP neighbors, Nexus Dashboard keeps a deleted neighbor visible on the current view until the 2-hour window expires.
-
For OSPF neighbors, Nexus Dashboard continues to display deleted neighbors until it purges them, which can take up to 7 days, keeping them visible in the current view until then.
-
Guidelines and limitations when viewing hardware resources
All parameters are updated in real-time based on the cadence from the switch when it sends the data.
Guidelines and limitations for routes table
-
Nexus Dashboard 4.1.1 does not support ESG as a protocol filter option in the route table.
-
Routes table is only supported on NX-OS release 10.4(3) and later.
-
You must enable gRPC Network Management Interface (gNMI) transport feature in the switches. To enable gNMI transport you must configure the following:
-
Configure FabricPassword/LanPassword/LeafPassword
-
Enable Feature NX-API
-
-
The routing collector has built in metering to only process the supported scale of route change events and it drops the rest of the route events. For example, on a physical standard deployment, 1 million route updates can be ingested in 3 minutes. Data drop is indicated in the UI using the route banner. When route events are dropped due to metering, it will take some time to re-snapshot and reconcile the route data.
-
For a newly onboarded fabric or switch, it may take some time for the Routes table to be available.
-
The download route table API is only allowed on switch level page. The API returns complete route table if the prefixes in history events processed are less than 50,0000 per switch.
-
When the route database experiences a storm of updates, the metering logic might drop some of these updates resulting in incorrect counts of New, Modified, or Deleted prefixes or routes displayed within a 2 hour window. In this scenario a re-snapshot request to the switch is initiated, which will sync route database with the switch and accurately reflect the total number of routes for a given fabric.
Interface details
The following interface types are supported:
-
Physical Interface: To view the interface details of the switch, such as admin state, operational state, IP address, CDP/LLDP neighbors, and L3 (logical) neighbors. This page also displays protocols, Trends and statistics, QoS, Anomalies, DOM properties, and Multicast.
-
Port Channel Interface: The port channel is an aggregate of physical interfaces. They can be statistically channeled or dynamic using LACP protocols. The statistical data that collects the counters for packets, bytes, and various errors are similar to that of the physical interface. The operational data is obtained by looking at an additional set of objects that gives the admin status, oper status, and list of member interfaces for both PC and vPC.
-
vPC Interface: A virtual port channel (vPC) allows links that are physically connected to two Cisco Nexus 9000 Series devices to appear as a single port channel by a third device. The third device can be a switch, server, or another networking device that supports port channels. A vPC can provide Layer 2 multipathing, which allows you to create redundancy and increase the bisectional bandwidth by enabling multiple parallel paths between nodes and allowing load balancing traffic.
-
SVI Interface: Switch virtual interface (SVI) is a virtual routed interface that connects a VLAN on the device to the Layer 3 router engine on the same device. Specific information such as Member Interfaces over which the SVI is deployed, VLAN ID, and Encap VLAN are displayed for the SVI interface.
-
Management: The management interface is a dedicated network port used to remotely access and configure the switch to manage the switch using protocols like Telnet, SSH, or SNMP. It is typically a dedicated physical port on the switch with its own IP address designated for management purposes.
-
Loopback Interface: A loopback interface is a virtual interface with a single endpoint that is always up. Any packet transmitted over a loopback interface is immediately received by this interface. Loopback interfaces emulate a physical interface. You can use loopback interfaces for performance analysis, testing, and local communications.
-
Sub-interface: Sub-interfaces divide the parent interface into two or more virtual interfaces on which you can assign unique Layer 3 parameters such as IP addresses and dynamic routing protocols. The IP address for each sub-interface should be in a different subnet from any other sub-interface on the parent interface. One use of sub-interfaces is to provide unique Layer 3 interfaces to each virtual local area network (VLAN) supported by the parent interface. In this scenario, the parent interface connects to a Layer 2 trunking port on another device. You configure a sub-interface and associate the sub-interface to a VLAN ID using 802.1Q trunking.
-
Tunnel: Tunnels consist of three main components: passenger, carrier, and transport protocols. The passenger protocol needs to be encapsulated. IPv4 is an example of a passenger protocol. The carrier protocol is used to encapsulate the passenger protocol. Cisco NX-OS supports GRE as a carrier protocol. The transport protocol is used to carry the encapsulated protocol. IPv4 is an example of a transport protocol. An IP tunnel takes a passenger protocol, such as IPv4, and encapsulates that protocol within a carrier protocol, such as GRE. The device then transmits this carrier protocol over a transport protocol, such as IPv4.
-
NVE Interface: A Network Virtualization Edge (NVE) interface is a logical interface used in Cisco Nexus 9000 switches for VXLAN (Virtual Extensible LAN) configuration. It serves as the control point for encapsulating and decapsulating VXLAN traffic. VXLAN is a tunneling protocol used to extend Layer 2 networks over Layer 3, enabling the creation of scalable and flexible virtualized networks in data center environments.
Click an interface to view more details about it.
Overview
The Anomaly level is available at the top. The fields for overview change depending on the type of interface supported.
-
INTERFACE TYPE : PHYSICAL
Section General
-
Interface
-
Type (ACI: Host Port, Fabric Port, L3 Port; standalone NX-OS: Access Port, Trunk Port, L3 Port)
-
Operational Speed (ACI)
-
IP Address
-
Admin Status
-
Operational Status
-
CDP/LLDP neighbors
-
Total Endpoints
-
SFP Diagnostics (You can click on 'View SFP Diagnostics' to view further details)
If LLDP is disabled, the tag will show 'LLDP disabled', otherwise it will show the count. This is applicable for CDP neighbors as well.
EPGs with Active Endpoints (ACI; this is available for Host Ports)
-
Tenant name
-
Endpoints in EPG
-
EPG Name
-
Mapped Domains
-
VLAN
L3 Neighbors (ACI only; this is available for L3 Port with SVI)
In this area, details are displayed such as IP, Operational Status, Routing Protocol, and Type.
VLANs Allowed on Interface (standalone NX-OS; this is available for Access Single Port and Trunk Multiple Ports)
-
VLAN ID
-
VNI
Sub interfaces (standalone NX-OS; this is available for Access Single Port and Trunk Multiple Ports)
-
Sub interface
-
IP Address
Associated Routing Protocols (standalone NX-OS; for L3 Port)
-
Protocol
-
Type
-
-
INTERFACE TYPE : PORT CHANNEL
Section General
-
Interface
-
Description
-
Type (ACI: Host Port, L3 Port; standalone NX-OS: Access Port, Trunk Port, L3 Port, vPC Peer link for vPC Domain)
-
Aggregation Type
-
Bandwidth
-
IP Address
-
Admin Status
-
Operational Status
-
CDP/LLDP neighbors (Real-time visualization for ACI)
-
Total Endpoints
-
SFP Transceiver (ACI: You can click on 'View SFP Diagnostics' to view further details)
-
SFP Diagnostics (standalone NX-OS: You can click on 'View SFP Diagnostics' to view further details)
If LLDP is disabled, the tag will show 'LLDP disabled', otherwise it will show the count. This is applicable for CDP neighbors as well.
LACP Details
-
Interface
-
Admin Status
-
Operational Status
-
LACP Packets received
-
LACP Packets transmitted
-
Errors
EPGs with Active Endpoints (ACI; this is available for Host Ports)
-
Tenant name
-
Endpoints in EPG
-
EPG Name
-
Mapped Domains
-
VLAN
Associated L3 Out (ACI; for L3 Port)
-
L3 Out Name
-
Switch
-
Port
-
Routing protocol
-
External EPGs
VLANs Allowed on Interface (standalone NX-OS; this is available for Access Single Port and Trunk Multiple Ports)
-
VLAN ID
-
VNI
SFP Diagnostics (DOM)
-
Lane
-
Voltage
-
Temperature
-
Current
-
Transmit Power Value
-
Receive Power Value
An interface must be active for you to be able to view the neighbor details.
Configured 'IP Unnumbered' will show as “unassigned” in IP address field.
-
-
INTERFACE TYPE : vPC
vMCT is not supported.
| Section | |
|---|---|
|
General |
If LLDP is disabled, the tag will show 'LLDP disabled', otherwise it will show the count. This is applicable for CDP neighbors as well. |
|
Members |
|
|
EPGs with Active Endpoints (ACI: this is available for Host Ports) |
|
|
VLANs Allowed on Interface (standalone NX-OS: this is available for Access Single Port and Trunk Multiple Ports) |
|
|
SFP Diagnostics (DOM) |
|
-
INTERFACE TYPE : SUB-INTERFACE (standalone NX-OS)
| Section | |
|---|---|
|
General |
If LLDP is disabled, the tag will show 'LLDP disabled', otherwise it will show the count. This is applicable for CDP neighbors as well. |
|
Associated Routing Protocols (For L3 Port) |
|
-
INTERFACE TYPE : NVE (standalone NX-OS)
| Section | |
|---|---|
|
General |
|
|
VNIs |
|
-
INTERFACE TYPE : SVI
Section General
-
Interface
-
Description
-
Type
-
Encap
-
Admin Status
-
Operational Status
-
SFP Transceiver (You can click on 'View SFP Diagnostics' to view further details)
Associated L3 Out (ACI; for L3 Port)
-
L3 Out Name
-
Switch
-
Port
-
Routing protocol
-
External EPGs
L3 Logical Neighbors (ACI; for L3 ports with SVI)
-
IP
-
Operational State
-
Routing Protocol
-
Switch
-
Interface
-
Type
Associated Routing Protocols (standalone NX-OS; this is available only if the routing protocol is configured) (Real Time Visualization)
-
Protocol
-
Type
-
Multicast
Click Multicast to view details for multicast routes on this interface.
| Field | |
|---|---|
|
General |
|
|
Multicast Groups |
|
For any interface, you can choose to view either the IGMP details or the PIM details.
IGMP DETAILS :
-
General Information
-
Fast-leave
-
Allow V3 ASM
-
Report Link-local Groups
-
-
Statistics
-
V2 Leave Received
-
V2 Leave Sent
-
V2 Query Received
-
V2 Query Sent
-
V2 Report Received
-
V2 Report Sent
-
V3 Query Received
-
V3 Query Sent
-
V3 Report Received
-
V3 Report Sent
-
PIM DETAILS :
-
Neighbor Details
-
Neighbor
-
BFD Config
-
Bi-Dir Config
-
-
Statistics
-
Authentication failed
-
Bad Version Packet
-
Checksum Errors
-
Invalid Packet Received
-
Invalid Packet Sent
-
Join No RP
-
Join Wrong RP
-
Packet from Self
-
Packet Length Error
-
Packet on Passive Interface
-
Trends and statistics
Monitor the trends and statistics information on a specific interface on a switch using the Trends and statistics tab. For ACI and NX-OS fabrics, you can view admin and operational status, traffic flowing over the interface, bandwidth, and errors. For standalone NX-OS fabric, view information on the traffic flowing over the interface, the interface usage, and various types of statistics for congestions, Microbursts, and errors. You can also view the statistics and trends for the physical interface LACP on the Trends and statistics page.
-
Logical interfaces such as Loopback, Tunnels, and NVE interfaces are not supported on the Trends and Statistics page, but you can view the Admin and Operation stat trends for these interfaces.
-
Due to switch limitations on the NX-OS fabric, only ACI fabric sub-interfaces are supported on the Trends and Statistics page.
All the trend and statistics data, except Microburst, are rendered in real time. Real Time Visualization helps you to view up-to-date information.
Nexus Dashboard allows you to view and monitor trends and satistics for a specific interface type, see View trends and statistics for an interface type for details. NX-OS switches support the new subscription service and will send notifications to all interested clients for every sample (every 10 seconds). In the event of any issues with the dial-in connection, it will automatically fall back to the regular update cadence, which is at 1-minute intervals.
The dial-in connection will always use the primary Layer 3 IP (IPv4/IPv6) address of the interface.
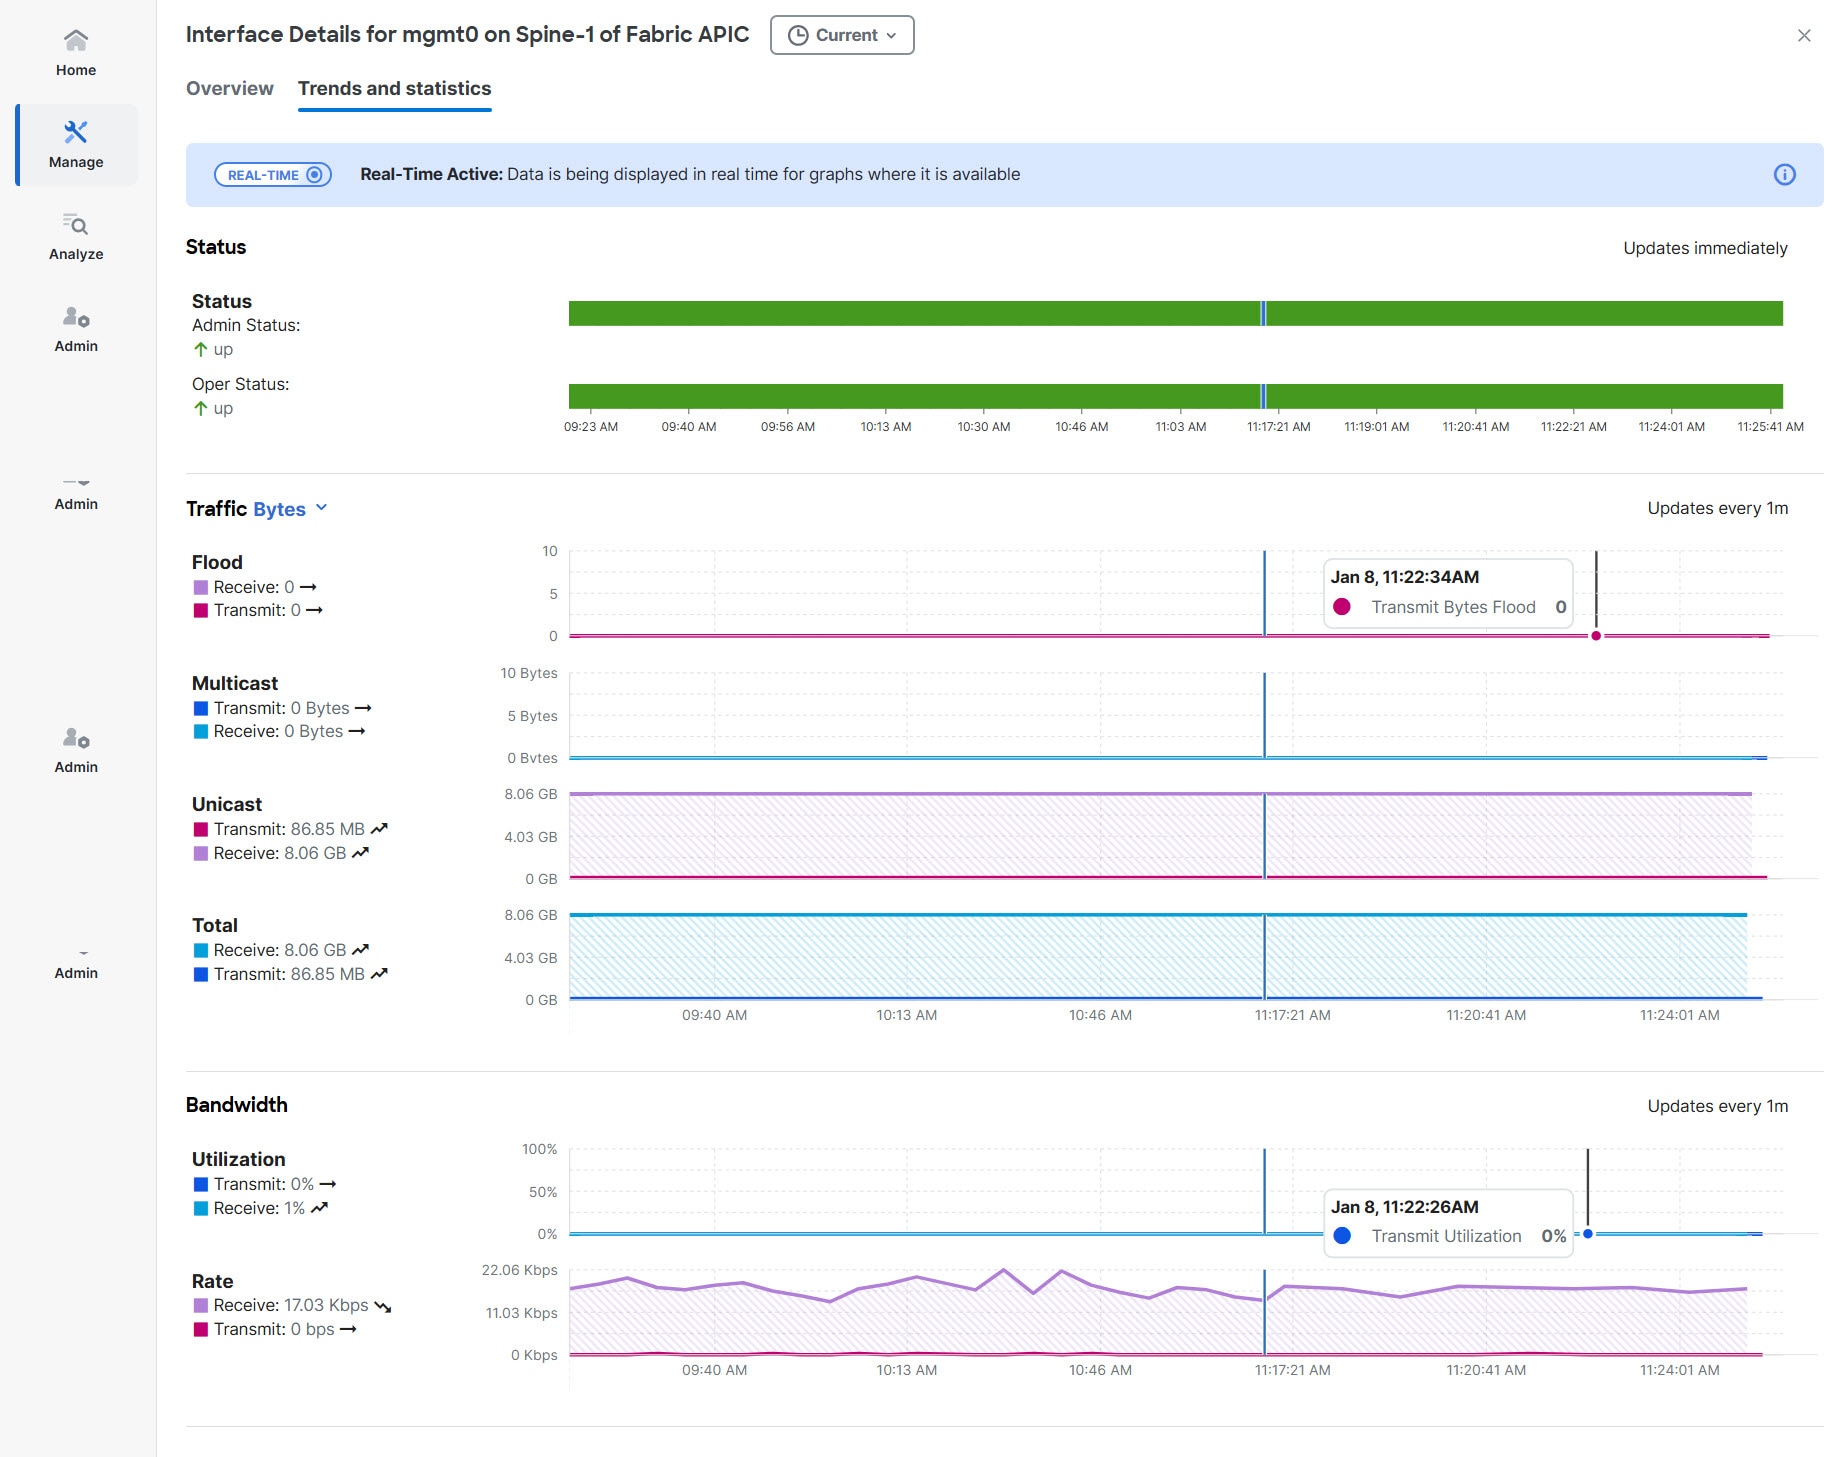
ACI switches do not support gNMI-based subscriptions, so Nexus Dashboard will provide notifications based on a cadence, with statistics updates occurring at 1-minute intervals.
-
Admin Status (Real-time visualization)
-
Operational Status (Real-time visualization)
-
Errors (Real-time visualization for standalone NX-OS)
-
Traffic (by bytes or by packets) (Real-time visualization)
-
Flood
-
Multicast
-
Unicast
-
Total
-
-
Bandwidth (Real-time visualization for standalone NX-OS)
-
Utilization
-
Rate
-
-
Congestion (standalone NX-OS)
-
Congestion score
-
PFC
-
ECN
-
Drops
-
RED/WRED/AFD
-
Errors
-
-
Microbursts (ACI)
The congestion statistics show the ECN and PFC counters for the traffic received and transmitted. This is used to display where the congestion occurs. Click on any of the counter graphs displayed to view the per queue counters. This displays the list of the counters in the queue along with the number of packets in the respective queue.
View trends and statistics for an interface type
Follow these steps to view the trends and statistics for an interface type:
-
Click Switches > Any switch > Connectivity > Interfaces > Type
-
Choose an interface type.
Alternatively, you can use the Filter by feature to view a specific type of interface. For example, use the attribute, "Type == Management" in the Filter-by field to display all management interfaces.
-
Choose an interface listed in the interface table to display the interface details page for this interface.
-
Click the Trends and statistics tab to view real time active data in a graph format.
Use the date picker to change the time scope to view and analyze historical data and trends for this interface.
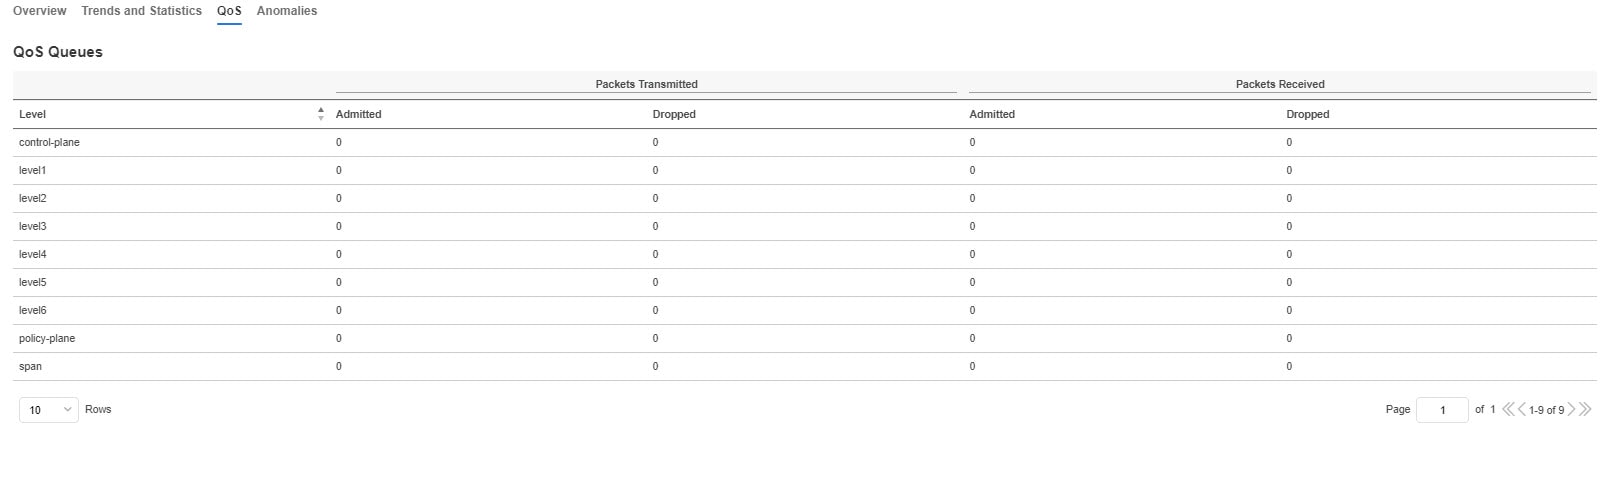
QoS
Quality of Service (QoS) in networking is a process that controls traffic to adjust the overall network traffic based on the requirements of specific applications.
Anomalies
Click to view anomaly information on this specific interface in this switch. See Anomalies for more information.
The Anomaly level shows the total number of anomalies that have occurred and the number of anomalies that have occurred in the last week.
Hover over the Anomaly Level to view the category of the anomalies occurred. Click the Anomaly Level to get specific information on the anomalies present for the specific controller or switch.
The View all anomalies takes you to the Anomalies tab. See Anomalies to understand how to navigate across the anomalies.
Microbursts
Microbursts
Click Switches > Any switch > Connectivity > Interfaces > Any interface > Trends and Statistics to view Microbursts in Inventory.
A burst of traffic impacts the output buffer of a physical interface port given the channel is already subscribed with line-rate flows. These bursts are often hard to detect with just given queuing parameters, such as buffer cells used and buffer cells unused as there is a high variance of usage of these buffers.
The Cisco Nexus 9000 series switches provide a capability of detecting this by issuing an interrupt that is triggered when a queue occupancy rises above x bytes and falls below y bytes. You can configure up to 8 output queues per physical interface port.
To configure Microburst in Nexus Dashboard, navigate to Admin > System Settings > Microburst.
See the Microburst section in Getting Started to view more details.
You can view the microbursts details such as Queue, Start Time, Number of Bursts, Max Duration, Avg. Duration, Max Peak, and Avg Peak in the Microbursts section. A chart view and a tabular view is available.
Microburst Anomaly
Anomalies are raised in Nexus Dashboard based on the number of microbursts at the interface level. Microburst anomaly jobs run every 5 minutes in a container environment, which checks for microburst records in microburst database. If the number of microbursts per interface is greater than microburst count threshold at any given point of time, then a minor anomaly is raised per interface in a node.
Nexus Dashboard raises these anomalies:
-
The flows that are displayed in the summary table are gathered from Flow Telemetry data for a corresponding egress interface. Nexus Dashboard matches the egress interface and egress queue to gather the corresponding microburst.
-
Based on the percentage of threshold, microburst is either low, high, or medium. The percentage of threshold is inverse to sensitivity. When the number of microbursts are greater than 100 on a particular interface, an anomaly is raised.
-
If flow telemetry is enabled and microburst is also enabled, then Nexus Dashboard displays the estimated impact of flows for a particular microburst anomaly.
-
If the flow telemetry is disabled and microburst anomaly is enabled, then Nexus Dashboard displays no Estimated Impact for that anomaly.
-
Flows that are contributing or impacted by microburst.
Filtering information
In some cases, you might be able to filter results to find information more easily.
For example, you might have a situation where there a large number of endpoints under a single leaf switch, but you are only interested in endpoints that have a certain VLAN value.
You could filter the information to show only those specific endpoints in this situation.
Use the following operators for the filter refinement:
| Operator | Description |
|---|---|
|
== |
With the initial filter type, this operator, and a subsequent value, returns an exact match. |
|
!= |
With the initial filter type, this operator, and a subsequent value, returns all that do not have the same value. |
|
contains |
With the initial filter type, this operator, and a subsequent value, returns all that contain the value. |
|
!contains |
With the initial filter type, this operator, and a subsequent value, returns all that do not contain the value. |
|
< |
With the initial filter type, this operator, and a subsequent value, returns a match less than the value. |
|
< = |
With the initial filter type, this operator, and a subsequent value, returns a match less than or equal to the value. |
|
> |
With the initial filter type, this operator, and a subsequent value, returns a match greater than the value. |
|
> = |
With the initial filter type, this operator, and a subsequent value, returns a match greater than or equal to the value. |
vPC Pairs
To navigate to vPC Pairs for an ACI fabric:
-
Click vPC Pairs.
vPC Pairs provides the following high-level information on the vPC pairs. The gear icon allows you to customize the table by hiding some of the columns. By default, all columns are visible. The table can also be filtered based on the columns available.
| Field | Description |
|---|---|
|
Peer One Name |
The name of the first peer in a vPC pair |
|
Peer One ID |
The ID of the first peer in a vPC pair |
|
Peer One Role |
The role of the first peer in a vPC pair |
|
Peer Two Name |
The name of the second peer in a vPC pair |
|
Peer Two ID |
The ID of the second peer in a vPC pair |
|
Peer Two Role |
The role of the second peer in a vPC pair |
|
Intended Peer Name |
The intended peer name for the vPC pair |
|
vPC Domain ID |
The vPC domain ID for the vPC pair |