
New and changed information
The following table provides an overview of the significant changes up to this current release. The table does not provide an exhaustive list of all changes or of the new features up to this release.
| Release Version | Feature | Description |
|---|---|---|
|
Nexus Dashboard 4.1.1 |
Improved navigation and workflow when configuring connectivity for Nexus Dashboard ACI fabrics |
Beginning with Nexus Dashboard 4.1.1, the navigation and workflow when configuring connectivity for Nexus Dashboard ACI fabrics have been enhanced. |
Connectivity details
To view the connectivity information for an ACI fabric, follow these steps.
-
Navigate to the fabric where you want to view the connectivity information.
-
Navigate to the main Fabrics page:
Manage > Fabrics
-
Single-click on the fabric where you want to view the connectivity information.
The Overview page for that fabric appears.
-
Click Connectivity to view the connectivity information.
These subtabs appear below Connectivity, with Interfaces shown first by default. Choose the appropriate subtab within Connectivity to view more specific connectivity information for the ACI fabric.
Interfaces
Click Interfaces to view the interfaces for this switch. This information is available in Interfaces.
-
Anomaly level (Only interface down anomaly is in realtime)
-
Admin Status (Real time visualization)
-
Operational status (Real time visualization)
-
Type
The interfaces are listed in a table with this data available.
-
Interface
-
Switch
-
Anomaly level
-
Operational speed
-
Type
-
CDP/LLDP Neighbors
-
Admin Status
-
Operational Status
There are various other columns that are optional and can be added to the table by clicking on the gear icon using the toggle to show or hide.
See Interface details for more information.
L3 Neighbors
Click L3 Neighbors to view L3 neighbors for this switch. You can filter the results based on Neighbor, Local Switch, routing protocol, VRF, and Operational Status. You can also view BGP, OSPF, and OSPFv3 protocols in real time. The switch will report the interface logical neighbor event immediately upon modification or change of the properties. OSPF and OSPFv3 support includes neighbor status interface and other operational information related to the protocol. Click the IP address in the Neighbor column to view details on this neighbor.
Endpoints
Click Endpoints to view the endpoints for this switch. You can filter the results based on Anomaly Level, MAC Address, IP Addresses, Hostname, Connected To, Interface, Time, Status, Tenant, VRF, BD, EPG/l3out, Search Deleted IPs, VM Name, and Hypervisor.

The Endpoints page filters out MAC addresses that are connected to APIC devices, so you will see a mismatch between the information displayed in the operational resource table and the information displayed in the Endpoints page.
Click a MAC address in the MAC column to get the following additional information on that endpoint:
-
Overview
-
General
-
VM Name
-
Hypervisor
-
MAC Address
-
IP Address
-
Hostname
-
Last Updated
-
Status
-
-
Network Configuration
-
Tenant
-
VRF
-
EPG/L3 Out
-
BD
-
Encap
-
-
Connected To
-
Nodes
-
Interface
If DNS integration is not configured, Hostname information will not display in the Endpoint table or Details page .
-
-
-
Endpoint history - Determine how you want to show endpoint history. The time range for the history is only based on the time selector chosen at the fabric level.
-
Anomalies
You can also click the IP address or the hostname (if clickable) to view additional information about them.
Flows
Flows provides deep insights at a flow level giving details such as average latency and packet drop indicator. It also raises anomalies when the latency of the flows increase or when packets get dropped because of congestion or forwarding errors.
Each flow has a packet counter representing the number of packets entering the ASIC for that flow over a period of time. This period of time is called aggregation interval. There are several points where flow statistics for a given flow can be aggregated. Aggregation can happen in the ASIC, switch software, and server software.
The Flows section of Nexus Dashboard displays the telemetry information collected from various devices in the fabric that were added to the fabric.
For details on Flow Telemetry support for Cisco Nexus series switches and line cards, see the "Compatibility Information" section in the Nexus Dashboard Release Notes.
Flows hardware requirements
For details on Flow Telemetry support for Cisco Nexus platform switches, see the "Compatibility Information" section in the Nexus Dashboard Release Notes.
Flows guidelines and limitations for Cisco ACI fabrics
-
Nexus Dashboard captures the maximum anomaly score for a particular flow, for the entire cycle of the user specified time range.
-
For unknown IP addresses, the traffic from spine nodes will be dropped and flow records are not generated in Flow Telemetry.
-
The packet count represents the number of packets entering the fabric for a particular flow that does not match the source and destination IP address.
-
A maximum of 63 VRF instances are supported on flow telemetry nodes.
-
A Maximum of 1000 subnet rules can be programmed. Each IPv6 subnet will occupy 8 entries, and each IPv4 subnet will occupy 2 entries in the hardware. You can calculate the total usage using the following formula:
Total usage = IPv6 subnets x 8 + IPv4 subnets x 2
-
Flows is not supported for endpoint security groups.
-
Bridge domain subnet needs to be programmed for bridged flows to get reported from spine switch.
-
For flows, if the time range you have selected is greater than 6 hours, the data may not get displayed. Select a time range that is less than or equal to 6 hours.
-
When the scale limit for anomalies is reached, some of the unhealthy flows may not be displayed as anomalies in the Flow Record Details page.
A system issue is raised when this condition happens. Navigate to Admin > System Settings > System Issues to view the system issue.
-
Multicast is not supported for Flow Telemetry.
-
When traffic flows through sub-interfaces, in the Flow Record Details page, sub-interface is displayed only in the ingress direction in the Flow Path area. In the egress direction the parent interface is displayed.
-
On the Cisco Nexus 9332D-GX2B, 9348D-GX2A, 9364D-GX2A, 9332D-H2R, and 93400LD-H1 switches, you can enable flow on up to 31 interfaces. On all other switches other than first generation Cisco Nexus 9000 switches and the Cisco N9K-C93180YC-EX, N9K-C93108TC-EX, N9K-C93180LC-EX, and N9K-X9732C-EX line cards, you can enable flow on up to 63 interfaces. A first generation switch has a product ID that does not have a suffix and does not have the -X suffix.
Limitations for flows on Cisco Nexus EX switches in Cisco ACI fabrics
For details on Flow Telemetry hardware support, see the "Compatibility Information" section in the Nexus Dashboard Release Notes.
-
Output port information for outgoing traffic from N9K-C93180YC-EX, N9K-C93108TC-EX, N9K-C93180LC-EX, and N9K-X9732C-EX line cards will not be displayed.
-
The burst information for N9K-C93180YC-EX, N9K-C93108TC-EX, N9K-C93180LC-EX, and N9K-X9732C-EX line cards will not be displayed.
-
The EPG names will reflect after few minutes of flow capture and after enabling Flows. This information is fetched from the software and not from the EX ASIC.
-
For L3Out external EPGs; EPG names, buffer drop anomaly, forwarding drop anomaly, and QoS policing drop anomaly are not supported.
-
Cisco Nexus 9300-EX platform switches do not support VRF instance-based filtering. They support only bridge domain or subnet filtering of flow telemetry rules. Nexus Dashboard gets the flows from the subnet if the subnet is across multiple VRF instances.
-
Tier-1 leaf switches do not export flow telemetry data from remote leaf switches to sub-leaf switches.
-
Interface-level flow telemetry is not supported.
Limitations for flows on Cisco Nexus FX and GA switches in Cisco ACI fabrics
-
The spine switches do not export shared service flow records (VRFA to VRFB and vice-versa). Due to this limitation Nexus Dashboard flow path summary will be incomplete.
-
Nexus Dashboard supports all IP sizes, but shows it different from actual IP size. For example, for 1000 bytes of IP packet size:
-
For IPv4 inter-leaf node traffic (with spine node), Nexus Dashboard shows Ingress IP size of 1050 bytes and Egress IP size of 1108 bytes. For IPv4 intra-leaf traffic Nexus Dashboard shows both Ingress and Egress IP size of 1050 bytes.
-
For IPv6 inter-leaf node traffic (with spine node), Nexus Dashboard shows Ingress IP size of 1070 bytes and Egress IP size of 1128 bytes. For IPv4 intra-leaf traffic Nexus Dashboard shows both Ingress and Egress IP size of 1070 bytes.
-
-
Flow telemetry and flow telemetry events will not export
drop bitif there is an egress ACL drop in the switch. -
Locally switched traffic in the same node, with shared services will not have information on the destination VRF or Tenant and EPG.
-
This is valid for both EPGs and ExtEPGs.
-
Shared services also encompasses the case of EPGs in the same VRF but different tenants.
-
-
If the external EPG matches a 0.0.0.0/0 subnet, the Nexus Dashboard Insights Flow Telemetry will not recognize the external EPG name for the flow. You must expose a more specific subnet match in the external EPG for the flow telemetry to recognize the name.
Extending flows to Cisco ACI tier-3 topologies in Nexus Dashboard
Flows implements 3-tier topology where a second tier of leaf nodes are connected to first tier of leaf nodes. In the 3-tier topology when flow packet traverses from one host to the other using multiple tiers, before they reach the destination host, the packet becomes an iVXLAN packet when it traverses through a tier-1 leaf node.
Guidelines and limitations
-
The Cisco APIC Release 4.2(4o) does not support a leaf node exporting flow telemetry in case of iVXLAN packet, resulting in an incomplete flow path and inadequate information to stitch together all the flows.
View flows
The Flows page displays telemetry information collected from various devices in an online fabric. The Flows records let the user visualize the flows per fabric. For a particular fabric, you can view flows by Anomaly Score, Packet Drop Indicator, and Average Latency.
The flows engine also runs machine-learning algorithms on the behavior of the flows to raise anomalies in the behavior, such as average latency and packet drop indicator. The graph represents the anomalies in the behavior over a period of time.
Flow telemetry and analytics gives in-depth visibility of the data plane. Flows collects the flow records streamed from the nodes and converts to understandable EPG-based flow records. Top nodes by flow anomalies displays the nodes in the network with the most anomalies.
To view flow details, you must first enable flows.
-
Click Manage > Fabrics, then click on the appropriate fabric.
-
Click Actions > Edit Fabric Settings.
-
Under General, verify that the Telemetry option is enabled in the Enabled features area.
-
Under Telemetry, verify that the Flow telemetry option is enabled in the Mode area.
To view flows:
-
Navigate to Connectivity > Flows.
-
Select a time range.
-
In the Fabric Flows by area select an option from the drop-down list to view flows by Anomaly Score, Packet Drop Indicator, and Average Latency. The graph displays a time series plot for flows properties recorded in the entire fabric. The flows recorded for Top Sources and Top Destinations are also displayed.
-
The Flows table displays information such as anomaly score, flow record time, nodes, flow type, protocol, latency, packet drop indicator.
-
Use the search bar to filter the flows. The Flows table displays the filtered flows. Click the column heading to sort the flows in the table.
-
Click Record Time to view the flow record details. The details include record time, flow type, aggregated flow information, ingress and egress information, flow path, anomalies, and trends for average latency, traffic, packet drop indicator, bursts.
Layer 4 to Layer 7 services traffic path visibility
You have expanded visibility in the Flow Path to Layer 4 to Layer 7 services external devices such as firewalls. Nexus Dashboard tracks the end-to-end flow across the service chain in real-time and helps locate data plane issues across the device silos. A non-NAT environment across all third-party vendors is supported.
For Layer 4 to Layer 7 services traffic path visibility, your flow telemetry must be enabled and the appropriate rules must be configured.
-
Click Manage > Fabrics, then click on your fabric.
-
Click Actions > Edit Fabric Settings.
-
Under General, verify that the Telemetry option is enabled in the Enabled features area.
-
Under Telemetry > Flow Collection, verify that the Flow telemetry option is enabled in the Mode area.
Based on your rules, if the flow is passing through Policy Based Redirects (for example, a firewall), it will display that information in the flow path.
View Layer 4 to Layer 7 services traffic path visibility
Follow these steps to view Layer 4 to Layer 7 services traffic path visibility.
-
Navigate to Manage > Fabrics.
-
Select Online Fabrics from the drop-down list.
-
Click a fabric name to view the fabric details.
-
Navigate to Connectivity > Flows.
-
Select a time range.
-
In the flows table, click Record Time to view the flow record details.
In the Path area, a graphical flow path will display the end-to-end information, from source to destination, and it will also identify the firewall in the path if a firewall is present. The graph also captures the end-to-end flow path network latency that is occurring. In the graph, if there are any anomalies, a red dot is displayed next to the symbol for the leaf switch or the spine switch.
-
Click Anomalies in the Flow Details page to view further details related to the anomaly.
In the current release firewalls are not supported for anomalies.
Guidelines and limitations for Layer 4 to Layer 7 services traffic path visibility
These guidelines and limitations are for Layer 4 to Layer 7 services traffic path visibility.
-
This feature is currently recommended only if policy-based redirect can be configured using the service graph for a Cisco ACI fabric or Layer 4 to Layer 7 services for an NX-OS fabric.
-
In the current release, firewalls are not supported for anomalies.
-
In the current release, the latency information that is being displayed is the network latency, and it does not capture the latency that is occurring in the firewall.
-
In the current release, NAT is not supported.
-
This feature is currently supported if you use these switches:
-
Cisco Nexus 9300-FX Platform Switches
-
Cisco Nexus 9300-FX2 Platform Switches
-
Cisco Nexus 9300-FX3 Platform Switches
-
Cisco Nexus 9300-GX Platform Switches
-
-
Policy-based redirect destinations on L3Out are not supported because such configurations use an internal VRF because of which only a partial flow path would be available.
-
In a Cisco ACI fabric, when the Layer 4 to Layer 7 services traffic is forwarding in Layer 2 (bridged mode), the flow analytics support is limited. Ingress and egress nodes detection is not accurate, and path summary is not available.
-
The service node displays as unknown for Layer 4 to Layer 7 traffic path visibility.
-
Without a service graph for Layer 4 to Layer 7 services, if the client > service node is VRF_A and the service node > server is VRF_B, the paths will be recorded as separate flows as there is no common or single contract to stitch the flows.
-
Load balancers are not supported.
Flow telemetry events
Flow telemetry events are enabled implicitly when flow telemetry is enabled, and on NX-OS fabrics flow rules are configured. The flow telemetry enables triggering events when a configured rule is met, where packets are exported to the collector for analysis.
Flow telemetry events enhance and complement current flows in Nexus Dashboard. They enrich anomaly generation for flow telemetry and flow telemetry events.
It monitors security, performance, and troubleshooting. This is achieved using the periodic flow table event records exported every second.
The data export to Nexus Dashboard is done directly from the hardware without control plane needing to handle the data. Statistics are assembled as a packet with a configurable MTU size and a defined header. These packets are sent as in-band traffic from the fabric. Headers are configured by software, and packets streamed are UDP packets.
When flow telemetry is available for a triggered flow telemetry event, then you can navigate to flow details page for aggregated information. These events are based on the following drop events:
-
Cisco ACL Drop—In an NX-OS fabric, when packet hits
sup-tcamrules and the rule is to drop the packet, the dropped packet is counted as ACL_Drop and it will increment the forward drop counter. When this occurred, it usually means the packet is about to be forwarded against basic Cisco ACI forwarding principals. Thesup-tcamrules are mainly to handle some exceptions or some of control plane traffic and not intended to be checked or monitored by users. -
Buffer Drop—When the switch receives a frame and there are no buffer credits available for either ingress or egress interface, the frame is dropped with buffer. This typically hints at a congestion in the network. The link that is showing the fault could be full or the link containing the destination may be congested. In this case a buffer drop is reported in flow telemetry events.
-
Forward Drop—The packets that are dropped on the LookUp block (LU) of the Cisco ASIC. In a LU block a packet forwarding decision is made based on the packet header information. If the packet is dropped, forward drop is counted. There may be a variety of reasons when forward drop is counted.
-
RTO Inside—In a Cisco ACI fabric, when a TCP retransmission happens for a flow due to a drop inside the fabric, an RTO inside anomaly is raised. This anomaly is aggregated across flows based on ingress node.
-
RTO Outside—In a Cisco ACI fabric, when a flow experiences TCP retransmission, but there is no drop inside the fabric for that flow, then an RTO outside anomaly is raised. This anomaly is aggregated across flows based on ingress node.
Flow telemetry events compared to flow telemetry
-
The flow telemetry event packets are exported only when configured events occur, whereas flow telemetry packets are streamed continuously.
-
The flow telemetry events are captured for all traffic, where as flow telemetry is captured for filtered traffic.
-
The total number of collectors between flow telemetry and flow telemetry events is 256.
Guidelines and limitations for flow telemetry events
-
In a standalone NX-OS fabric, flow telemetry event anomalies are aggregated. For example, a packet drop anomaly occurred from time T0 to T1. No packet drop anomaly occurred from time T1 to T2. Another packet drop anomaly occurred from time T2 to T3. Although there is no anomaly from T1 to T2, the time stamp for the aggregated packet drop anomalies is from T0 to T3.
-
The flow telemetry events do not report policing drop anomalies in Nexus Dashboard, when the egress data plane policer is configured on front-panel ports and there is traffic drop.
-
To export flow telemetry events on FX platform switches, you must configure flow telemetry filters. In a Cisco ACI fabric, starting with Cisco ACI-Mode Switch release 16.0(3), FX switches export flow telemetry events to indicate only buffer drops experienced by flows without the need to configure flow telemetry filters.
-
Standalone NX-OS fabrics do not support TCP packet RTO anomalies.
Inter-Fabric
Click Inter-Fabric to view inter-fabric connections in this ACI fabric.
The Inter-Fabric page provides information about the inter-fabric connections for this ACI fabric.
| Field | Description |
|---|---|
|
Status |
Provides one of these states as the status of the inter-fabric connections.
|
|
Physical Links |
Shows how many physical links in the inter-fabric connections are up or down. |
|
Overlay BGP Peers |
Shows how many overlay BGP peers in the inter-fabric connections are up or down. |
|
Overlay tunnels |
Shows how many overlay tunnels in the inter-fabric connections are up or down. |
|
Fabric Type |
Shows the fabric types used in the inter-fabric connections. |
Interface details
The following interface types are supported:
-
Physical Interface: To view the interface details of the switch, such as admin state, operational state, IP address, CDP/LLDP neighbors, and L3 (logical) neighbors. This page also displays protocols, Trends and statistics, QoS, Anomalies, DOM properties, and Multicast.
-
Port Channel Interface: The port channel is an aggregate of physical interfaces. They can be statistically channeled or dynamic using LACP protocols. The statistical data that collects the counters for packets, bytes, and various errors are similar to that of the physical interface. The operational data is obtained by looking at an additional set of objects that gives the admin status, oper status, and list of member interfaces for both PC and vPC.
-
vPC Interface: A virtual port channel (vPC) allows links that are physically connected to two Cisco Nexus 9000 Series devices to appear as a single port channel by a third device. The third device can be a switch, server, or another networking device that supports port channels. A vPC can provide Layer 2 multipathing, which allows you to create redundancy and increase the bisectional bandwidth by enabling multiple parallel paths between nodes and allowing load balancing traffic.
-
SVI Interface: Switch virtual interface (SVI) is a virtual routed interface that connects a VLAN on the device to the Layer 3 router engine on the same device. Specific information such as Member Interfaces over which the SVI is deployed, VLAN ID, and Encap VLAN are displayed for the SVI interface.
-
Management: The management interface is a dedicated network port used to remotely access and configure the switch to manage the switch using protocols like Telnet, SSH, or SNMP. It is typically a dedicated physical port on the switch with its own IP address designated for management purposes.
-
Loopback Interface: A loopback interface is a virtual interface with a single endpoint that is always up. Any packet transmitted over a loopback interface is immediately received by this interface. Loopback interfaces emulate a physical interface. You can use loopback interfaces for performance analysis, testing, and local communications.
-
Sub-interface: Sub-interfaces divide the parent interface into two or more virtual interfaces on which you can assign unique Layer 3 parameters such as IP addresses and dynamic routing protocols. The IP address for each sub-interface should be in a different subnet from any other sub-interface on the parent interface. One use of sub-interfaces is to provide unique Layer 3 interfaces to each virtual local area network (VLAN) supported by the parent interface. In this scenario, the parent interface connects to a Layer 2 trunking port on another device. You configure a sub-interface and associate the sub-interface to a VLAN ID using 802.1Q trunking.
-
Tunnel: Tunnels consist of three main components: passenger, carrier, and transport protocols. The passenger protocol needs to be encapsulated. IPv4 is an example of a passenger protocol. The carrier protocol is used to encapsulate the passenger protocol. Cisco NX-OS supports GRE as a carrier protocol. The transport protocol is used to carry the encapsulated protocol. IPv4 is an example of a transport protocol. An IP tunnel takes a passenger protocol, such as IPv4, and encapsulates that protocol within a carrier protocol, such as GRE. The device then transmits this carrier protocol over a transport protocol, such as IPv4.
-
NVE Interface: A Network Virtualization Edge (NVE) interface is a logical interface used in Cisco Nexus 9000 switches for VXLAN (Virtual Extensible LAN) configuration. It serves as the control point for encapsulating and decapsulating VXLAN traffic. VXLAN is a tunneling protocol used to extend Layer 2 networks over Layer 3, enabling the creation of scalable and flexible virtualized networks in data center environments.
Click an interface to view more details about it.
Overview
The Anomaly level is available at the top. The fields for overview change depending on the type of interface supported.
-
INTERFACE TYPE : PHYSICAL
Section General
-
Interface
-
Type (ACI: Host Port, Fabric Port, L3 Port; standalone NX-OS: Access Port, Trunk Port, L3 Port)
-
Operational Speed (ACI)
-
IP Address
-
Admin Status
-
Operational Status
-
CDP/LLDP neighbors
-
Total Endpoints
-
SFP Diagnostics (You can click on 'View SFP Diagnostics' to view further details)
If LLDP is disabled, the tag will show 'LLDP disabled', otherwise it will show the count. This is applicable for CDP neighbors as well.
EPGs with Active Endpoints (ACI; this is available for Host Ports)
-
Tenant name
-
Endpoints in EPG
-
EPG Name
-
Mapped Domains
-
VLAN
L3 Neighbors (ACI only; this is available for L3 Port with SVI)
In this area, details are displayed such as IP, Operational Status, Routing Protocol, and Type.
VLANs Allowed on Interface (standalone NX-OS; this is available for Access Single Port and Trunk Multiple Ports)
-
VLAN ID
-
VNI
Sub interfaces (standalone NX-OS; this is available for Access Single Port and Trunk Multiple Ports)
-
Sub interface
-
IP Address
Associated Routing Protocols (standalone NX-OS; for L3 Port)
-
Protocol
-
Type
-
-
INTERFACE TYPE : PORT CHANNEL
Section General
-
Interface
-
Description
-
Type (ACI: Host Port, L3 Port; standalone NX-OS: Access Port, Trunk Port, L3 Port, vPC Peer link for vPC Domain)
-
Aggregation Type
-
Bandwidth
-
IP Address
-
Admin Status
-
Operational Status
-
CDP/LLDP neighbors (Real-time visualization for ACI)
-
Total Endpoints
-
SFP Transceiver (ACI: You can click on 'View SFP Diagnostics' to view further details)
-
SFP Diagnostics (standalone NX-OS: You can click on 'View SFP Diagnostics' to view further details)
If LLDP is disabled, the tag will show 'LLDP disabled', otherwise it will show the count. This is applicable for CDP neighbors as well.
LACP Details
-
Interface
-
Admin Status
-
Operational Status
-
LACP Packets received
-
LACP Packets transmitted
-
Errors
EPGs with Active Endpoints (ACI; this is available for Host Ports)
-
Tenant name
-
Endpoints in EPG
-
EPG Name
-
Mapped Domains
-
VLAN
Associated L3 Out (ACI; for L3 Port)
-
L3 Out Name
-
Switch
-
Port
-
Routing protocol
-
External EPGs
VLANs Allowed on Interface (standalone NX-OS; this is available for Access Single Port and Trunk Multiple Ports)
-
VLAN ID
-
VNI
SFP Diagnostics (DOM)
-
Lane
-
Voltage
-
Temperature
-
Current
-
Transmit Power Value
-
Receive Power Value
An interface must be active for you to be able to view the neighbor details.
Configured 'IP Unnumbered' will show as “unassigned” in IP address field.
-
-
INTERFACE TYPE : vPC
vMCT is not supported.
| Section | |
|---|---|
|
General |
If LLDP is disabled, the tag will show 'LLDP disabled', otherwise it will show the count. This is applicable for CDP neighbors as well. |
|
Members |
|
|
EPGs with Active Endpoints (ACI: this is available for Host Ports) |
|
|
VLANs Allowed on Interface (standalone NX-OS: this is available for Access Single Port and Trunk Multiple Ports) |
|
|
SFP Diagnostics (DOM) |
|
-
INTERFACE TYPE : SUB-INTERFACE (standalone NX-OS)
| Section | |
|---|---|
|
General |
If LLDP is disabled, the tag will show 'LLDP disabled', otherwise it will show the count. This is applicable for CDP neighbors as well. |
|
Associated Routing Protocols (For L3 Port) |
|
-
INTERFACE TYPE : NVE (standalone NX-OS)
| Section | |
|---|---|
|
General |
|
|
VNIs |
|
-
INTERFACE TYPE : SVI
Section General
-
Interface
-
Description
-
Type
-
Encap
-
Admin Status
-
Operational Status
-
SFP Transceiver (You can click on 'View SFP Diagnostics' to view further details)
Associated L3 Out (ACI; for L3 Port)
-
L3 Out Name
-
Switch
-
Port
-
Routing protocol
-
External EPGs
L3 Logical Neighbors (ACI; for L3 ports with SVI)
-
IP
-
Operational State
-
Routing Protocol
-
Switch
-
Interface
-
Type
Associated Routing Protocols (standalone NX-OS; this is available only if the routing protocol is configured) (Real Time Visualization)
-
Protocol
-
Type
-
Multicast
Click Multicast to view details for multicast routes on this interface.
| Field | |
|---|---|
|
General |
|
|
Multicast Groups |
|
For any interface, you can choose to view either the IGMP details or the PIM details.
IGMP DETAILS :
-
General Information
-
Fast-leave
-
Allow V3 ASM
-
Report Link-local Groups
-
-
Statistics
-
V2 Leave Received
-
V2 Leave Sent
-
V2 Query Received
-
V2 Query Sent
-
V2 Report Received
-
V2 Report Sent
-
V3 Query Received
-
V3 Query Sent
-
V3 Report Received
-
V3 Report Sent
-
PIM DETAILS :
-
Neighbor Details
-
Neighbor
-
BFD Config
-
Bi-Dir Config
-
-
Statistics
-
Authentication failed
-
Bad Version Packet
-
Checksum Errors
-
Invalid Packet Received
-
Invalid Packet Sent
-
Join No RP
-
Join Wrong RP
-
Packet from Self
-
Packet Length Error
-
Packet on Passive Interface
-
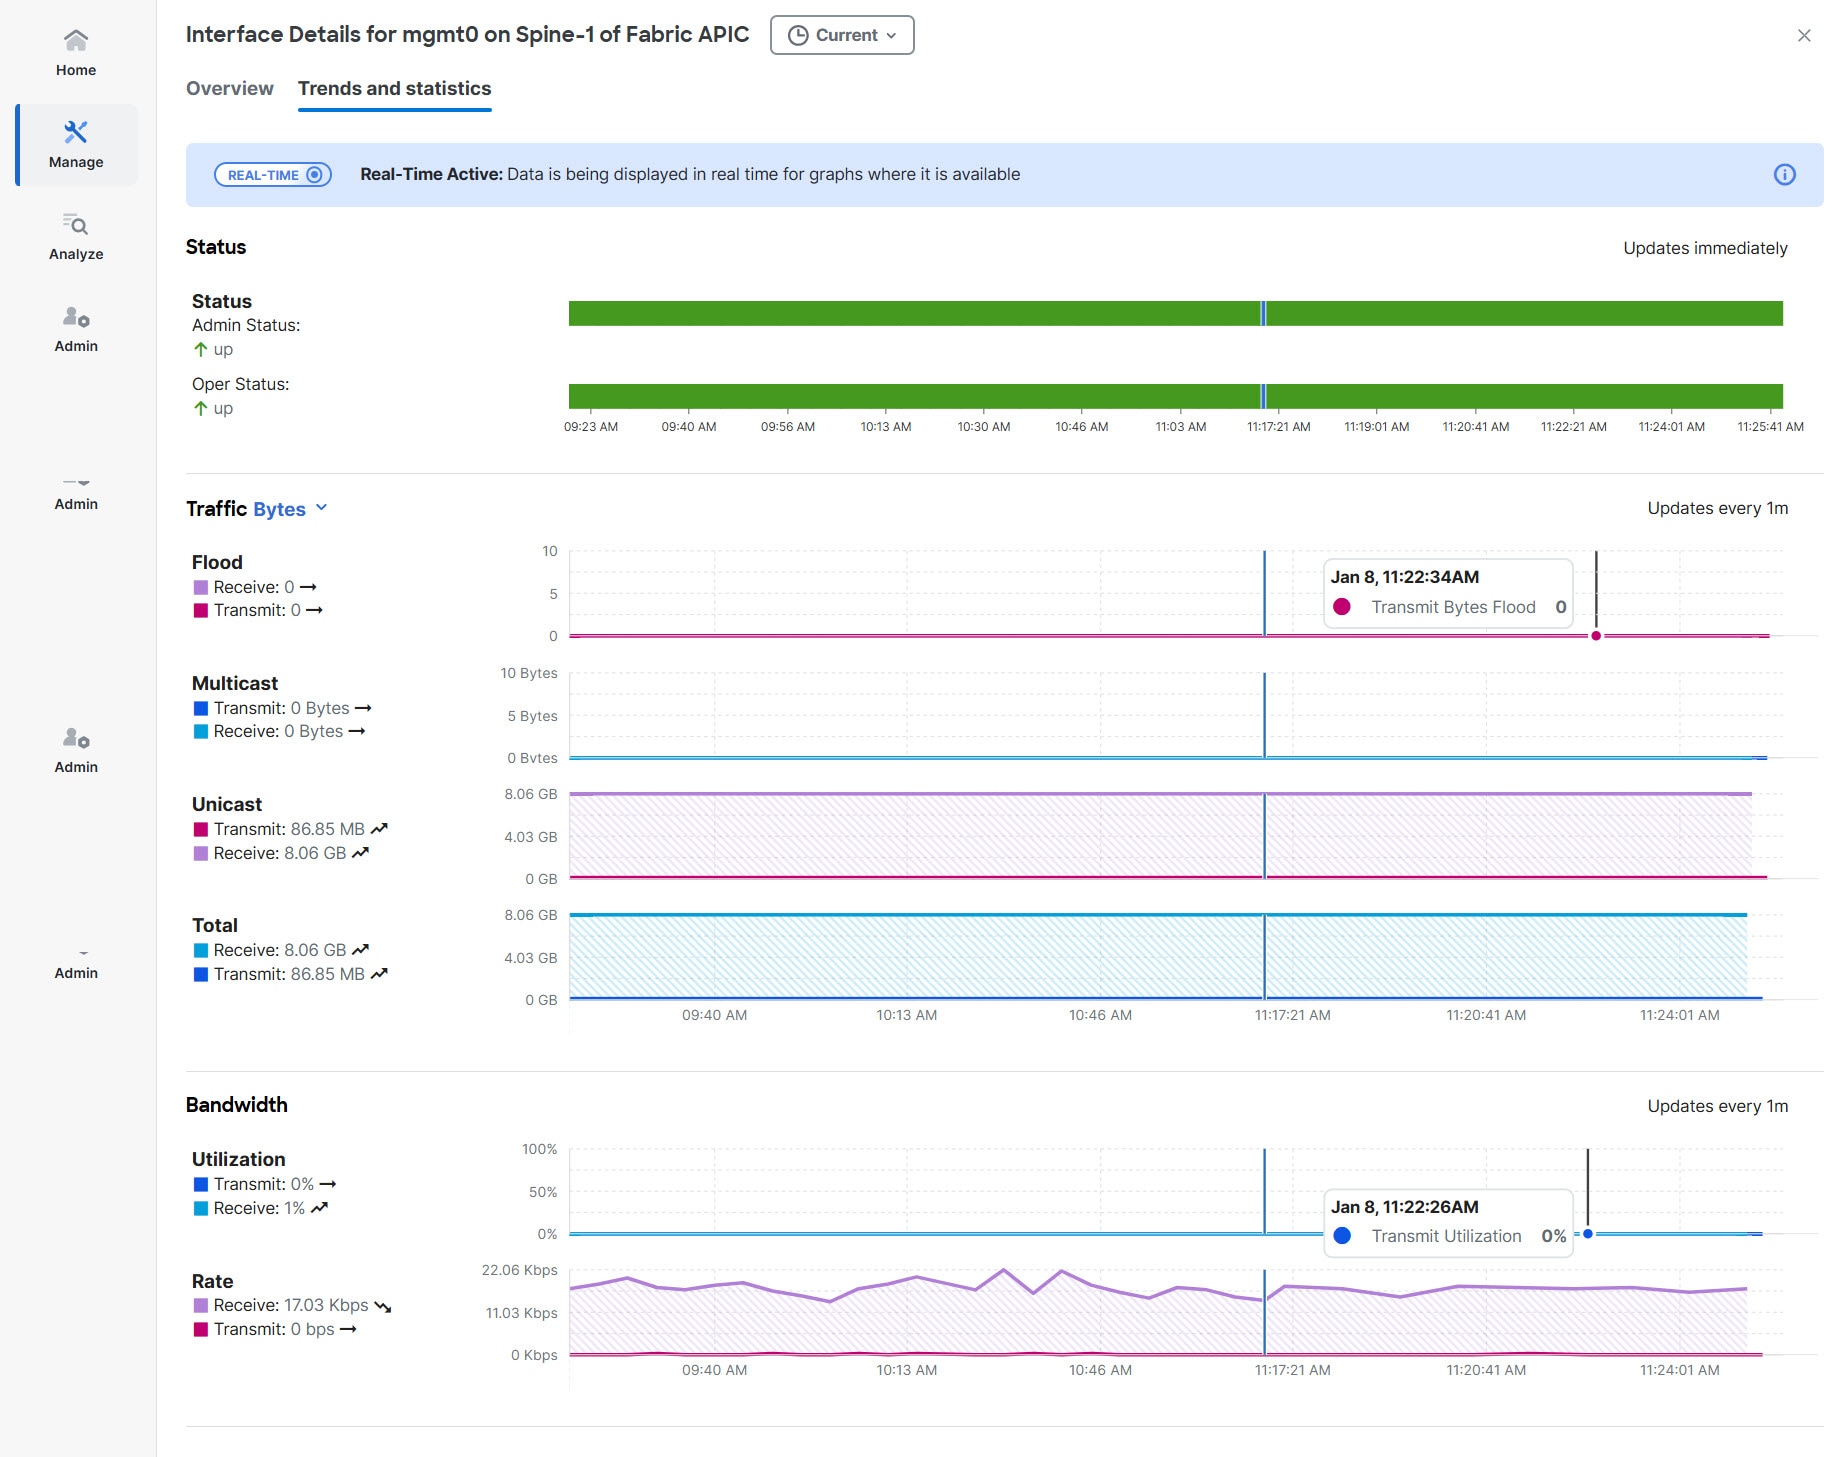
Trends and statistics
Monitor the trends and statistics information on a specific interface on a switch using the Trends and statistics tab. For ACI and NX-OS fabrics, you can view admin and operational status, traffic flowing over the interface, bandwidth, and errors. For standalone NX-OS fabric, view information on the traffic flowing over the interface, the interface usage, and various types of statistics for congestions, Microbursts, and errors. You can also view the statistics and trends for the physical interface LACP on the Trends and statistics page.
-
Logical interfaces such as Loopback, Tunnels, and NVE interfaces are not supported on the Trends and Statistics page, but you can view the Admin and Operation stat trends for these interfaces.
-
Due to switch limitations on the NX-OS fabric, only ACI fabric sub-interfaces are supported on the Trends and Statistics page.
All the trend and statistics data, except Microburst, are rendered in real time. Real Time Visualization helps you to view up-to-date information.
Nexus Dashboard allows you to view and monitor trends and satistics for a specific interface type, see View trends and statistics for an interface type for details. NX-OS switches support the new subscription service and will send notifications to all interested clients for every sample (every 10 seconds). In the event of any issues with the dial-in connection, it will automatically fall back to the regular update cadence, which is at 1-minute intervals.
The dial-in connection will always use the primary Layer 3 IP (IPv4/IPv6) address of the interface.
ACI switches do not support gNMI-based subscriptions, so Nexus Dashboard will provide notifications based on a cadence, with statistics updates occurring at 1-minute intervals.
-
Admin Status (Real-time visualization)
-
Operational Status (Real-time visualization)
-
Errors (Real-time visualization for standalone NX-OS)
-
Traffic (by bytes or by packets) (Real-time visualization)
-
Flood
-
Multicast
-
Unicast
-
Total
-
-
Bandwidth (Real-time visualization for standalone NX-OS)
-
Utilization
-
Rate
-
-
Congestion (standalone NX-OS)
-
Congestion score
-
PFC
-
ECN
-
Drops
-
RED/WRED/AFD
-
Errors
-
-
Microbursts (ACI)
The congestion statistics show the ECN and PFC counters for the traffic received and transmitted. This is used to display where the congestion occurs. Click on any of the counter graphs displayed to view the per queue counters. This displays the list of the counters in the queue along with the number of packets in the respective queue.
View trends and statistics for an interface type
Follow these steps to view the trends and statistics for an interface type:
-
Click Switches > Any switch > Connectivity > Interfaces > Type
-
Choose an interface type.
Alternatively, you can use the Filter by feature to view a specific type of interface. For example, use the attribute, "Type == Management" in the Filter-by field to display all management interfaces.
-
Choose an interface listed in the interface table to display the interface details page for this interface.
-
Click the Trends and statistics tab to view real time active data in a graph format.
Use the date picker to change the time scope to view and analyze historical data and trends for this interface.
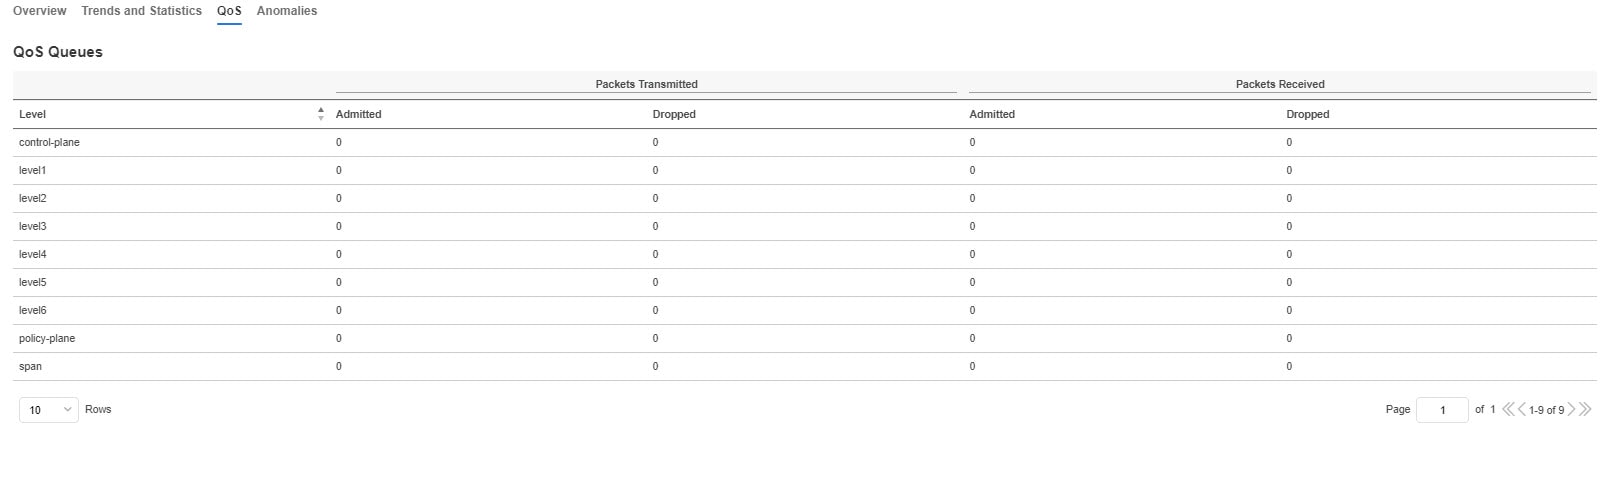
QoS
Quality of Service (QoS) in networking is a process that controls traffic to adjust the overall network traffic based on the requirements of specific applications.
Anomalies
Click to view anomaly information on this specific interface in this switch. See Anomalies for more information.
The Anomaly level shows the total number of anomalies that have occurred and the number of anomalies that have occurred in the last week.
Hover over the Anomaly Level to view the category of the anomalies occurred. Click the Anomaly Level to get specific information on the anomalies present for the specific controller or switch.
The View all anomalies takes you to the Anomalies tab. See Anomalies to understand how to navigate across the anomalies.
Microbursts
Click Switches > Any switch > Connectivity > Interfaces > Any interface > Trends and Statistics to view Microbursts in Inventory.
A burst of traffic impacts the output buffer of a physical interface port given the channel is already subscribed with line-rate flows. These bursts are often hard to detect with just given queuing parameters, such as buffer cells used and buffer cells unused as there is a high variance of usage of these buffers.
The Cisco Nexus 9000 series switches provide a capability of detecting this by issuing an interrupt that is triggered when a queue occupancy rises above x bytes and falls below y bytes. You can configure up to 8 output queues per physical interface port.
To configure Microburst in Nexus Dashboard, navigate to Admin > System Settings > Microburst.
See the Microburst section in Getting Started to view more details.
You can view the microbursts details such as Queue, Start Time, Number of Bursts, Max Duration, Avg. Duration, Max Peak, and Avg Peak in the Microbursts section. A chart view and a tabular view is available.
Microburst Anomaly
Anomalies are raised in Nexus Dashboard based on the number of microbursts at the interface level. Microburst anomaly jobs run every 5 minutes in a container environment, which checks for microburst records in microburst database. If the number of microbursts per interface is greater than microburst count threshold at any given point of time, then a minor anomaly is raised per interface in a node.
Nexus Dashboard raises these anomalies:
-
The flows that are displayed in the summary table are gathered from Flow Telemetry data for a corresponding egress interface. Nexus Dashboard matches the egress interface and egress queue to gather the corresponding microburst.
-
Based on the percentage of threshold, microburst is either low, high, or medium. The percentage of threshold is inverse to sensitivity. When the number of microbursts are greater than 100 on a particular interface, an anomaly is raised.
-
If flow telemetry is enabled and microburst is also enabled, then Nexus Dashboard displays the estimated impact of flows for a particular microburst anomaly.
-
If the flow telemetry is disabled and microburst anomaly is enabled, then Nexus Dashboard displays no Estimated Impact for that anomaly.
-
Flows that are contributing or impacted by microburst.
Filtering information
In some cases, you might be able to filter results to find information more easily.
For example, you might have a situation where there a large number of endpoints under a single leaf switch, but you are only interested in endpoints that have a certain VLAN value.
You could filter the information to show only those specific endpoints in this situation.
Use the following operators for the filter refinement:
| Operator | Description |
|---|---|
|
== |
With the initial filter type, this operator, and a subsequent value, returns an exact match. |
|
!= |
With the initial filter type, this operator, and a subsequent value, returns all that do not have the same value. |
|
contains |
With the initial filter type, this operator, and a subsequent value, returns all that contain the value. |
|
!contains |
With the initial filter type, this operator, and a subsequent value, returns all that do not contain the value. |
|
< |
With the initial filter type, this operator, and a subsequent value, returns a match less than the value. |
|
< = |
With the initial filter type, this operator, and a subsequent value, returns a match less than or equal to the value. |
|
> |
With the initial filter type, this operator, and a subsequent value, returns a match greater than the value. |
|
> = |
With the initial filter type, this operator, and a subsequent value, returns a match greater than or equal to the value. |