
New and changed information
The following table provides an overview of the significant changes up to this current release. The table does not provide an exhaustive list of all changes or of the new features up to this release.
| Release Version | Feature | Description |
|---|---|---|
|
Nexus Dashboard 4.1.1 |
Improved navigation and workflow when editing ACI fabric settings. |
Beginning with Nexus Dashboard 4.1.1, the navigation and workflow when editing ACI fabric settings in Nexus Dashboard have been enhanced. |
Editing ACI fabric settings
The Cisco Application Centric Infrastructure (ACI) is an architecture that allows the application to define the networking requirements in a programmatic way. This architecture simplifies, optimizes, and accelerates the entire application deployment lifecycle. Cisco Application Policy Infrastructure Controller (APIC) is the software, or operating system, that acts as the controller.
When you first create an ACI fabric using the procedures provided in Creating LAN and ACI Fabrics and Fabric Groups, the standard workflow allows you to create a fabric using the bare minimum settings so that you are able to create a fabric quickly and easily. Use the procedures in this article to make more detailed configurations for your ACI fabric.
-
Navigate to the main Fabrics window:
Manage > Fabrics
-
Locate the ACI fabric that you want to edit.
ACI fabrics are shown with ACI in the Type column.
-
Click the circle next to the ACI fabric that you want to edit to select that fabric, then click Actions > Edit Fabric Settings.
The Edit fabric_name Settings window appears.
-
Click the appropriate tab to edit these settings for the fabric:
General
Use the information in this section to edit the settings in the General window for your ACI fabric.
Change the general parameters that you configured previously for the ACI fabric, if necessary.
| Fabric type | Description |
|---|---|
|
Name |
Displays the name for the fabric. This field is not editable because you are editing the configuration for this existing fabric. |
|
Location |
Change the location for the fabric, if necessary. |
|
License tier |
Change the licensing tier for the fabric, if necessary:
Click on the information icon (i) next to License tier to see what functionality is enabled for each license tier. |
|
Enabled features |
Check the appropriate box to enable these features:
|
|
Telemetry collection |
This option becomes available if you choose to enable Telemetry in the Enabled features field above. Choose either Out-of-band or In-band for telemetry collection. 
The Out-of-band option is only supported on ACI version 6.1(2f) and above. |
|
Telemetry streaming via |
This option becomes available if you choose to enable Telemetry in the Enabled features field above. Choose either IPv4 or IPv6. |
|
Security domain |
The Security domain option is disabled for ACI fabrics. |
Telemetry
The telemetry feature in Nexus Dashboard allows you to collect, manage, and monitor real-time telemetry data from your Nexus Dashboard. This data provides valuable insights into the performance and health of your network infrastructure, enabling you to troubleshoot proactively and optimize operations. When you enable telemetry, you gain enhanced visibility into network operations and efficiently manage your fabrics.
Follow these steps to enable telemetry for a specific fabric.
-
Navigate to the Fabrics page.
Go to Manage > Fabrics.
-
Choose the fabric for which you want to enable telemetry.
-
From the Actions drop-down list, choose Edit fabric settings.
The Edit fabric-name settings page displays.
You can also access the Edit fabric-name settings page for a fabric from the Fabric Overview page. In the Fabric Overview page, click the Actions drop-down list and choose Edit fabric settings.
-
In the Edit fabric-name settings page, click the General tab.
-
Under the Enabled features section, check the Telemetry check box.
-
Click Save.
Navigate back to the Edit fabric-name settings page. The Telemetry tab displays.
NOTE: The Telemetry tab appears only when you enable the Telemetry option under the General tab in the Edit fabric-name settings page.
The Telemetry tab includes these options.
-
Configuration — allows you to manage telemetry settings and parameters.
-
NAS — provides Network Analytics Service (NAS) features for advanced insights.
Edit configuration settings
The Configuration tab includes these settings.
-
General — allows you to enable analysis.
You can enable these settings.
-
Enable assurance analysis — enables you to collect of telemetry data from devices to ensure network reliability and performance.
-
Enable Microburst sensitivity - allows you to monitor traffic to detect unexpected data bursts within a very small time window (microseconds). Choose the sensitivity type from the Microburst Sensitivity Level drop-down list. The options are High sensitivity, Medium sensitivity, and Low sensitivity.
The Enable Microburst sensitivity option is available only for ACI fabrics.
-
-
Flow collection modes — allows you to choose the mode for telemetry data collection. Modes include NetFlow, sFlow, and Flow Telemetry.
For more information see: Flow collection and [Configure flows].
-
Flow collection rules — allows you to define rules for monitoring specific subnets or endpoints. These rules are pushed to the relevant devices, enabling detailed telemetry data collection.
For more information, see Flow collection.
Edit NAS settings
Nexus Dashboard allows you to export captured flow records to a remote NAS device using the Network File System (NFS) protocol. Nexus Dashboard defines the directory structure on NAS where the flow records are exported.
You can choose between the two export modes.
-
Full — exports the complete data for each flow record.
-
Base — exports only the essential 5-tuple data for each flow record.
Nexus Dashboard needs both read and write permissions on the NAS to perform the export successfully. If Nexus Dashboard cannot write to the NAS, it will generate an alert to notify you of the issue.
Disable Telemetry
You can uncheck the Telemetry check box on your fabric’s Edit Fabric Settings > General > page to disable the telemetry feature for your fabric. Disabling telemetry puts the telemetry feature in a transition phase and eventually the telemetry feature is disabled.
In certain situations, the disable telemetry workflow can fail, and you may see the Force disable telemetry option on your fabric’s Edit Fabric Settings page.
If you disable the telemetry option using the instructions provided in Perform force disable telemetry on your fabric on your fabric, Nexus Dashboard acknowledges the user intent to disable telemetry feature for your fabric, ignoring any failures.
The Nexus Dashboard Force disable telemetry allows you to perform a force disable action for the telemetry configuration on your fabric. This action is recommended when the telemetry disable workflow has failed and you need to disable the telemetry feature on your fabric.
Using the Force disable telemetry feature may leave switches in your fabric with stale telemetry configurations. You must manually clean up these stale configurations on the switches before re-enabling telemetry on your fabric.
Perform force disable telemetry on your fabric
Follow these steps to perform a force disable telemetry on your fabric.
-
(Optional) Before triggering a force disable of telemetry configuration, resolve any telemetry configuration anomalies flagged on the fabric.
-
On the Edit Fabric Settings page of your fabric, a banner appears to alert you that telemetry cannot be disabled gracefully, and a Force Disable option is provided with the alert message.
-
Disable telemetry from the Nexus Dashboard UI using one of these options.
-
Click the Force disable option in the banner that appears at the top of your fabric’s Edit Fabric Settings page to disable telemetry for your fabric gracefully.
-
Navigate to your fabric’s Overview page and click the Actions drop-down list to choose Telemetry > Force disable telemetry option.
Once the force disable action is executed, the Telemetry configuration appears as disabled in Edit Fabric Settings > General > Enabled features > Telemetry area, that is, the Telemetry check box is unchecked.
-
-
Clean up any stale telemetry configurations from the fabric before re-enabling telemetry on Nexus Dashboard.
NAS
You can export flow records captured by Nexus Dashboard on a remote Network Attached Storage (NAS) with NFS.
Nexus Dashboard defines the directory structure on NAS where the flow records are exported.
You can export the flow records in Base or Full mode. In Base mode, only 5-tuple data for the flow record is exported. In Full mode the entire data for the flow record is exported.
Nexus Dashboard requires read and write permission to NAS in order to export the flow record. A system issue is raised if Nexus Dashboard fails to write to NAS.
Guidelines and limitations for network attached storage
-
In order for Nexus Dashboard to export the flow records to an external storage, the Network Attached Storage added to Nexus Dashboard must be exclusive for Nexus Dashboard.
-
Network Attached Storage with Network File System (NFS) version 3 must be added to Nexus Dashboard.
-
Flow Telemetry and Netflow records can be exported.
-
Export of FTE is not supported.
-
Average Network Attached Storage requirements for 2 years of data storage at 20k flows per sec:
-
Base Mode: 500 TB data
-
Full Mode: 2.8 PB data
-
-
If there is not enough disk space, new records will not be exported and an anomaly is generated.
Add network attached storage to export flow records
The workflow to add Network Attached Storage (NAS) to export flow records includes the following steps:
-
Add NAS to Nexus Dashboard.
-
Add the onboarded NAS to Nexus Dashboard to enable export of flow records.
Add NAS to Nexus Dashboard
Follow these steps to add NAS to Nexus Dashboard.
-
Navigate to Admin > System Settings > General.
-
In the Remote storage area, click Edit.
-
Click Add Remote Storage Locations.
-
Complete the following fields to add NAS to Nexus Dashboard.
-
Enter the name of the Network Attached Storage and a description, if desired.
-
In the Remote storage location type field, click NAS Storage.
-
In the Type field, choose Read Write.
Nexus Dashboard requires read and write permission to export the flow record to NAS. A system issue is raised if Nexus Dashboard fails to write to NAS.
-
In the Hostname field, enter the IP address of the Network Attached Storage.
-
In the Port field, enter the port number of the Network Attached Storage.
-
In the Export path field, enter the export path.
Using the export path, Nexus Dashboard creates the directory structure in NAS for exporting the flow records.
-
In the Alert threshold field, enter the alert threshold time.
Alert threshold is used to send an alert when the NAS is used beyond a certain limit.
-
In the Limit (Mi/Gi) field, enter the storage limit in Mi/Gi.
-
Click Save.
-
Add the onboarded NAS to Nexus Dashboard
Follow these steps to add the onboarded NAS to Nexus Dashboard.
-
Navigate to the Fabrics page:
Manage > Fabrics
-
Choose the fabric with the telemetry feature enabled.
-
Choose Actions > Edit Fabric Settings.
-
Click Telemetry.
-
Click the NAS tab in the Telemetry page.
-
Make the necessary configurations in the General settings area.
-
Enter the name in the Name field.
-
In the NAS server field, choose the NAS server added to Nexus Dashboard from the drop-down list.
-
-
In the Collection settings area, choose the flow from the Flows drop-down list.
-
In Base mode, only 5-tuple data for the flow record is exported.
-
In Full mode, the entire data for the flow record is exported.
-
-
Click Save.
The traffic from the flows displayed in the Flows page is exported as a JSON file to the external NAS in the following directory hierarchy.
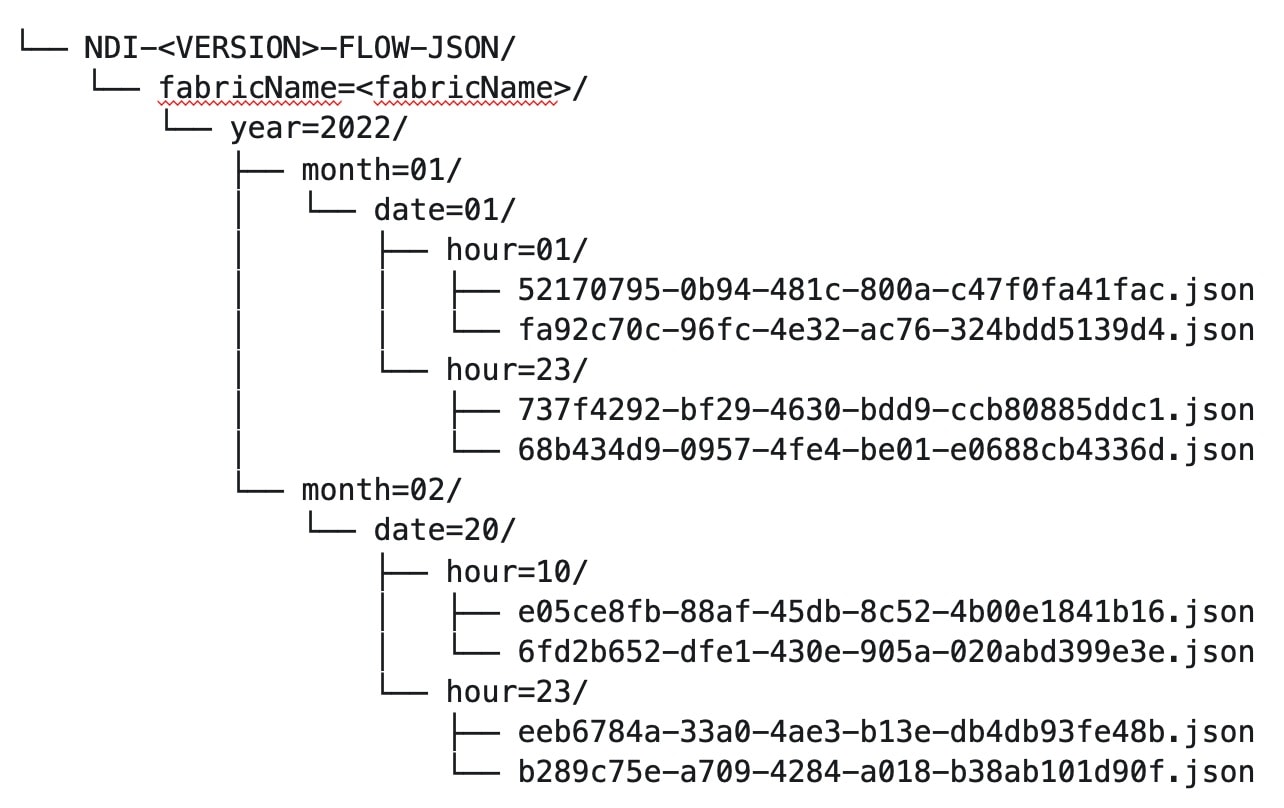
Navigate to Analyze > Flows to view the flows that will be exported.
Each flow record is written as a line delimited JSON.
JSON output file format for a flow record in base mode
{"fabricName":"myapic","terminalTs":1688537547433,"originTs":1688537530376,"srcIp":"2000:201:1:1::1","dstIp":"2000:201:1:1::3","srcPort":1231,"dstPort":1232,"ingressVrf":"vrf1","egressVrf":"vrf1","ingressTenant":"FSV1","egressTenant":"FSV1","protocol":"UDP"}

{"fabricName":"myapic","terminalTs":1688537547378,"originTs":1688537530377,"srcIp":"201.1.1.127","dstIp":"201.1.1.1","srcPort":0,"dstPort":0,"ingressVrf":"vrf1","egressVrf":"","ingressTenant":"FSV2","egressTenant":"","protocol":"ANY-HOST"}
JSON output file format for a flow record in full mode
{"fabricName":"myapic","terminalTs":1688538023562,"originTs":1688538010527,"srcIp":"201.1.1.121","dstIp":"201.1.1.127","srcPort":0,"dstPort":0,"ingressVrf":"vrf1","egressVrf":"vrf1","ingressTenant":"FSV2","egressTenant":"FSV2","protocol":"ANY-HOST","srcEpg":"ext-epg","dstEpg":"ext-epg1","latencyMax":0,"ingressVif":"eth1/15","ingressVni":0,"latency":0,"ingressNodes":"Leaf1-2","ingressVlan":0,"ingressByteCount":104681600,"ingressPktCount":817825,"ingressBurst":0,"ingressBurstMax":34768,"egressNodes":"Leaf1-2","egressVif":"po4", "egressVni":0,"egressVlan":0,"egressByteCount":104681600,"egressPktCount":817825,"egressBurst":0,"egressBurstMax":34768,"dropPktCount":0,"dropByteCount":0,"dropCode":"","dropScore":0,"moveScore":0,"latencyScore":0,"burstScore":0,"anomalyScore":0,"hashCollision":false,"dropNodes":"[]","nodeNames":"[\"Leaf1-2\"]","nodeIngressVifs":"[\"Leaf1-2,eth1/15\"]","nodeEgressVifs":"[\"Leaf1-2,po4\"]“ ,"srcMoveCount":0,"dstMoveCount":0,"moveCount":0,"prexmit":0,"rtoOutside":false,"events":"[[\\\"1688538010527,Leaf1-2,0,3,1,no,no,eth1/15,,po4,po4,,,,,0,64,0,,,,,,,,\\\"]]"}
Flow collection
Understanding flow telemetry
Flow telemetry allows users to see the path taken by different flows in detail. It also allows you to identify the EPG and VRF instance of the source and destination. You can see the switches in the flow with the help of flow table exports from the nodes. The flow path is generated by stitching together all the exports in order of the flow.
You can configure the Flow Telemetry rule for the following interface types:
-
VRF instances
-
Physical interfaces
-
Port channel interfaces
-
Routed sub-interfaces (Cisco ACI fabric)
-
SVIs (Cisco ACI fabric)
In a Cisco ACI fabric, if you want to configure routed sub-interfaces from the UI, select L3 Out.
In an NX-OS fabric, physical or port channel flow rules are supported only on routed interfaces.
Flow telemetry monitors the flow for each fabric separately, as there is no stitching across the fabrics in a fabric group. Therefore, flow telemetry is for individual flows. For example, if there are two fabrics (fabric A and fabric B) within a fabric group, and traffic is flowing between the two fabrics, they will be displayed as two separate flows. One flow will originate from Fabric A and display where the flow exits. And the other flow from Fabric B will display where it enters and where it exits.
Flow telemetry guidelines and limitations
-
All flows are monitored as a consolidated view in a unified pipeline for Cisco ACI and NX-OS fabrics, and the flows are aggregated under the same umbrella.
-
Even if a particular node (for example, a third-party switch) is not supported for Flow Telemetry, Nexus Dashboard will use LLDP information from the previous and next nodes in the path to identify the switch name and the ingress and egress interfaces.
-
Nexus Dashboard supports Kafka export for Flow anomalies. However, Kafka export is not currently supported for Flow Event anomalies.
Flow telemetry guidelines and limitations for Cisco ACI fabrics
-
Ensure that you have configured NTP and enabled PTP in Cisco APIC. See Cisco Nexus Dashboard Deployment Guide and Precision Time Protocol (PTP) for Cisco Nexus Dashboard Insights for more information.
-
You can enable the toggle buttons for Flow Telemetry and Netflow. We recommend that you that you enable either one of the options.
-
If a Nexus Dashboard cluster is connected to a Cisco ACI fabric directly using an EPG:
-
Make sure you do not have any native or leaked default routes in the mgmt:inb vrf instance.
-
Make sure Nexus Dashboard data network subnet is different from the Cisco ACI fabric in-band subnet.
-
-
The following Cisco Nexus 9000 ACI-Mode Switches versions are not supported with Nexus Dashboard Flow Telemetry:
-
14.2(4i)
-
14.2(4k)
-
15.0(1k)
If you enable Flow Collection for a fabric that contains 1 or more unsupported switches, the status of Flow is displayed as Disabled. After you upgrade the switches to a supported version, the status of Flow is displayed as Enabled.
-
-
Interface-based Flow Telemetry is only supported on leaf switches and is not supported on spine switches.
-
The following Cisco Nexus 9000 ACI-Mode Switches versions are supported with Nexus Dashboard for interface based Flow Telemetry:
-
Cisco APIC release 6.0(3) and later
-
Cisco NX-OS release 16.0(3) and later
-
-
SVIs are not supported for telemetry streaming to Nexus Dashboard.
Flow telemetry rules guidelines and limitations for Cisco ACI fabrics
-
The node can operate either in the VRF mode or interface mode. If the rule is configured in a physical, port channel, L3Out, or SVI node, then the node operates in interface mode. If both VRF and interface rules are configured, interface rules take preference and take effect, the VRF rule will not take effect. Let’s consider a scenario where multiple VRF rules are configured on a node, and you configure an interface rule. In that case, all the rules in the node are converted to interface rules and only the interface rules will be active on that node. If you remove the interface rules from that node, the rules will be converted back to VRF mode.
-
If you configure an interface rule (physical, port channel, L3Out, or SVI) on a subnet, it can monitor only incoming traffic. It cannot monitor outgoing traffic on the configured rule.
-
If a configured port channel contains two physical ports, only the port channel rule is applicable. Even if you configure physical interface rules on the port, the port channel rule takes precedence.
Configuring flows
Configure flow collection modes
Follow these steps to configure flow collection modes.
-
Navigate to Admin > System Settings > Flow Collection.
-
In the Flow Collection Modes area, select Flow Telemetry.
Enabling Flow Telemetry automatically activates Flow Telemetry Events. Whenever a compatible event takes place, an anomaly will be generated, and the What’s the impact? section in the Anomaly page will display the associated flows. You can manually configure a Flow Telemetry rule to acquire comprehensive end-to-end information about the troublesome flow.
Configure flow collection rules in a Cisco ACI fabric
Follow these steps to configure flow collection rules in a Cisco ACI fabric.
-
Navigate to the Telemetry window for your fabric.
-
Navigate to the main Fabrics page:
Manage > Fabrics
-
In the table showing all of the Nexus Dashboard fabrics that you have already created, locate the LAN or IPFM fabric where you want to configure telemetry settings.
-
Single-click on that fabric.
The Overview page for that fabric appears.
-
Click Actions > Edit Fabric Settings.
The Edit fabric_name Settings window appears.
-
Verify that the Telemetry option is enabled in the Enabled features area.
The Telemetry tab doesn’t become available unless the Telemetry option is enabled in the Enabled features area.
-
Click the Telemetry tab to access the telemetry settings for this fabric.
-
-
Click the Flow collection tab in the Telemetry window.
-
In the Mode area, click Flow telemetry.
-
In the Flow collections rules area, determine what sort of flow collection rule that you want to add.
To add a VRF rule:
-
Click the VRF tab.
A table with already-configured VRF flow collection rules is displayed.
For any VRF flow collection rule in this table, click the ellipsis (…), then click Edit rule to edit that rule or Delete rule to delete it.
-
Add a new rule by clicking Create flow collection rule.
-
In the General area, complete the following:
-
Enter the name of the rule in the Rule Name field.
-
Choose the tenant from the Tenant drop-down list.
-
Select the VRF from the VRF drop-down list.
-
In the Subnets area, enter the subnet on which you intend to monitor the flow traffic. If you have endpoints that are under the same endpoint groups, then you can provide a rule to monitor the subnet.
-
Click Add Subnet.
-
-
Click Save.
-
To add a physical interface rule:
-
Click the Physical interface tab.
A table with already-configured physical interface flow collection rules is displayed.
For any physical interface flow collection rule in this table, click the ellipsis (…), then click Edit rule to edit that rule or Delete rule to delete it.
-
Add a new rule by clicking Create flow collection rule.
-
In the General area, complete the following:
-
Enter the name of the rule in the Rule Name field.
-
From the drop-down list, select an interface. You can add more than one row (node+interface combination) by clicking Add Interfaces. However, within the rule, a node can appear only once. Configuration is rejected if more than one node is added.
-
In the Subnets area, enter the subnet on which you want to monitor the flow traffic.
-
Click Add Subnet.
-
-
Click Save.
-
To add a port channel rule:
-
Click the Port channel tab.
A table with already-configured port channel flow collection rules is displayed.
For any port channel flow collection rule in this table, click the ellipsis (…), then click Edit rule to edit that rule or Delete rule to delete it.
-
Add a new rule by clicking Create flow collection rule.
-
In the General area, complete the following:
-
Enter the name of the rule in the Rule Name field.
-
From the drop-down list, select an interface. You can add more than one row (node+interface combination) by clicking Add Interfaces. However, within the rule, a node can appear only once. Configuration is rejected if more than one node is added.
-
In the Subnets area, enter the subnet on which you want to monitor the flow traffic.
-
Click Add Subnet.
-
-
Click Save.
-
To add a L3Out sub-interface rule:
-
Click the L3Out Sub-Interface tab.
A table with already-configured L3Out sub-interface flow collection rules is displayed.
For any L3Out sub-interface flow collection rule in this table, click the ellipsis (…), then click Edit rule to edit that rule or Delete rule to delete it.
-
Add a new rule by clicking Create flow collection rule.
-
In the General area, complete the following:
-
Enter the name of the rule in the Rule Name field.
-
From the respective drop-down list, select a tenant, L3Out, encapsulation, and interface.
-
If the L3Out is not configured on the node, you cannot select any items from the drop-down list and you cannot configure the flow rule.
-
For and L3Out based interface rule, you can select Sub-Interface type L3Out from the L3Out drop-down menu. To configure other L3Out rules such as Port Channel, SVI, and Physical Interface, click the respective tab.
-
-
In the Subnets area, enter the subnet on which you want to monitor the flow traffic.
-
Click Add Subnet.
-
Click Save.
-
-
To add an L3Out SVI rule:
-
Click the L3Out SVI tab.
A table with already-configured L3Out SVI flow collection rules is displayed.
For any L3Out SVI flow collection rule in this table, click the ellipsis (…), then click Edit rule to edit that rule or Delete rule to delete it.
-
Add a new rule by clicking Create flow collection rule.
-
In the General area, complete the following:
-
Enter the name of the rule in the Rule Name field.
-
Select the Enabled check box to enable the status. If you enable the status, the rule will take effect. Otherwise, the rule will be removed from the switches.
-
From the respective drop-down list, select a tenant, L3Out, and encapsulation.
-
In the Subnets area, enter the subnet on which you want to monitor the flow traffic.
-
Click Add Subnet.
-
-
Click Save.
-
-
Click Done.
Monitor the subnet for flow telemetry
In the following example, the configured rule for a flow monitors the specific subnet provided. The rule is pushed to the fabric which pushes it to the switches. So, when the switch sees traffic coming from a source IP or the destination IP, and if it matches the subnet, the information is captured in the TCAM and exported to the Nexus Dashboard service. If there are 4 nodes (A, B, C, D), and the traffic moves from A > B > C > D, the rules are enabled on all 4 nodes and the information is captured by all the 4 nodes. Nexus Dashboard stitches the flows together. Data such as the number of drops and the number of packets, anomalies in the flow, and the flow path are aggregated for the 4 nodes.
Follow these steps to monitor the subnet for flow telemetry.
-
Navigate to Manage > Fabric.
-
Choose a fabric.
-
Verify that your Fabrics and the Snapshot values are appropriate. The default snapshot value is 15 minutes. Your choice will monitor all the flows in the chosen fabric or snapshot fabric.
-
Navigate to Connectivity > Flows to view a summary of all the flows that are being captured based on the snapshot that you chose.
The related anomaly score, record time, the nodes sending the flow telemetry, flow type, ingress and egress nodes, and additional details are displayed in a table format. If you click a specific flow in the table, specific details are displayed in the sidebar for the particular flow telemetry. In the sidebar, if you click the Details icon, the details are displayed in a larger page. In this page, in addition to other details, the Path Summary is also displayed with specifics related to source and destination. If there are flows in the reverse direction, that will also be visible in this location.
For a bi-directional flow, there is an option to choose to reverse the flow and see the path summary displayed. If there are any packet drops that generate a flow event, they can be viewed in the Anomaly dashboard.
Understanding Netflow
Netflow is an industry standard where Cisco routers monitor and collect network traffic on an interface. Netflow version 9 is supported.
Netflow enables the network administrator to determine information such as source, destination, class of service, and causes of congestion. Netflow is configured on the interface to monitor every packet on the interface and provide telemetry data. You cannot filter on Netflow.
Netflow in Nexus series switches is based on intercepting the packet processing pipeline to capture summary information of network traffic.
The components of a flow monitoring setup are as follows:
-
Exporter: Aggregates packets into flows and exports flow records towards one or more collectors
-
Collector: Reception, storage, and pre-processing of flow data received from a flow exporter
-
Analysis: Used for traffic profiling or network intrusion
-
The following interfaces are supported for Netflow:
| Interfaces | 5 Tuple | Nodes | Ingress | Egress | Path | Comments |
|---|---|---|---|---|---|---|
|
Routed Interface/Port Channel |
Yes |
Yes |
Yes |
No |
Yes |
Ingress node is shown in path |
|
Sub Interface/Logical (Switch Virtual Interface) |
Yes |
Yes |
No |
No |
No |
No |
In an NX-OS fabric, port channel support is available if you monitor only the host-facing interfaces.
Understanding Netflow types
You can use these Netflow types:
Full Netflow
With Full Netflow, all packets on the configured interfaces are captured into flow records in a flow table. Flows are sent to the supervisor module. Records are aggregated over configurable intervals and exported to the collector. Except in the case of aliasing (multiple flows hashing to the same entry in the flow table), all flows can be monitored regardless of their packet rate.
Nexus 9000 Series switches with the Fabric Controller type as well as switches in a Cisco ACI fabric support Full Netflow.
Sampled Netflow
With Sampled Netflow, packets on configured interfaces are time sampled. Flows are sent to the supervisor or a network processor for aggregation. Aggregated flow records are exported at configured intervals. The probability of a record for a flow being captured depends on the sampling frequency and packet rate of the flow relative to other flows on the same interface.
Nexus 7000 and Nexus 7700 Series switches with F/M line cards and the Fabric Controller type, support Sampled Netflow.
Netflow guidelines and limitations
-
In Cisco Nexus 9000 series switches, Netflow supports a small subset of the published export fields in the RFC.
-
Netflow is captured only on the ingress port of a flow as only the ingress switch exports the flow. Netflow cannot be captured on fabric ports.
Netflow guidelines and limitations for Cisco ACI fabrics
-
We recommend that you enable Flow Telemetry. If that is not available for your configuration, use Netflow. However, you can determine which mode of flow to use based upon your fabric configuration.
-
Enabling both Flow Telemetry and Netflow is not supported.
-
After you enable Netflow, you must obtain the Netflow collector IP address and configure Cisco APIC with the collector IP address. See Cisco APIC and NetFlow.
To obtain the Netflow collector IP address, navigate to Admin > System Settings > General, then locate the External Pools area. Click View all at the bottom left area of the External Pools tile; the Telemetry-collector persistent IP addresses listed in the table are used for the Netflow collector IP address.
-
The Netflow and sFlow flow collection modes do not support any anomaly.
Netflow guidelines and limitations for NX-OS fabrics
-
In the Edit Flow page, you can enable all three modes. Choose the best possible mode for a product. sFlow is the most restrictive, Netflow has more capabilities, and Flow Telemetry has the most capabilities. We recommend that you enable Flow Telemetry if it is available for your configuration. If Flow Telemetry is not available, then use Netflow. If Netflow is not available, use sFlow.
-
In Nexus 7000 and Nexus 9000 Series switches, only the ingress host-facing interface configured for Netflow are supported (either in VXLAN or Classic LAN).
-
The Netflow supported fabrics are Classic and VXLAN. VXLAN is not supported on fabric ports.
-
Netflow configurations will not be pushed. However, if a fabric is managed, the software sensors will be pushed.
-
If you manually configure the fabric to use with Nexus Dashboard and Netflow support, the Flows Exporter port changes from 30000 to 5640. To prevent a breakage of the Flows Exporter, adjust the automation.
-
To configure Netflow on fabric switches, see the Configuring Netflow section in the Cisco Nexus 9000 Series NX-OS System Management Configuration Guide.
Configure Netflow
Follow these steps to configure Netflow.
-
Navigate to the Telemetry page for your LAN or IPFM fabric.
-
Click the Flow collection tab on the Telemetry page.
-
In the Mode area, make the following choices:
-
Choose Netflow.
-
Choose Flow Telemetry.
-
-
Click Save.
Understanding sFlow
sFlow is an industry standard technology traffic in data networks containing switches and routers. Nexus Dashboard supports sFlow version 5 on Cisco Nexus 3000 series switches.
sFlow provides the visibility to enable performance optimization, an accounting and billing for usage, and defense against security threats.
The following interfaces are supported for sFlow:
| Interfaces | 5 Tuple | Nodes | Ingress | Egress | Path | Comments |
|---|---|---|---|---|---|---|
|
Routed Interface |
Yes |
Yes |
Yes |
Yes |
Yes |
Ingress node is shown in path |
Guidelines and limitations for sFlow
-
Nexus Dashboard supports sFlow with Cisco Nexus 3000 series switches.
-
It is recommended to enable Flow Telemetry if it is available for your configuration. If it is not available for your configuration, use Netflow. If Netflow, is not available for your configuration, then use sFlow.
-
For sFlow, Nexus Dashboard requires the configuration of persistent IPs under cluster configuration, and 6 IPs in the same subnet as the data network are required.
-
sFlow configurations will not be pushed. However, if a fabric is managed, the software sensors will be pushed.
-
If you manually configure the fabric to use with Nexus Dashboard and sFlow support, the Flows Exporter port changes from 30000 to 5640. To prevent a breakage of the Flows Exporter, adjust the automation.
-
Nexus Dashboard does not support sFlow in the following Cisco Nexus 3000 Series switches:
-
Cisco Nexus 3600-R Platform Switch (N3K-C3636C-R)
-
Cisco Nexus 3600-R Platform Switch (N3K-C36180YC-R)
-
Cisco Nexus 3100 Platform Switch (N3K-C3132C-Z)
-
-
Nexus Dashboard does not support sFlow in the following Cisco Nexus 9000 Series fabric modules:
-
Cisco Nexus 9508-R fabric module (N9K-C9508-FM-R)
-
Cisco Nexus 9504-R fabric module (N9K-C9504-FM-R)
-
-
To configure sFlow on fabric switches, see the Configuring sFlow section in the Cisco Nexus 9000 Series NX-OS System Management Configuration Guide.
Configure sFlow telemetry
Prerequisites
Follow these steps to configure sFlow telemetry.
-
Navigate to the Telemetry page for your LAN or IPFM fabric.
-
Click the Flow collection tab on the Telemetry page.
-
In the Mode area, make the following choices:
-
Choose sFlow.
-
Choose Flow Telemetry.
-
-
Click Save.
Microburst
In a Cisco ACI fabric, the microburst monitoring feature allows you to monitor traffic to detect unexpected data bursts within a very small time window (microseconds). This allows you to detect traffic in the network that are at risk for data loss and for network congestion.
Based on the percentage of a threshold, a microburst is either low, high, or medium. The percentage of a threshold is inverse to the sensitivity. When the number of microbursts are greater than 100 on a particular interface, an anomaly is raised. Nexus Dashboard collects the microburst data for the selected fabrics. Microburst anomalies are raised on the interface of the node.
To learn more about microburst monitoring, see:
-
See Inventory to view microburst information on Nexus Dashboard.
Microburst monitoring thresholds
This table provides the microburst monitoring thresholds.
| Sensitivity | Up threshold | Down threshold |
|---|---|---|
|
Low |
75% |
50% |
|
Medium |
50% |
25% |
|
High |
25% |
5% |
Configure microburst monitoring
In a Cisco ACI fabric, follow these steps to configure microburst:
-
Navigate to the Telemetry page for your LAN or IPFM fabric.
-
Click the Microburst tab in the Telemetry page.
-
Click Enable Microburst sensitivity to enable this feature.
-
Click the drop-down menu for Microburst sensitivity level.
The default value is Disable. Choose the appropriate value that you want to configure.
-
High Sensitivity,
-
Medium Sensitivity, or
-
Low Sensitivity.
-
External streaming
The External streaming tab in Nexus Dashboard allows you export data that Nexus Dashboard collects over Kafka, email, and syslog. Nexus Dashboard generates data such as advisories, anomalies, audit logs, faults, statistical data, and risk and conformance reports. When you configure a Kafka broker, Nexus Dashboard writes all data to a topic. By default, the Nexus Dashboard collects export data every 30 seconds or at a less frequent interval.
For ACI fabrics, you can also collect data for specific resources (CPU, memory, and interface utilization) every 10 seconds from the leaf and spine switches using a separate data pipeline. To export this data, select the Usage option under Collection Type in the Message bus export settings. Additionally, CPU and memory data is collected for the controllers.
Nexus Dashboard does not store the collected data in Elasticsearch; instead, it exports the data directly to your repository or data lake using a Kafka broker for consumption. By using the Kafka export functionality, you can then export this data to your Kafka broker and push it into your data lake for further use.
You can configure an email scheduler to define the type of data and the frequency at which you want to receive information via email. You can also export anomaly records to an external syslog server. To do this, select the Syslog option under the External Streaming tab.
Configure external streaming settings
Follow these steps to configure external streaming settings.
-
Navigate to the Fabrics page.
Go to Manage > Fabrics.
-
Choose the fabric for which you configure streaming settings.
-
From the Actions drop-down list, choose Edit fabric settings.
The Edit fabric-name settings page displays.
You can also access the Edit fabric-name settings page for a fabric from the Fabric Overview page. In the Fabric Overview page, click the Actions drop-down list and choose Edit fabric settings.
-
In the Edit fabric-name settings page, click the External streaming tab.
You can view these options.
-
Email
-
Message bus
-
Syslog
-
Guidelines and limitations
-
Intersight connectivity is required to receive the reports by email.
-
You can configure up to five emails per day for periodic job configurations.
-
A maximum of six exporters is supported for export across all types of exporters including email, message bus, and syslog. You must provide unique names for each export.
-
The scale for Kafka exports is increased to support up to 20 exporters per cluster. However, statistics selection is limited to any six exporters.
-
Before configuring your Kafka export, you must add the external Kafka IP address as a known route in your Nexus Dashboard cluster configuration and verify that Nexus Dashboard can reach the external Kafka IP address over the network.
-
The anomalies in Kafka and email messages include categories such as Resources, Environmental, Statistics, Endpoints, Flows, and Bugs.
-
Export data is not supported for snapshot fabrics.
-
You must provide unique names for each exporter, and they may not be repeated between Kafka export for Alerts and Events and Kafka export for Usage.
-
Nexus Dashboard supports Kafka export for flow anomalies. However, Kafka export is not currently supported for flow Event anomalies.
Guidelines and limitations in NX-OS fabrics
-
Remove all configurations in the Message Bus Configuration and Email page before you disable Software Telemetry on any fabric and remove the fabric from Nexus Dashboard.
-
If you use interface groups while enabling PTP in an Enhanced Classic LAN fabric, you must add the following commands to the freeform section of the interface group.
-
ttag -
ttag-stripIf you do not add these commands, endpoints connected behind these interfaces will experience traffic loss.
-
The email scheduler feature in Nexus Dashboard automates the distribution of summarized data collected from Nexus Dashboard. It allows customization of selection of email recipients, choice of email format, scheduling frequency settings, and configuring the types of alerts and reports.
To configure email at the system settings level, see the section "Email" in Working with System Settings.
Follow these steps to configure an email scheduler.
-
Navigate to the Fabrics page.
Go to Manage > Fabrics.
-
Choose the fabric for which you configure streaming settings.
-
From the Actions drop-down list, choose Edit fabric settings.
The Edit fabric-name settings page displays.
-
In the Edit fabric-name settings page, click the External streaming tab.
-
Click the Email tab.
-
Review the information provided in the Email tab for already-configured email configurations.
The following details display under Email tab.
| Field | Description |
|---|---|
|
Name |
The name of the email configuration. |
|
|
The email addresses used in the email configuration. |
|
Start time |
The start date used in the email configuration. |
|
Frequency |
The frequency in days or weeks set in the email configuration. |
|
Anomalies |
The severity level for anomalies and advisories set in the email configuration. |
|
Advisories |
|
|
Risk and conformance reports |
The status of the overall inventory for a fabric, including software release, hardware platform, and a combination of software and hardware conformance. |
To add a new email configuration, click Add email in the Email page.
-
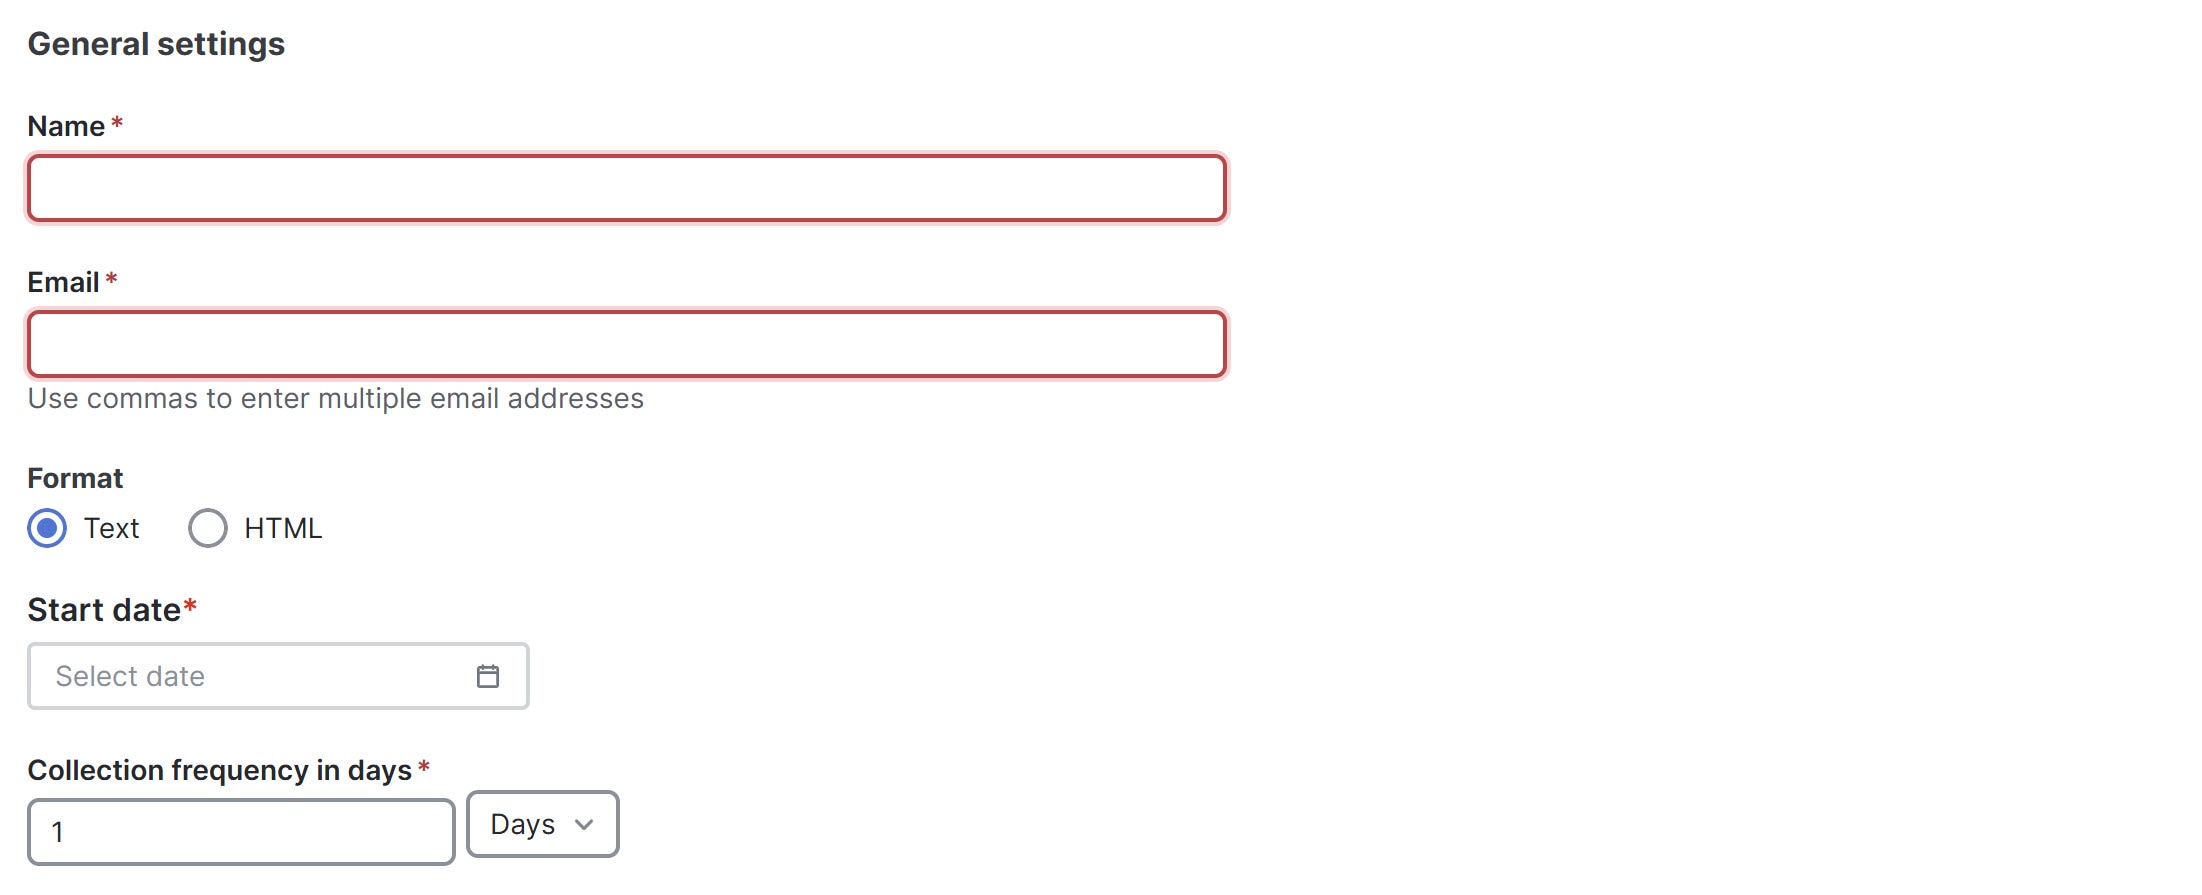
Follow these steps to configure General Settings.
-
In the Name field, enter the name of the email scheduler.
-
In the Email field, enter one or more email addresses separated by commas.
-
In the Format field, choose Text or HTML email format.
-
In the Start date field, choose the start date when the scheduler should begin sending emails.
-
In the Collection frequency in days field, specify how often the summary is sent, you can choose days or weeks.
-
-
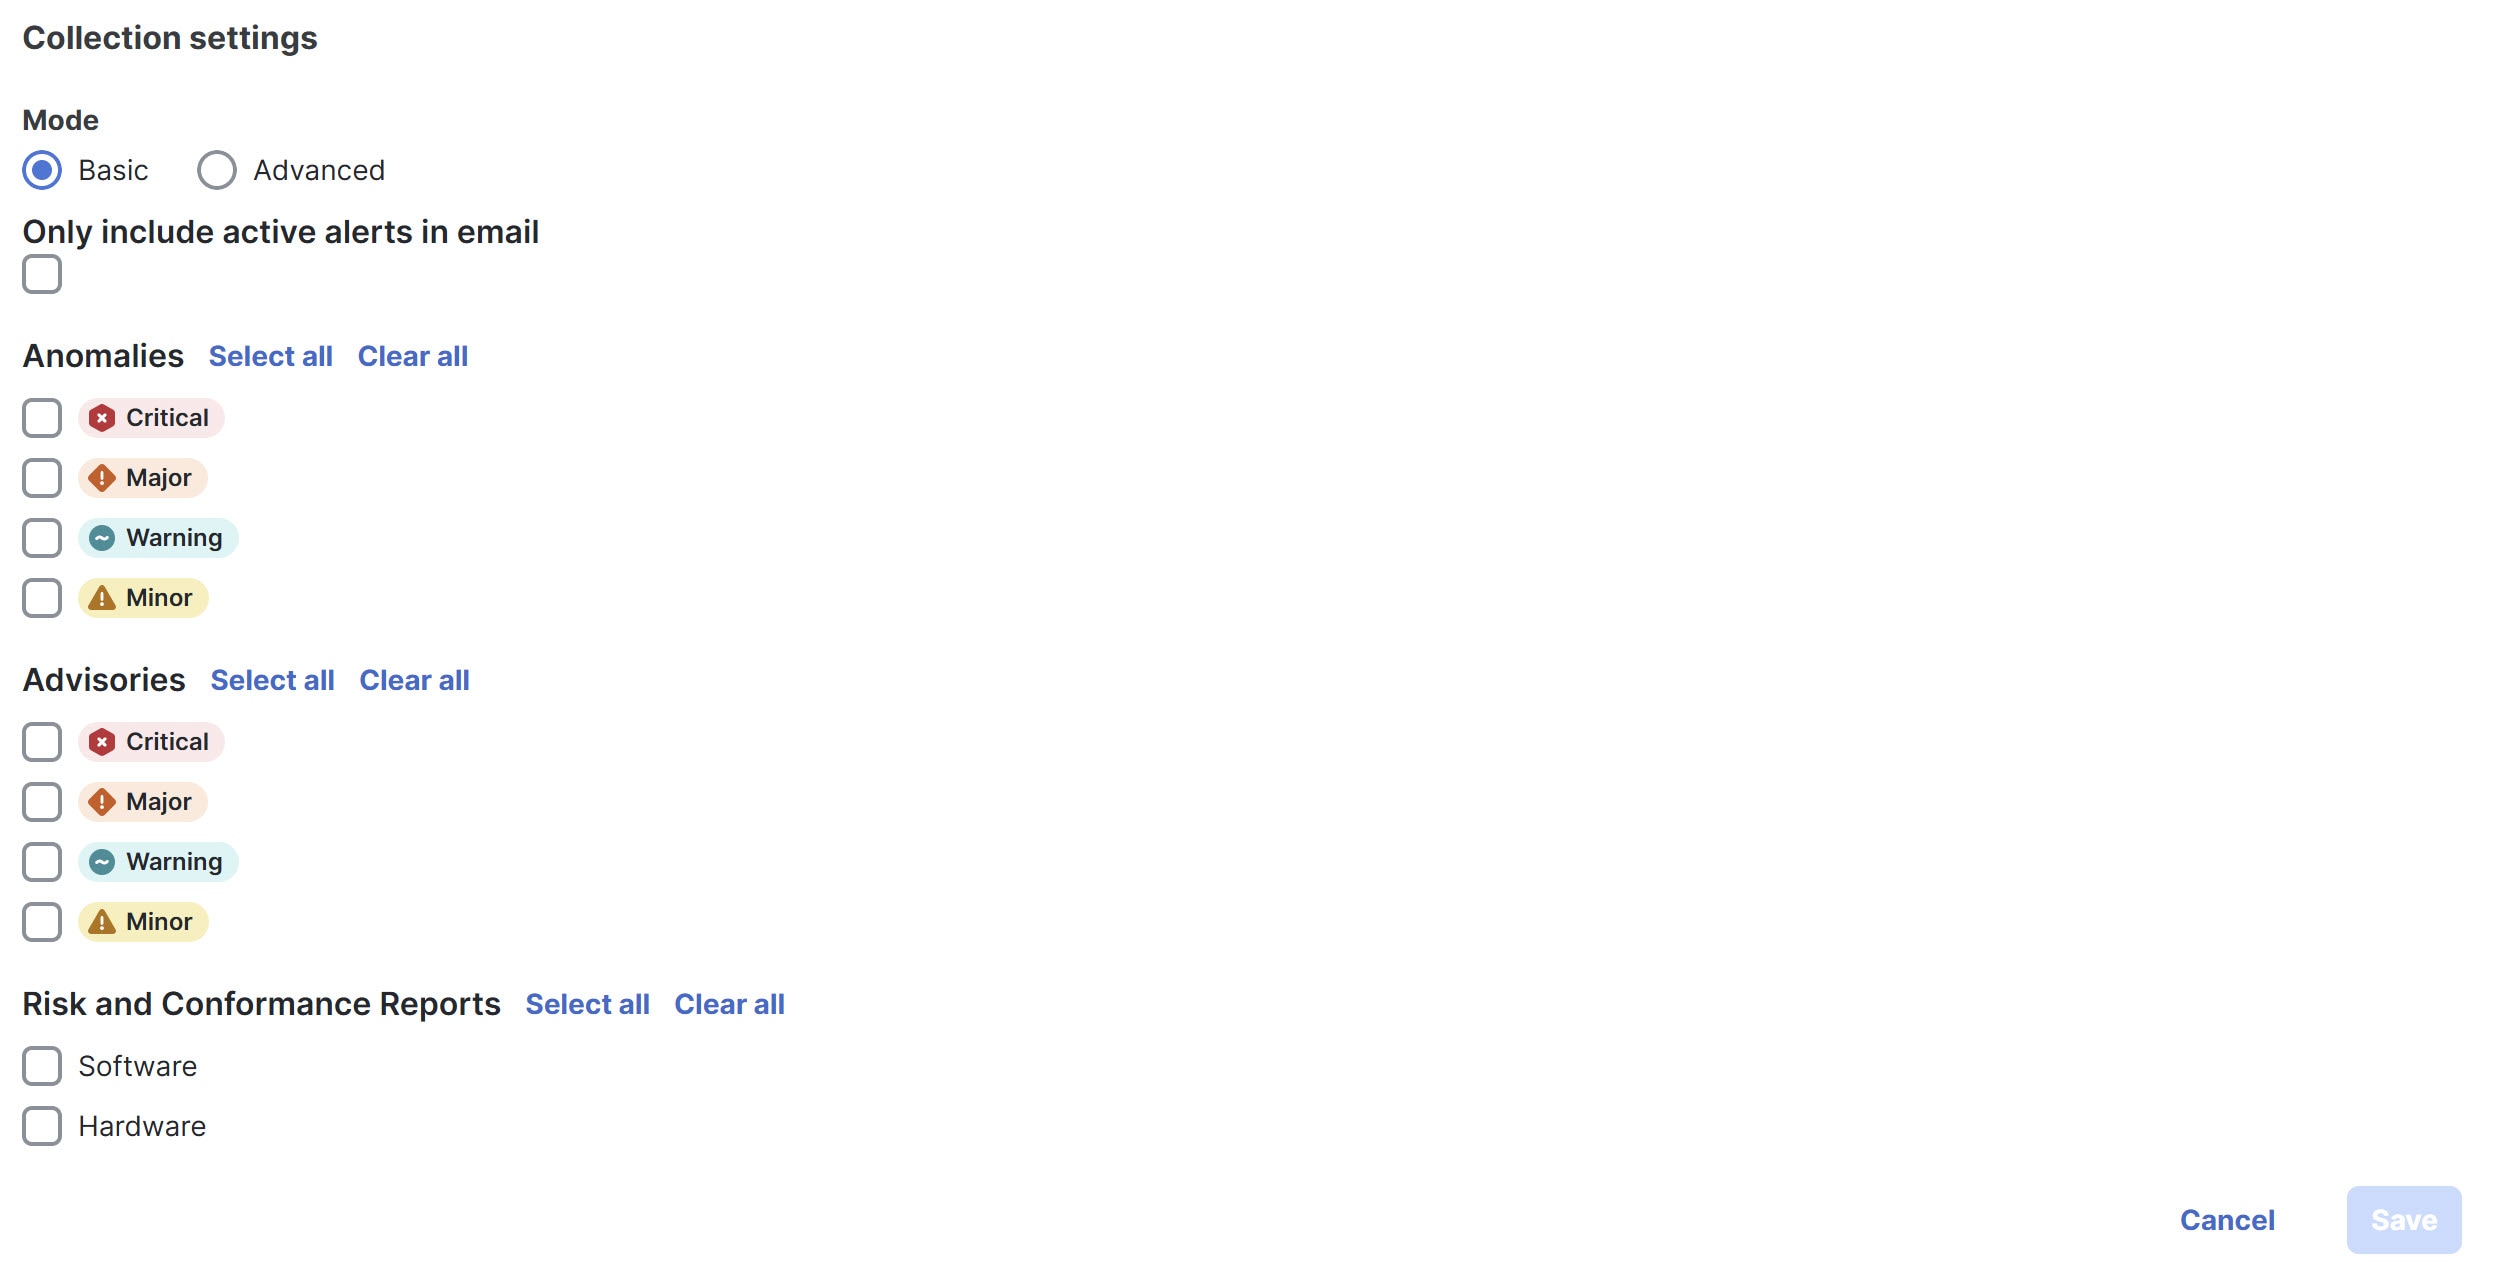
Follow these steps to configure Collection Settings.
-
In the Mode field, choose one of the following modes.
-
Basic — displays the severity levels for anomalies and advisories.
-
Advanced — displays the categories and severity levels for anomalies and advisories.
-
-
Check the Only include active alerts in email check box, to include only active anomaly alerts.
-
Under Anomalies choose the categories and severity levels for the anomalies.
-
Under Advisories choose the categories and severity levels for the advisories.
-
Under Risk and Conformance Reports, choose from the following options.
-
Software
-
Hardware
-
-
-
Click Save.
The Email area displays the configured email schedulers.
You will receive an email about the scheduled job on the provided Start Date and at the time provided in the Collection frequency in days field. The subsequent emails follow after Collect Every frequency expires. If the provided time is in the past, Nexus Dashboard will send you an email immediately and trigger the next email after the duration from the provided start time expires.
Message bus
Add Kafka broker configuration
Follow these steps to configure the message bus and add kafka broker.
-
Configure the message bus at the System Settings level.
-
Navigate to Admin > System Settings > General.
-
In the Message bus configuration area, click Edit.
The Message bus configuration dialog box opens.
-
Click Add message bus configuration.
The Add message bus configuration dialog box opens.
-
In the Name field, enter a name for the configuration.
-
In the Hostname/IP address and Port fields, enter the IP address of the message bus consumer and the port that is listening on the message bus consumer.
-
In the Topic name field, enter the name of the Kafka topic to which Nexus Dashboard must send the messages.
-
In the Mode field, choose the security mode.
The supported modes are Unsecured, Secured SSL and SASLPLAIN. The default value is Unsecured.
-
For Unsecured, no other configurations are needed.
-
For Secured SSL, fill out the following field:
Client certification name — The System Certificate name configured at the Certificate Management level. The CA certificate and System Certificate (which includes Client certificate and Client key) are added at the Certificate Management level.
Refer to Step 2 for step-by-step instructions on managing certificates. Navigate to Admin > Certificate Management to manage the following certificates:
-
CA Certificate — The CA certificate used for signing consumer certificate, which will be stored in the trust-store so that Nexus Dashboard can trust the consumer.
-
Client Certificate — The CA signed certificate for Nexus Dashboard. The certificate is signed by the same CA, and the same CA certificate will be in the truststore of the consumer. This will be stored in Nexus Dashboard’s Kafka keystore that is used for exporting.
-
Client Key — A private key for the Kafka producer, which is Nexus Dashboard in this case. This will be stored in Nexus Dashboard’s Kafka keystore that is used for exporting.
-
-
For SASLPLAIN, fill out these fields:
-
Username — The username for the SASL/PLAIN authentication.
-
Password — The password for the SASL/PLAIN authentication.
-
-
-
Click Save
-
-
Add CA certificates and System certificates at the Certificate Management level.
-
Navigate to Admin > Certificate Management.
-
In the Certificate management page, click the CA Certificates tab, then click Add CA certificate.
The fields in the CA Certificates tab are described in the following table.
Field Description Certificate name
The name of the CA certificate.
Certificate details
The details of the CA certificate.
Attached to
The CA signed certificate attached to Nexus Dashboard.
Expires on
The Expiry date and time of the CA certificate.
Last updated time
The last updated time of the CA certificate.
-
In the Certificate management page, click the System certificates tab, then click Add system certificate to add Client Certificate and Client key. Note that the Client certificate and Client key should have same names except extensions as .cer/.crt/.pem for Client certificate and .key for Client key.
You must add a valid CA Certificate before adding the corresponding System Certificate.
The fields in the System Certificates tab are described in the following table.
Field Description Certificate name
The name of the Client certificate.
Certificate details
The details of the Client certificate.
Attached to
The feature to which the system certificate is attached to, in this case, the message bus.
Expires on
The Expiry date and time of the CA certificate.
Last updated time
The last updated time of the CA certificate.
To configure message bus, the System Certificate should be attached to message bus feature.
-
To attach a System Certificate to the message bus feature:
-
Choose the System Certificate that you want to use and click the ellipses (…) on that row.
-
Choose Manage Feature Attachments from the drop-down list.
The Manage Feature Attachments dialog box opens.
-
In the Features field, choose messageBus.
-
Click Save.
For more information on CA certificates, see Managing Certificates in your Nexus Dashboard.
Configure Kafka exports in fabric settings
-
Navigate to the External streaming page for your fabric.
-
Navigate to the Fabrics page.
Go to Manage > Fabrics.
-
Choose the fabric for which you configure streaming settings.
-
From the Actions drop-down list, choose Edit fabric settings.
The Edit fabric-name settings page displays.
-
In the Edit fabric-name settings page, click the External streaming tab.
-
Click the Message bus tab.
-
-
Review the information provided in the Message bus tab for already-configured message bus configurations, or click Add message bus to add a new message bus configuration.
Skip to Step 3 if you are adding a message bus.
The fields in the Message bus tab are described in the following table.
Field Description Message bus stream
The name of the message bus stream configuration.
Collection type
The collection type used by the message bus stream.
Mode
The mode used by the message bus stream.
Anomalies
The severity level for anomalies and advisories set in the message bus stream configuration.
Advisories
Statistics
The statistics that were configured for the message bus stream.
Faults
The severity level for faults set in the message bus stream configuration.
Audit Logs
The audit logs that were configured for the message bus stream.
-
To configure a new message bus stream, in the Message bus page, click Add message bus.
-
In the Message bus stream field, choose the message bus stream that you want to edit.
-
In the Collection Type area, choose the appropriate collection type.
Depending on the Collection Type that you choose, the options displayed in this area will change.
-
Alerts and events: This is the default setting. Continue to Step 7, if you choose Alerts and events.
-
Usage: In the Collection settings area, under Data, the Resources, and Statistics for the collection settings are displayed. By default, the data for CPU, Memory, and Interface Utilization are collected and exported. You cannot choose to export a subset of these resources.
Usage is applicable only for ACI Fabrics. This option is disabled for other fabrics.
-
-
Click Save. The configured message bus streams are displayed in the Message bus area. This configuration now sends immediate notification when the selected anomalies or advisories occur.
-
If you choose Alerts and events as the Collection Type, in the Mode area, choose either Basic or Advanced.
The configurations that are available in each collection settings section might vary, depending on the mode that you set.
-
Determine which area you want to configure for the message bus stream.
The following areas appear in the page:
After you complete the configurations on this page, click Save. Nexus Dashboard displays the configured message bus streams in the Message bus area. This configuration now sends immediate notification when the selected anomalies or advisories occur.
Anomalies
-
If you chose Basic in the Mode area, choose one or more of the following severity levels for anomaly statistics that you want to configure for the message bus stream:
-
Critical
-
Major
-
Warning
-
Minor
Or click Select all to select all available statistics for the message bus stream.
-
-
If you chose Advanced in the Mode area:
-
Choose one or more of the following categories for anomaly statistics that you want to configure for the message bus stream:
-
Active Bugs
-
Capacity
-
Compliance
-
Configuration
-
Connectivity
-
Hardware
-
Integrations
-
System
-
-
Choose one or more of the following severity levels for anomaly statistics that you want to configure for the message bus stream:
-
Critical
-
Major
-
Warning
-
Minor
Or click Select all to select all available categories and statistics for the message bus stream.
-
For more information on anomaly levels, see Detecting Anomalies and Identifying Advisories in Your Nexus Dashboard.
-
Advisories
-
If you chose Basic in the Mode area, choose one or more of the following severity levels for advisory statistics that you want to configure for the message bus stream:
-
Critical
-
Major
-
Warning
-
Minor
Or click Select all to select all available statistics for the message bus stream.
-
-
If you chose Advanced in the Mode area:
-
Choose one or more of the following categories for advisory statistics that you want to configure for the message bus stream:
-
Best Practices
-
Field Notices
-
HW end-of-life
-
SW end-of-life
-
PSIRT
-
-
Choose one or more of the following severity levels for advisory statistics that you want to configure for the message bus stream:
-
Critical
-
Major
-
Warning
-
Minor
Or click Select all to select all available categories and statistics for the message bus stream.
-
For more information on advisory levels, see Detecting Anomalies and Identifying Advisories in Your Nexus Dashboard.
-
Statistics
There are no differences in the settings in the Statistics area when you choose Basic or Advanced in the Mode area.
Choose one or more of the following categories to configure the statistics you want to stream over the message bus.
-
Interfaces — streams statistics related to network interfaces, such as traffic volume, error rates, and interface status.
-
Protocol — streams protocol-specific statistics, including packet counts, protocol errors, and handshake success rates.
-
Resource Allocation — streams data about system resources, such as CPU usage, memory consumption, and bandwidth allocation.
-
Environmental — streams environmental metrics such as temperature, humidity, and power supply status.
-
Endpoints — streams statistics about connected endpoints, including connection status, data throughput, and session durations.
Faults
There are no differences in the settings in the Faults area when you choose Basic or Advanced in the Mode area.
Choose one or more of the following severity levels for fault statistics that you want to configure for the message bus stream:
-
Critical
-
Major
-
Minor
-
Warning
-
Info
Audit Logs
There are no differences in the settings in the Audit Logs area when you choose Basic or Advanced in the Mode area.
Choose one or more of the following categories for audit logs that you want to configure for the message bus stream:
-
Creation
-
Deletion
-
Modification
Syslog
Nexus Dashboard supports the export of anomalies in syslog format. You can use the syslog configuration feature to develop network monitoring and analytics applications on top of Nexus Dashboard, integrate with the syslog server to get alerts, and build customized dashboards and visualizations.
After you choose the fabric where you want to configure the syslog exporter and set up the syslog export configuration, Nexus Dashboard establishes a connection with the syslog server and sends data to the syslog server.
Nexus Dashboard exports anomaly records to the syslog server. With syslog support, you can export anomalies to your third-party tools even if you do not use Kafka.
Guidelines and limitations for syslog
If the syslog server is not operational at a certain time, messages generated during that downtime will not be received by a server after the server becomes operational.
Add syslog server configuration
Follow these steps to add syslog server configuration.
-
Navigate to Admin > System Settings > General.
-
In the Remote streaming servers area, click Edit.
The Remote streaming servers page displays.
-
Click Add server.
The Add server page displays.
-
Choose the Service as Syslog.
-
Choose the Protocol.
You have these options.
-
TCP
-
UDP
-
-
In the Name field, provide the name for the syslog server.
-
In the Hostname/IP address field, provide the hostname or IP address of the syslog server.
-
In the Port field, specify the port number used by the syslog server.
-
If you want to enable secure communication, check the TLS check box.
Before you enable TLS you must upload the CA certificate for the syslog destination host to Nexus Dashboard. For more information see, Upload a CA certificate.
Configure syslog to enable exporting anomalies data to a syslog server
Follow these steps to configure syslog to enable exporting anomalies data to a syslog server.
-
Navigate to the Fabrics page.
Go to Manage > Fabrics.
-
Choose the fabric for which you configure streaming settings.
-
From the Actions drop-down list, choose Edit fabric settings.
The Edit fabric-name settings page displays.
-
In the Edit fabric-name settings page, click the External streaming tab.
-
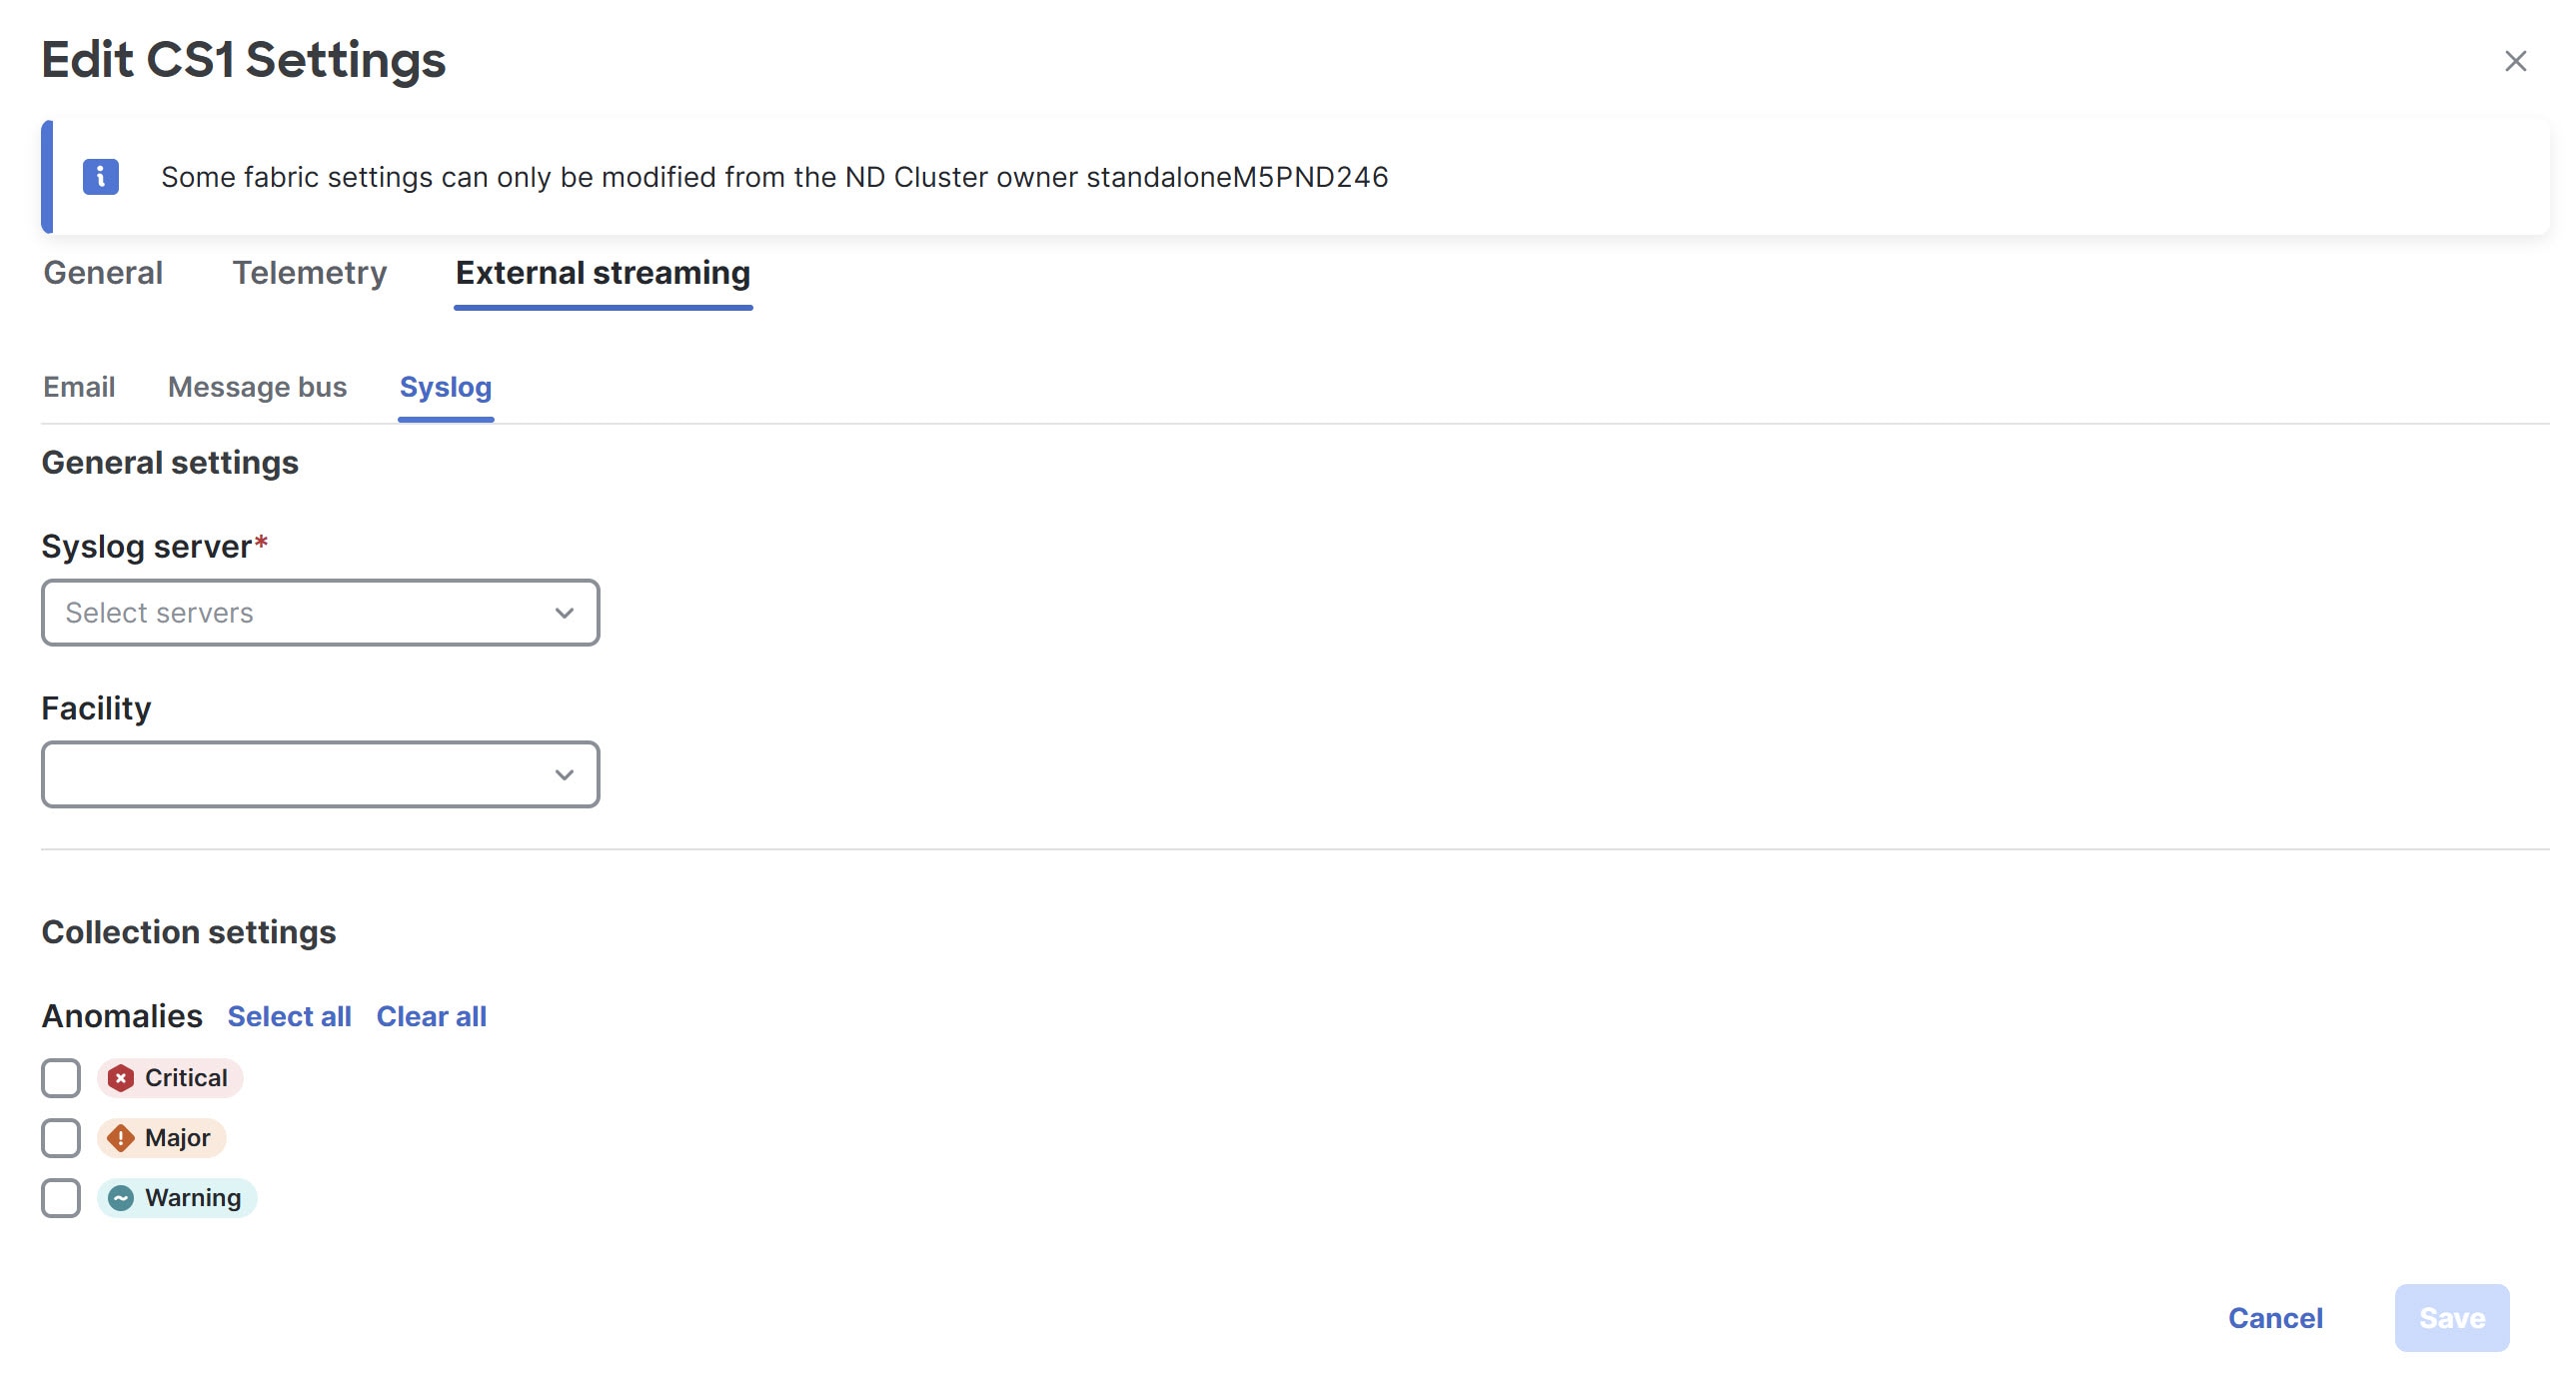
Click the Syslog tab.
The following details display under Syslog tab.
-
Make the necessary configurations in the General settings area.
-
In the Syslog server drop down list, choose a syslog server.
The Syslog server drop down list displays the syslog servers that you added in the System Settings level. For more information, see Add syslog server configuration.
-
In the Facility field, from the drop-down list, choose the appropriate facility string.
A facility code is used to specify the type of system that is logging the message. For this feature, the local0-local7 keywords for locally used facility are supported.
-
-
In the Collection settings area, choose the desired severity options.
The options available are Critical, Major, and Warning.
-
Click Save.
Upload a CA certificate
Follow these steps to upload a CA certificate for syslog server TLS.
-
Navigate to Admin > Certificate Management.
-
In the Certificate management page, click the CA certificates tab, then click Add CA certificate.
You can upload multiple files at a single instance.
-
Browse your local directory and choose the certificate-key pair to upload.
You can upload certificates with the
.pem/.cer/.crt/file extensions. -
Click Save to upload the selected files to Nexus Dashboard.
A successful upload message appears. The uploaded certificates are listed in the table.