
New and changed information
The following table provides an overview of the significant changes up to this current release. The table does not provide an exhaustive list of all changes or of the new features up to this release.
| Release Version | Feature | Description |
|---|---|---|
|
Nexus Dashboard 4.1.1 |
Improved fabric creation navigation and workflow |
Beginning with Nexus Dashboard 4.1.1, the navigation and workflow used to create Nexus Dashboard fabrics have been enhanced. |
|
Nexus Dashboard 4.1.1 |
Alerts suspend mode |
Beginning with Nexus Dashboard 4.1.1, Nexus Dashboard allows you to place a fabric in alert suspend mode. Nexus Dashboard does not display any new anomalies or advisories generated for that fabric in the Fabric Overview page. For more information see, Alerts suspend mode for anomalies and advisories. |
Mapping fabric types
This table provides mapping information between the fabric types that existed in releases prior to the unified Nexus Dashboard product and the new fabric types available with the unified Nexus Dashboard product.

In some cases, a pre-unification fabric type might not be available as a new deployment type and can only be onboarded into Nexus Dashboard. Those fabric types are marked as "Brownfield onboard only" in this table.
|
Pre-unification fabrics |
Post-unification fabric types |
|
|
Fabric technologies |
Fabric types |
|
|
LAN |
||
|
VXLAN EVPN |
Data Center VXLAN EVPN |
|
|
eBGP VXLAN EVPN |
BGP fabric |
|
|
VXLAN EVPN |
Campus VXLAN EVPN |
|
|
eBGP Routed |
BGP fabric |
|
|
Classic LAN |
Enhanced Classic LAN |
|
|
Classic LAN |
Classic LAN |
Legacy Classic LAN (Brownfield onboard only) |
|
Custom |
External connectivity network |
|
|
Custom |
Custom network |
|
|
Custom |
Multi-site external network |
|
|
LAN Monitor |
LAN Monitor |
|
|
VXLAN EVPN |
VXLAN EVPN Multi-Site |
|
|
Multi-Fabric Domain |
Fabric Group |
|
|
IPFM |
||
|
IPFM |
IPFM |
|
|
IPFM |
IPFM Classic |
|
|
Generic Multicast |
IPFM Classic |
|
|
Multi-Fabric Domain |
Fabric Group |
|
Understanding all your Nexus Dashboard fabrics at a glance
Navigate to the Fabrics page
The Fabrics page allows you to view, create, delete, and modify fabrics and fabric groups.
Follow these steps to navigate to the Fabrics page.
-
Go to Manage > Fabrics.
The Fabrics page displays.
-
Click the Fabrics tab.
The Fabrics table displays information on all configured fabrics.
| Field | Description |
|---|---|
|
Name |
Displays the name of the fabric. |
|
Type |
Displays the type of the fabric. |
|
Anomaly level |
Displays the anomaly level of the fabric. Anomalies are classified into these levels.
|
|
Advisory level |
Displays the advisory level of the fabric. Advisories are classified into these levels.
|
|
License tier |
Displays the license tier for the software features that is being used in the fabric. |
|
ASN |
Displays the ASN for the fabric. |
If you want to modify the columns shown in the table, click the gear icon at the top right of the table. From the Table Configuration drawer choose the columns that you want to display in the table.
You can view these options.
-
Connectivity status
-
Software version
-
Fabric group
-
Features
You can also perform these actions from the Actions drop-down list in the Fabrics page.
| Action | Description |
|---|---|
|
Actions > Create fabric |
Click Actions > Create fabric to create a new fabric. For more information, see Creating LAN and ACI Fabrics and Fabric Groups. |
|
Actions > Edit Fabric Settings |
Choose a fabric to edit, then click Actions > Edit Fabric Settings.
|
|
Actions > Delete fabric |
Choose a fabric to delete, then click Actions > Delete fabric. Click Confirm to delete the fabric. |
|
Actions > Re-register |
Click Actions > Re-register to re-register a fabric if there are changes to the public IP address. |
Understanding a single Nexus Dashboard fabric at a glance
-
Navigate to the main Fabrics window.
Manage > Fabrics
-
Locate the fabric that you want information on.
-
To view all configured local online fabrics, click Local > Online fabrics.
-
To view all configured remote fabrics, click Remote.
-
-
Single-click on the fabric that you want information on.
The Summary window for that fabric appears, with the Overview tab selected by default.
-
View the necessary information in the various tiles in the Overview tab.
Anomaly level
Nexus Dashboard proactively detects different types of anomalies across the network, analyzes the anomalies, and identifies remediation methods. The Anomaly level tile provides a status of your anomaly levels and a list of your top anomaly categories.
Nexus Dashboard monitors different sets of data from all nodes in the fabric and baselines the data to identify “normal” behavior. Any deviation is represented as an anomaly. Your time is better spent in resolving the issue instead of tracking the issue. Additionally, it can estimate the impact of the anomaly and generate a recommendation depending on the nature of the anomaly and thus reducing the Mean Time to Troubleshooting and Resolution (MTTR).
Click in the Anomaly level tile to navigate directly to the Anomalies tab in the Summary window. See [Anomalies] for more information.
Advisory level
Nexus Dashboard identifies field notices, software and hardware end-of-life and end-of-sale announcements, as well as PSIRTs that can potentially impact the network fabrics that it is monitoring, and generate advisories. Advisories provides recommendations to keep your network under support and running in optimal conditions. The Advisory level tile provides a status of your advisory levels and a list of your top advisory categories.
Click in the Advisory level tile to navigate directly to the Advisories tab in the Summary window. See [Advisories] for more information.
Recent activity
The Recent activity tile provides a summary of the most recent changes that have occurred in this fabric (for example, if you deleted an interface on a switch in the fabric). Click View all to navigate directly to the History tab in the Summary window. See [History] for more information.
General
The General tile provides a summary of this information for the fabric.
| Field | Description |
|---|---|
|
Fabric name |
Provides the name of the fabric. |
|
Type |
Provides the type of fabric. |
|
License tier |
Provides the license tier used by the fabric. Click the entry to bring up a slide-in pane that provides additional information on the license tiers and the features that are enabled in each license tier. |
|
BGP ASN |
Provides the BGP ASN of the fabric. |
|
Security domain |
Provides the security domain used by the fabric. |
|
Fabric group |
If the fabric is a member of a fabric group, this field shows the fabric group that the fabric belongs to. Click the fabric group name to navigate directly to the Summary page for that fabric group. |
|
Config-sync status |
Provides the fabric status ( |
|
Telemetry status |
Provides insights into the health and performance of the switches and devices in your network. The different telemetry collection statuses at the fabric level include:
Hover over the status to display a pop-up with a summary of the number of switches in the fabric that are sending software telemetry information to Nexus Dashboard. Click the status to bring up a slide-in pane that provides additional information on the software telemetry status for the fabric and for the switches in the fabric. In the slide-in pane, with the Fabric tab selected, click Actions to perform the following actions:
|
|
Switches software version |
Provides the software versions on the switches in the fabric.
|
Inventory
In the Inventory tile, you can view the summary of the controllers and switches for the fabric.
Click View hardware resources to view the hardware resources for the fabric. Click and choose a resource from the Top Controllers By drop-down list to see a graph for that resource. In the table that follows, see the resource usage by switch. Click the switch name to view additional details.
Click View capacity to view the different resources with their maximum capacity and current usage.
-
Fabric summary shows you the trends for the week, as well as the capacity by resource for the entire fabric. You see the number of resources used out of the total available capacity for each resource in this fabric (for example, Bridge Domains 2829 of 15000). The percentage indicates the percentage of resource used.
-
Switches summary displays the capacity breakout of resources by switch. The graph shows you the timeline for the parameter that you have chosen from the Top Switches By drop-down list. In the table, click Operational Resources, Configuration Resources, or Hardware Resources to see the capacity and usage for each switch in the fabric.
The Inventory tile also provides this additional information.
-
Number of switches in the fabric. Click this box to navigate directly to Inventory > Switches for this fabric.
-
Number of vPC pairs in the fabric. Click this box to navigate directly to Inventory > vPC pairs for this fabric.
-
Number of other devices in the fabric. Click this box to navigate directly to Inventory > Other devices for this fabric.
Interfaces
In the Interfaces tile, you can see the summary of the interfaces for the fabric, including the number of switches that are in the Up, Down, or Admin Down state.
-
Click Physical to show only physical interfaces, or click All to show physical and virtual interfaces.
-
Click View physical interface statistics to bring up a slide-in pane that provides statistics information for the physical interfaces.
-
In the Top 10 interfaces by area, choose if you want to show the top 10 interfaces by traffic, bandwidth, or congestion. You can also set the time selection in that area.
-
Click the down arrow for other interfaces listed in this slide-in pane to view the same information for other interfaces.
-
-
Click the link for the total number of interfaces in the fabric to navigate directly to Connectivity > Interfaces for this fabric. This provides additional details such as Anomaly Level, Admin Status, Operational Status, and Interface Type. Click the interface name to view additional details.
Connectivity
In the Connectivity tile, you can view details about these areas related to this fabric.
-
Endpoints: Click the number of endpoints shown to navigate directly to Connectivity > Endpoints for this fabric.
-
Layer 3 (L3) neighbors: Click the number of L3 neighbors shown to navigate directly to Connectivity > L3 Neighbors for this fabric.
-
Inter-fabric connections
Segmentation and security
In the Segmentation and security tile, you can view details about these areas related to this fabric.
-
VRFs: Click the number of VRFs shown to navigate directly to Segmentation and security > VRFs for this fabric.
-
Security groups: Click the number of security groups shown to navigate directly to Segmentation and security > Security groups for this fabric.
-
Networks: Click the number of networks shown to navigate directly to Segmentation and security > Networks for this fabric.
Analytics summary
In the Analytics Summary tile, you can see an overview of the multiple analytics collected from across the fabric. It displays the status for these areas related to the fabric.
-
Conformance: Enables you to visualize and understand the lifecycle of your hardware and software in the network. This assists you in planning upgrades and hardware refresh. Conformance Report is generated everyday for each fabric for hardware and software conformance and weekly for each fabric for scale conformance. In the report you can view the conformance status of software, hardware, a combination of both software and hardware, and scale conformance status for fabrics.
Click the Conformance box to bring up a slide-in pane that provides conformance information in these areas.
-
Devices by hardware conformance status
-
Devices by software conformance status
-
Scale conformance status for fabrics or switches
Click View Conformance to navigate directly to Analysis Hub > Conformance.
-
-
Congestion: Measures network bandwidth utilization and quality of service (QoS) activation mechanisms to determine if a service is experiencing network congestion.
Click the Congestion box to bring up a slide-in pane that provides compliance information in these areas.
-
Summary: Displays the number of violations, the top rules by anomaly count, the anomalies from violations and the violations by rule type. Click on any of the rules in 'Top rules by Violation' to view more details and click the count under 'Number of anomalies from violations' to view the list of anomalies.
-
Anomalies from Violations: Lists all the anomalies that were triggered by the rules created. Click any rule in the 'Grouped' view to see the list of anomalies categorized under that group. If you click any rule in the 'Ungrouped' view, you are redirected to the compliance rule detail page. This can be listed in a group view for all fabrics or individual view for a specific fabric. The table lists the severity level of the anomaly, the type of rule that triggered the anomaly, the detection time, and the status.
-
Compliance rules: Shows a summary of the rules enforced and violated along with the number for each rule type. The table lists all the rules used to generate the current report. The table specifies whether it’s a configuration rule or a communication rule and the number of anomalies from violations for each rule.
Click View Conformance to navigate directly to Analysis Hub > Compliance.
-
-
Traffic analytics: Enables you to monitor your network’s latency, congestion, and drops.
Traffic Analytics automatically discovers services running in your network by matching well-known Layer 4 ports to their corresponding service endpoint categories. Nexus Dashboard then assesses service performance based on thresholds for the following metrics:
-
Latency: Measures the overall time in microseconds it takes a packet to go from one place to another.
-
Congestion: Measures network bandwidth utilization and quality of service (QoS) activation mechanisms to determine if a service is experiencing network congestion.
-
Drops: Measures the score or number of dropped packets versus transmitted packets considering factors such as CRC errors, faulty cables, and other devices.
Click the Traffic analytics box to bring up a slide-in pane that provides additional traffic analytics information.
Click View Analytics to navigate directly to Analysis Hub > Traffic Analytics.
-
-
Sustainability: Helps you monitor, predict, and improve your network’s energy usage, its related carbon emissions, and its total energy cost. The sustainability report enables you to get insights on energy utilization, CO2 emissions, and energy cost for all your fabrics on a monthly basis.
The report is generated by calculating the monthly values for Power Consumption and by summing the usage data across all of your devices at each of your fabrics for every single day in the chosen month. This data is then combined with the Cisco Energy Manager to provide greater insight into what that usage means in terms of energy cost, estimated emissions, and estimated switch power consumption. For more information about the Cisco Energy Manager, see Cisco Energy Manager.
Click the Sustainability box to bring up a slide-in pane that provides the sustainability report for your fabric.
Click View Sustainability to navigate directly to Analysis Hub > Sustainability.
External traffic
In the External Traffic tile, you can see the external traffic that the fabric has sent and received in the last seven days. The donut helps view the how much traffic is sent and received by the fabric. Click the information icon (i) to view more information about what external traffic is and how it can be measured for the different types of fabrics.
Click View external traffic box to bring up a slide-in pane that provides additional information on external traffic for your fabric.
Fabric analysis
Once your fabric is onboarded and fully prepared, will start the analysis to collect data from your fabric and display the fabric information in the Fabrics page. The Fabric Analysis banner displays the progress of the analysis. The time to run the analysis depends on the size of the fabric. After you onboard and fully prepare your fabric, Nexus Dashboard starts analyzing the fabric to collect data and display the fabric information in the Fabrics page. The Fabric Analysis banner shows the progress of the analysis. The time required to complete the analysis depends on the size of the fabric.
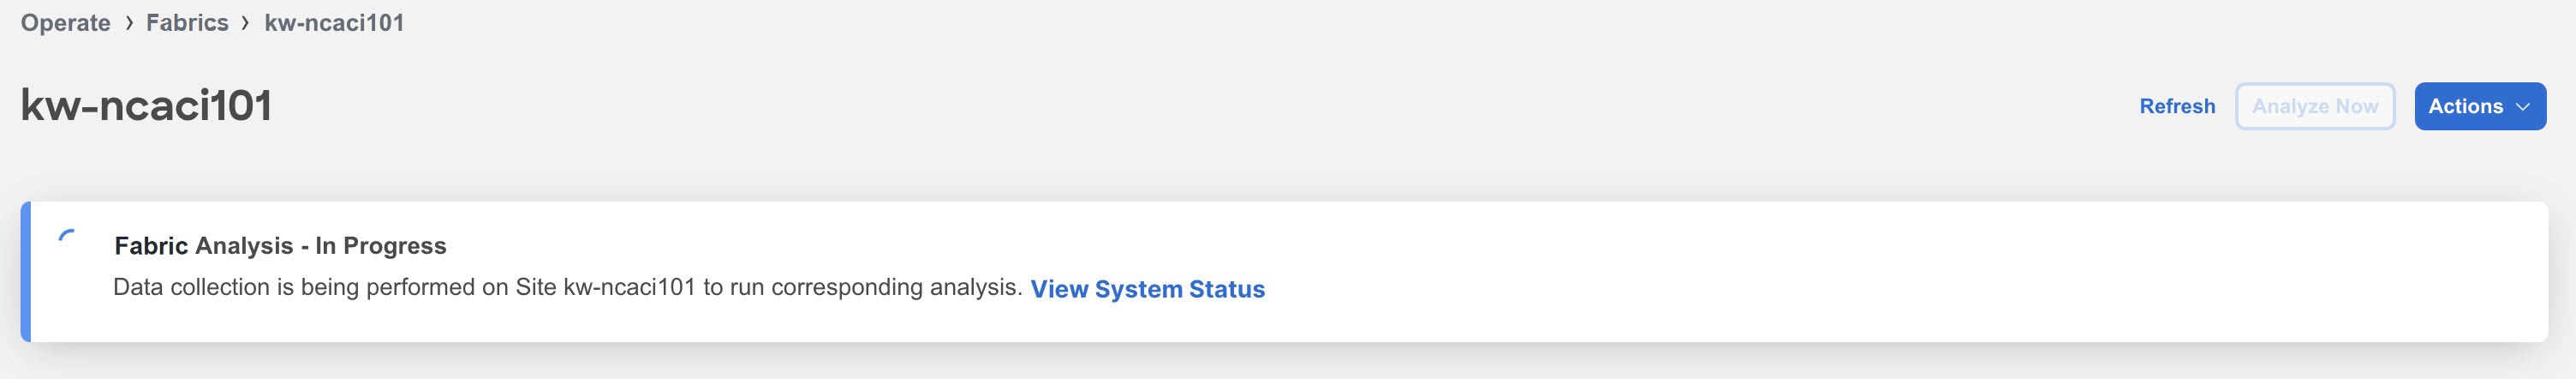
Click View System Status to view the status.
During fabric analysis, telemetry collection, assurance analysis, bug scan, and best practices analysis are carried out automatically. See Assurance analysis and Bug Scan in Analyzing and Troubleshooting Your Network.
The Actions drop-down list in the Fabrics page provides the following functionalities for managing and interacting with the fabric.
| Action | Description |
|---|---|
|
Edit Fabric Settings |
Allows you to modify the configuration settings of the fabric as needed. |
|
Add Switches |
Allows you to discover and add switches to a fabric. |
|
Recalculate and deploy |
Allows you to recalculate fabric policies and configurations, ensuring they are up-to-date and aligned with the desired state. Once recalculated, you can deploy these settings across the fabric. |
|
Configuration |
Allows you to define and manage the operational parameters of a fabric. |
|
Monitoring |
Allows you to oversee the performance and status of a fabric. You can click Analyze now to initiate a new analysis session. |
|
Maintenance |
Provides options to backup and restore a fabric. You can also suspend or resume alerts for the fabric, ensuring uninterrupted maintenance activities. For more information, see [Alert suspend mode for anomalies and advisories].
The suspend and resume alerts feature is available only for fabrics with Advantage and Premier license tiers and applicable to fabric management and telemetry anomalies. |
|
Telemetry |
Facilitates the configuration and collection of telemetry data for the fabric, aiding in detailed performance and operational insights. |
Assurance analysis
Assurance analysis involves collecting data from fabrics, running the analysis to create a model with the collected data, and generating the results.
-
Assurance analysis provides assurance in real time. During assurance analysis for online fabrics, the data collection, model generation, and results generation are carried out simultaneously. The collected data is analyzed immediately after collection followed by result generation. This is repeated after a fixed time interval or as specified by the user. For online fabrics, assurance analysis is performed automatically every 2 hours. The schedule is determined by the fabric size and scale. For larger fabrics, assurance analysis is performed automatically every 3-4 hours.
-
For snapshot fabrics, a one-time assurance is provided. This assurance analysis allows you to decouple the data collection stage from the analysis stage. The data is collected using a Python script and the collected data is then uploaded to Nexus Dashboard to provide a one-time assurance. The collected data can also be analyzed at a later time. It enables the user to collect the data during change management windows and then perform the analysis.
Assurance analysis guidelines and limitations
-
If you take the assurance analysis from a fabric and export the raw data set to upload a file to a Snapshot fabric, assurance analysis for the snapshot fabric will only generate assurance related anomalies.
-
Currently, if you begin an assurance analysis for a snapshot fabric, you can simultaneously continue to run the assurance analysis for online fabrics that are already in progress. They will all run without any disruption to the behavior.
-
Anomaly Rules and Compliance Rules are valid in assurance analysis for snapshot fabrics.
On-demand analysis
For online fabrics, assurance analysis is performed automatically, but you can also choose to request one at any time. This may be useful in cases where you resolve one or more issues in a fabric and would like Nexus Dashboard to poll the latest Anomalies and Advisories information without waiting for the next automatic run.
Similarly, you can also run an on-demand analysis for Bug Scan or Best Practices to reflect the latest status.
-
Navigate to Manage > Fabrics.
-
Choose Online or Snapshot fabrics from the drop-down list.
-
For an online fabric with telemetry enabled, click the fabric name to view the details.
-
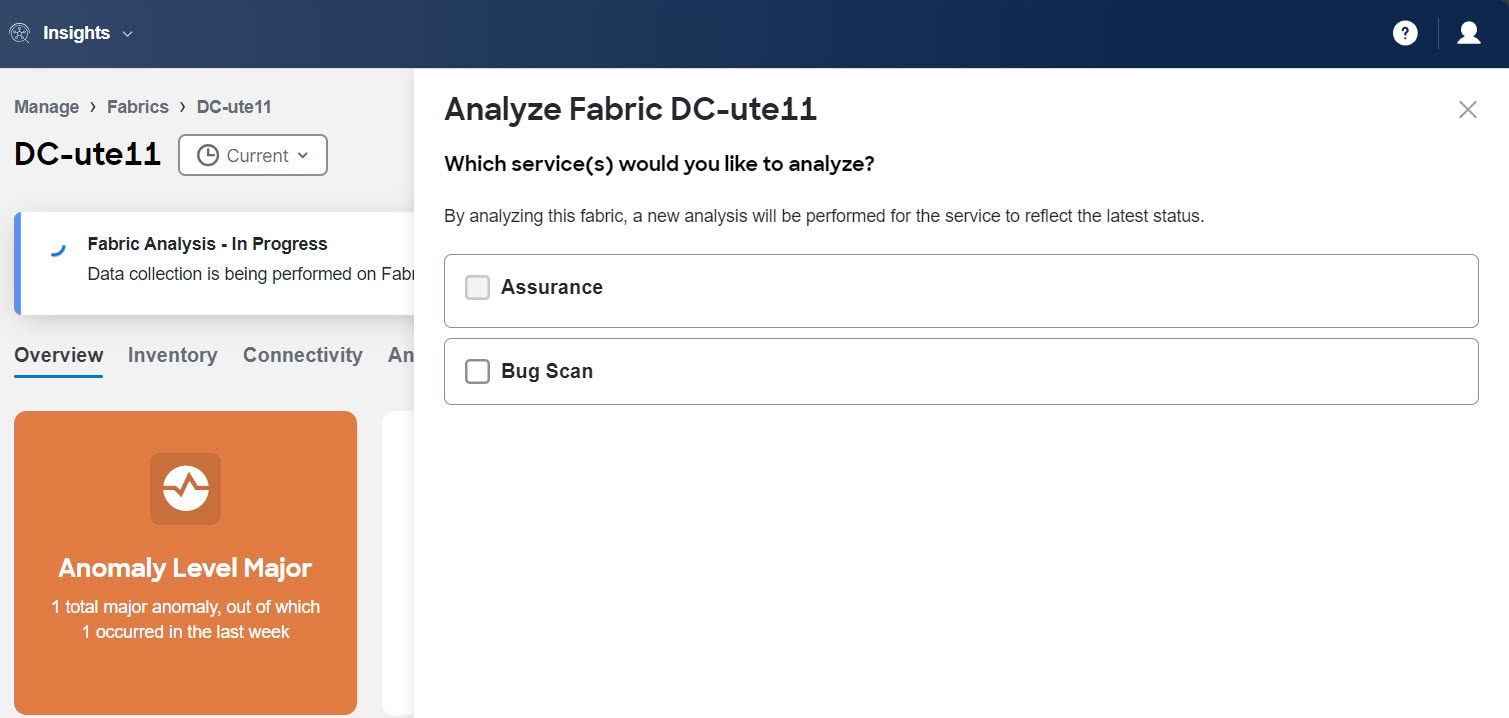
Click Actions > Monitoring > Analyze now.
-
Choose the service. For Bug Scan, select the switches and click Run now.
-
-
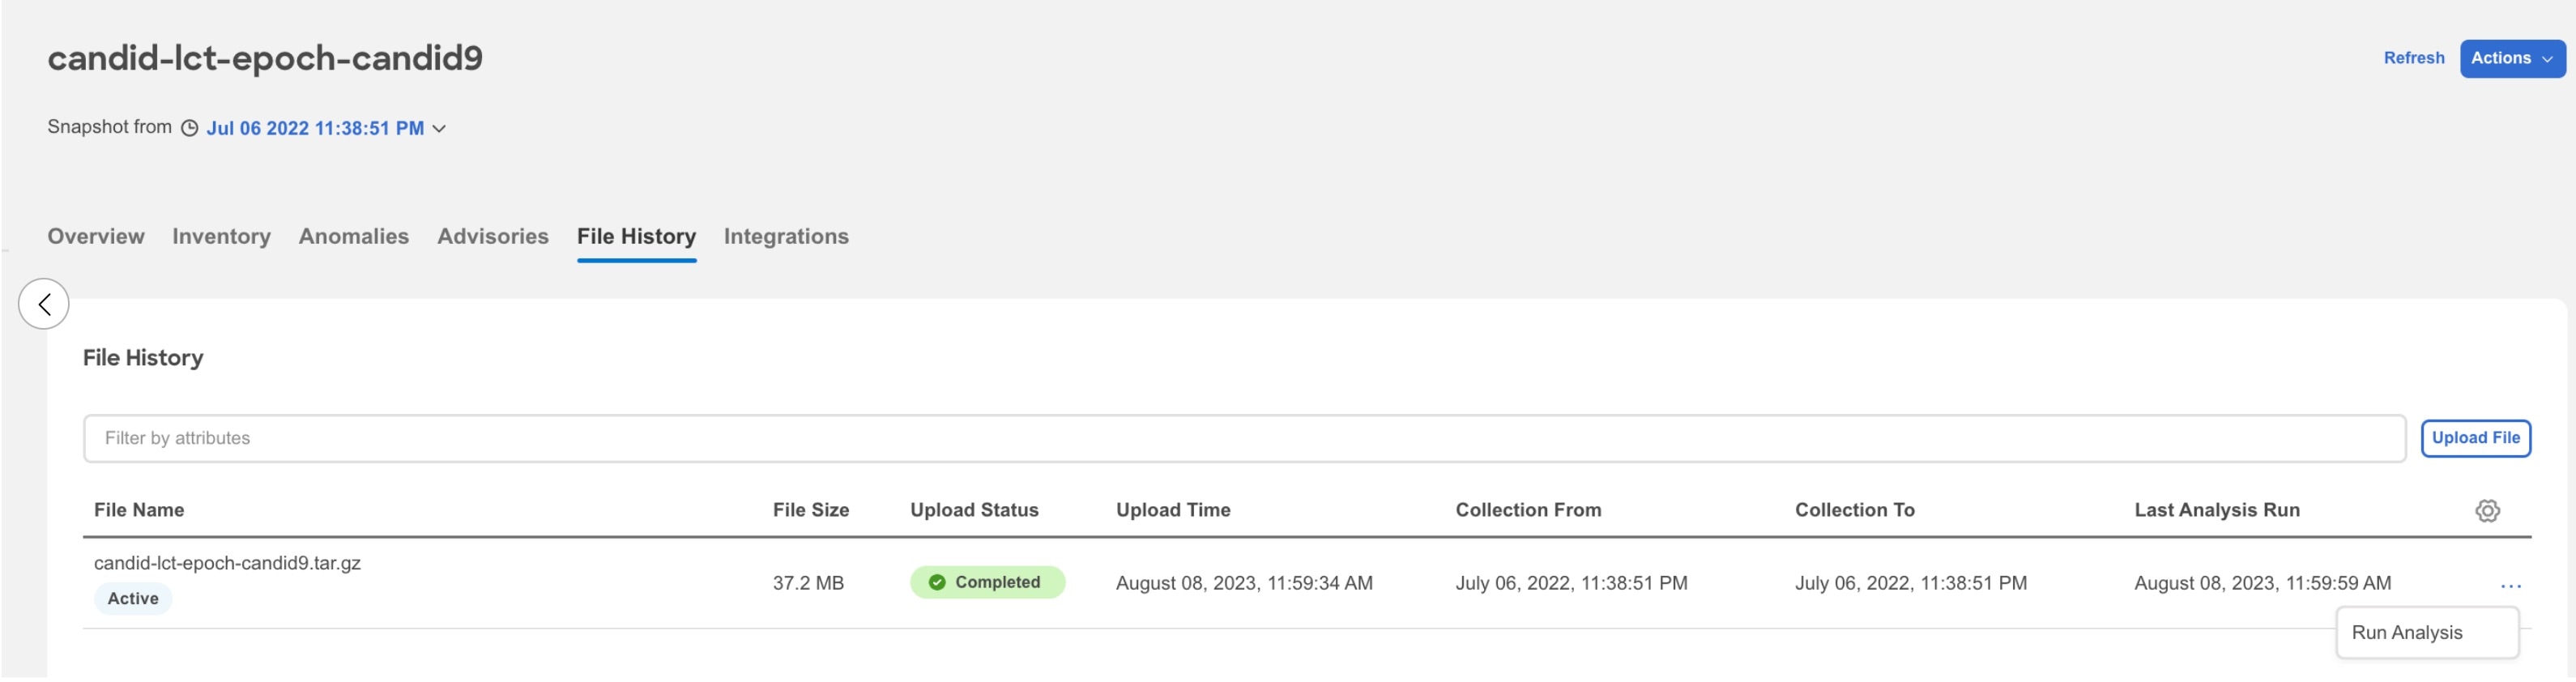
For snapshot fabric, click the fabric name to view the details.
-
Click File History.
-
In the File History table, click the ellipsis icon and choose Run Analysis.
Best Practices job
Nexus Dashboard collects technical support information from the fabric and runs them against known set of signatures and then flags the defects that are not compliant. Nexus Dashboard also generates an anomaly list for you. See Detecting Anomalies and Identifying Advisories in Your Nexus Dashboard to learn more about Metadata support.
A Best Practices job is run for all the fabrics onboarded to Nexus Dashboard and is auto-scheduled every 7 days for each device. This schedule is fixed and is not customizable.
A Best Practices job is run on devices contained in a fabric either based on the last Best Practices job or the onboarding time if a Best Practices job has not been run before. Priority is given to devices with a longer time elapsed since the last Best Practices job. After a Best Practices job is run on a device, regardless of whether it succeeds or fails, another Best Practices job will not be run for the same device for the next 7 days.
However, the on-demand Best Practices job is an exception and is prioritized over any auto-scheduled runs. If an auto-scheduled Best Practices job is in progress and an on-demand Best Practices job is initiated, based on the available resources in the Nexus Dashboard nodes the on-demand Best Practices job will start while the current Best Practices job is in progress or after the current Best Practices job is completed.
Only one Best Practices job at the time can run on a specific device. However, if you have one set of devices where a Best Practices job is already in progress, a second (auto-scheduled or on-demand) Best Practices job can run only if Nexus Dashboard has enough resources available. Otherwise, it will be put on hold and started as soon as resources are available.
Run an on-demand Best Practices job
You can also run an on-demand Best Practices job for a fabric. See On-demand analysis.
You can only run one on-demand Bug Scan or Best Practice job in Nexus Dashboard at any given instance. Once an on-demand job is started, the UI takes up to a minute to grey out. If you trigger another on-demand job while the UI is not greyed out, the job will fail.
Policy-based redirect service chain assurance
In a Cisco ACI fabric, with policy-based redirect (PBR) support, the Nexus Dashboard assurance engine checks for inconsistencies with device cluster, device selection policy, deployment of vPC nodes, and device cluster deployment for unmanaged single nodes in the GoTo mode.
Nexus Dashboard assures PBR service graphs. If all conditions listed below are met, there will be no false positive anomalies. However, if any of the conditions are not met, then PBR service graphs are not assured and they may result in false positives.
-
A service graph template must have route redirect enabled.
-
Only a single service node is supported and the service node must be in the GoTo mode Function Type under the Function Node properties.
-
The direct connect option for service graphs is not supported, therefore you must set the value to False.
-
The set of provider/consumer bridge domains must not overlap with the set of shadow EPG bridge domains. Additionally, every shadow EPG must have its own bridge domain.
-
The provider EPG and the consumer EPG must be one of the following types: an L3Out EPG, an application EPG, or a vzAny EPG.
-
In a transit routing case with a PBR contract, the provider L3Out and consumer L3Out must be different L3Outs. PBR destinations in an L3Out is not supported.
-
There must be a single service graph per contract, and the service graph must be bidirectional.
-
There must be no filters set on the function node connectors under the service graph template.
-
Only one service graph per contract is supported.
-
Subnets on logical interface contexts are not supported.
-
The backup PBR policy feature (introduced in Cisco APIC release 4.2(1)) is not supported.
-
If you use the threshold-redir command, you must set the threshold down action to permit.
-
Filters from a contract for a PBR service graph template is not supported.
Policy-based redirect anomalies
In a Cisco ACI fabric, the anomaly Service Chain Redirect Policy Violation is used for PBR assurance.
The following checks are performed before the Service Chain Redirect Policy Violation is generated:
-
If one or more zoning rules contracts are missing or do not match the APIC configurations.
-
If redirect destination or redirect destination group which is used by deployed PBR graph is in disabled state.
As a result, traffic will not be redirected as expected for the contract and graph instance.
If IP-SLA policy or health group is not enabled in the PBR redirect policy, the anomaly Service Chain Redirect Policy Violation will not be generated even if the redirect destination is not reachable. In this case, the anomaly PBR Redirect Destination Learning Error will be generated.
Alerts suspend mode for anomalies and advisories
When you place a fabric in Alerts suspend mode, Nexus Dashboard does not display any new anomalies or advisories generated for that fabric in the Fabric Overview page. However, you will still see all pre-existing alerts. Once you resume alerts, Nexus Dashboard includes both pre-existing alerts and those generated during the suspend mode in the default views.
Alerts suspend mode is especially useful when you make changes to a fabric or switch, as these changes may trigger numerous anomalies and advisories that resolve once the changes are complete. By enabling this mode, you prevent these anomalies and advisories from cluttering the default views.
You can enable Alerts suspend mode only at the fabric level specifically on the primary cluster of that fabric. When enabled, Nexus Dashboard also suspends alerts on the remote telemetry clusters of the same fabric. Alerts suspend mode is supported only for online fabrics and not supported for snapshot fabrics.
Follow these steps to enable Alerts suspend mode for a fabric.
-
Navigate to the Fabrics page.
Go to Manage > Fabrics.
-
In the Fabric page, click the appropriate fabric.
The Fabric Overview page displays.
-
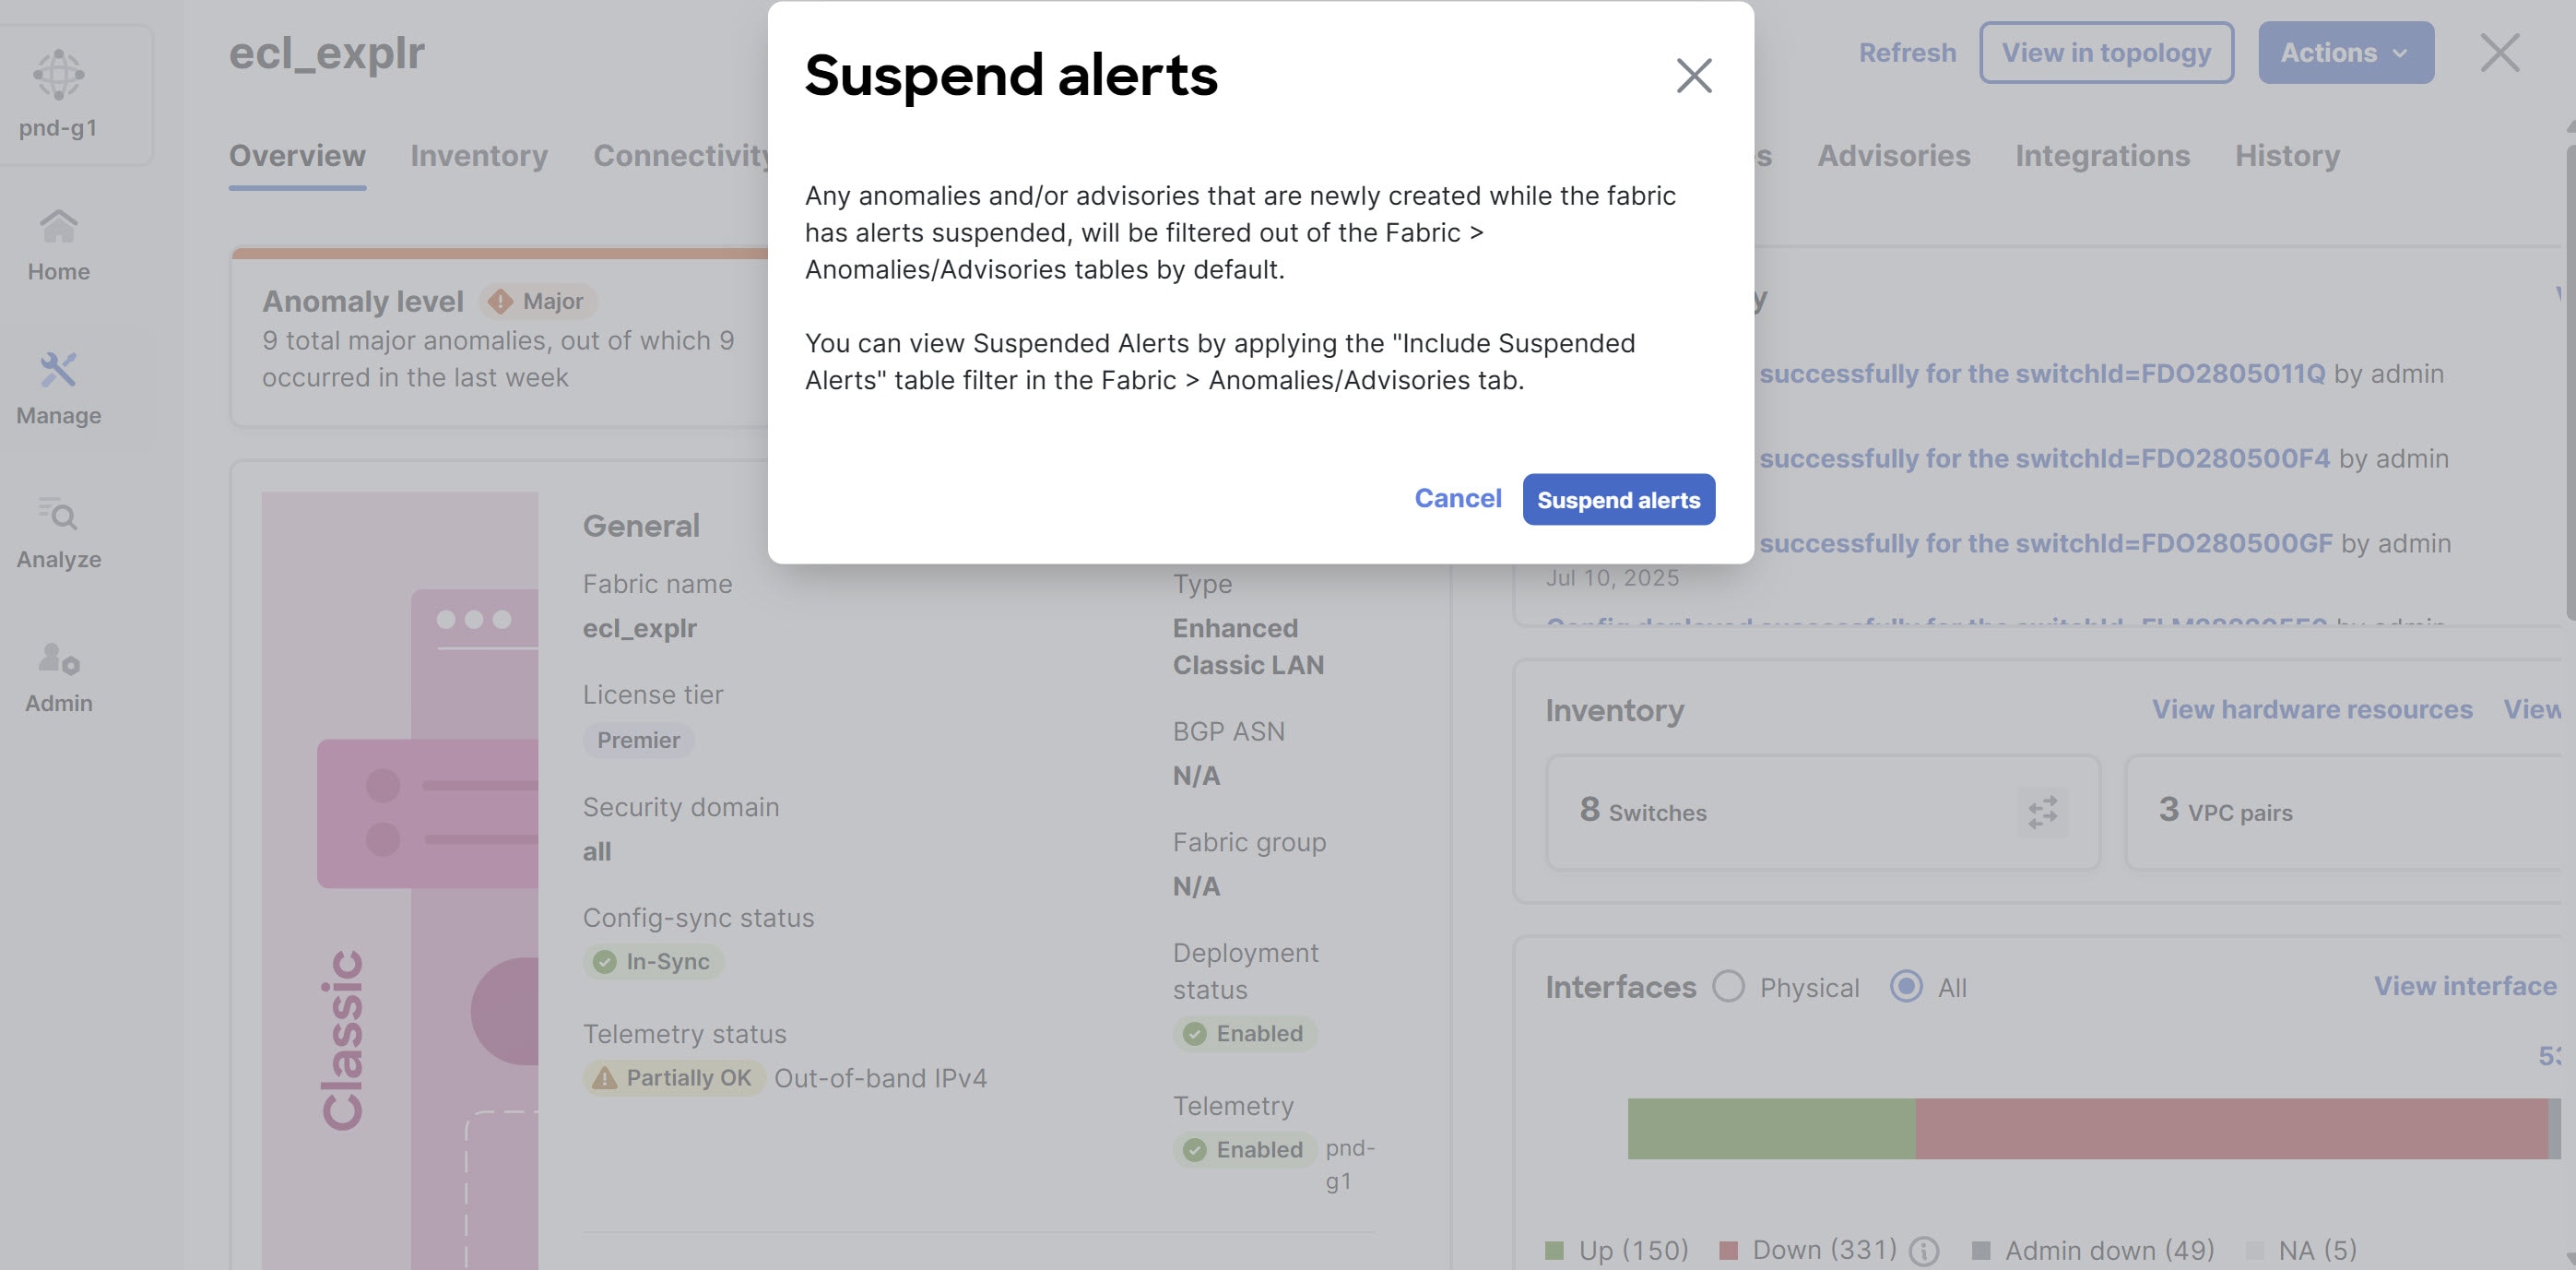
From the Actions drop-down list, choose Maintenance > Suspend alerts.
The Suspend alerts dialog box displays.
-
In the Suspend alerts dialog box, click Suspend alerts to suspend alerts of the fabric.
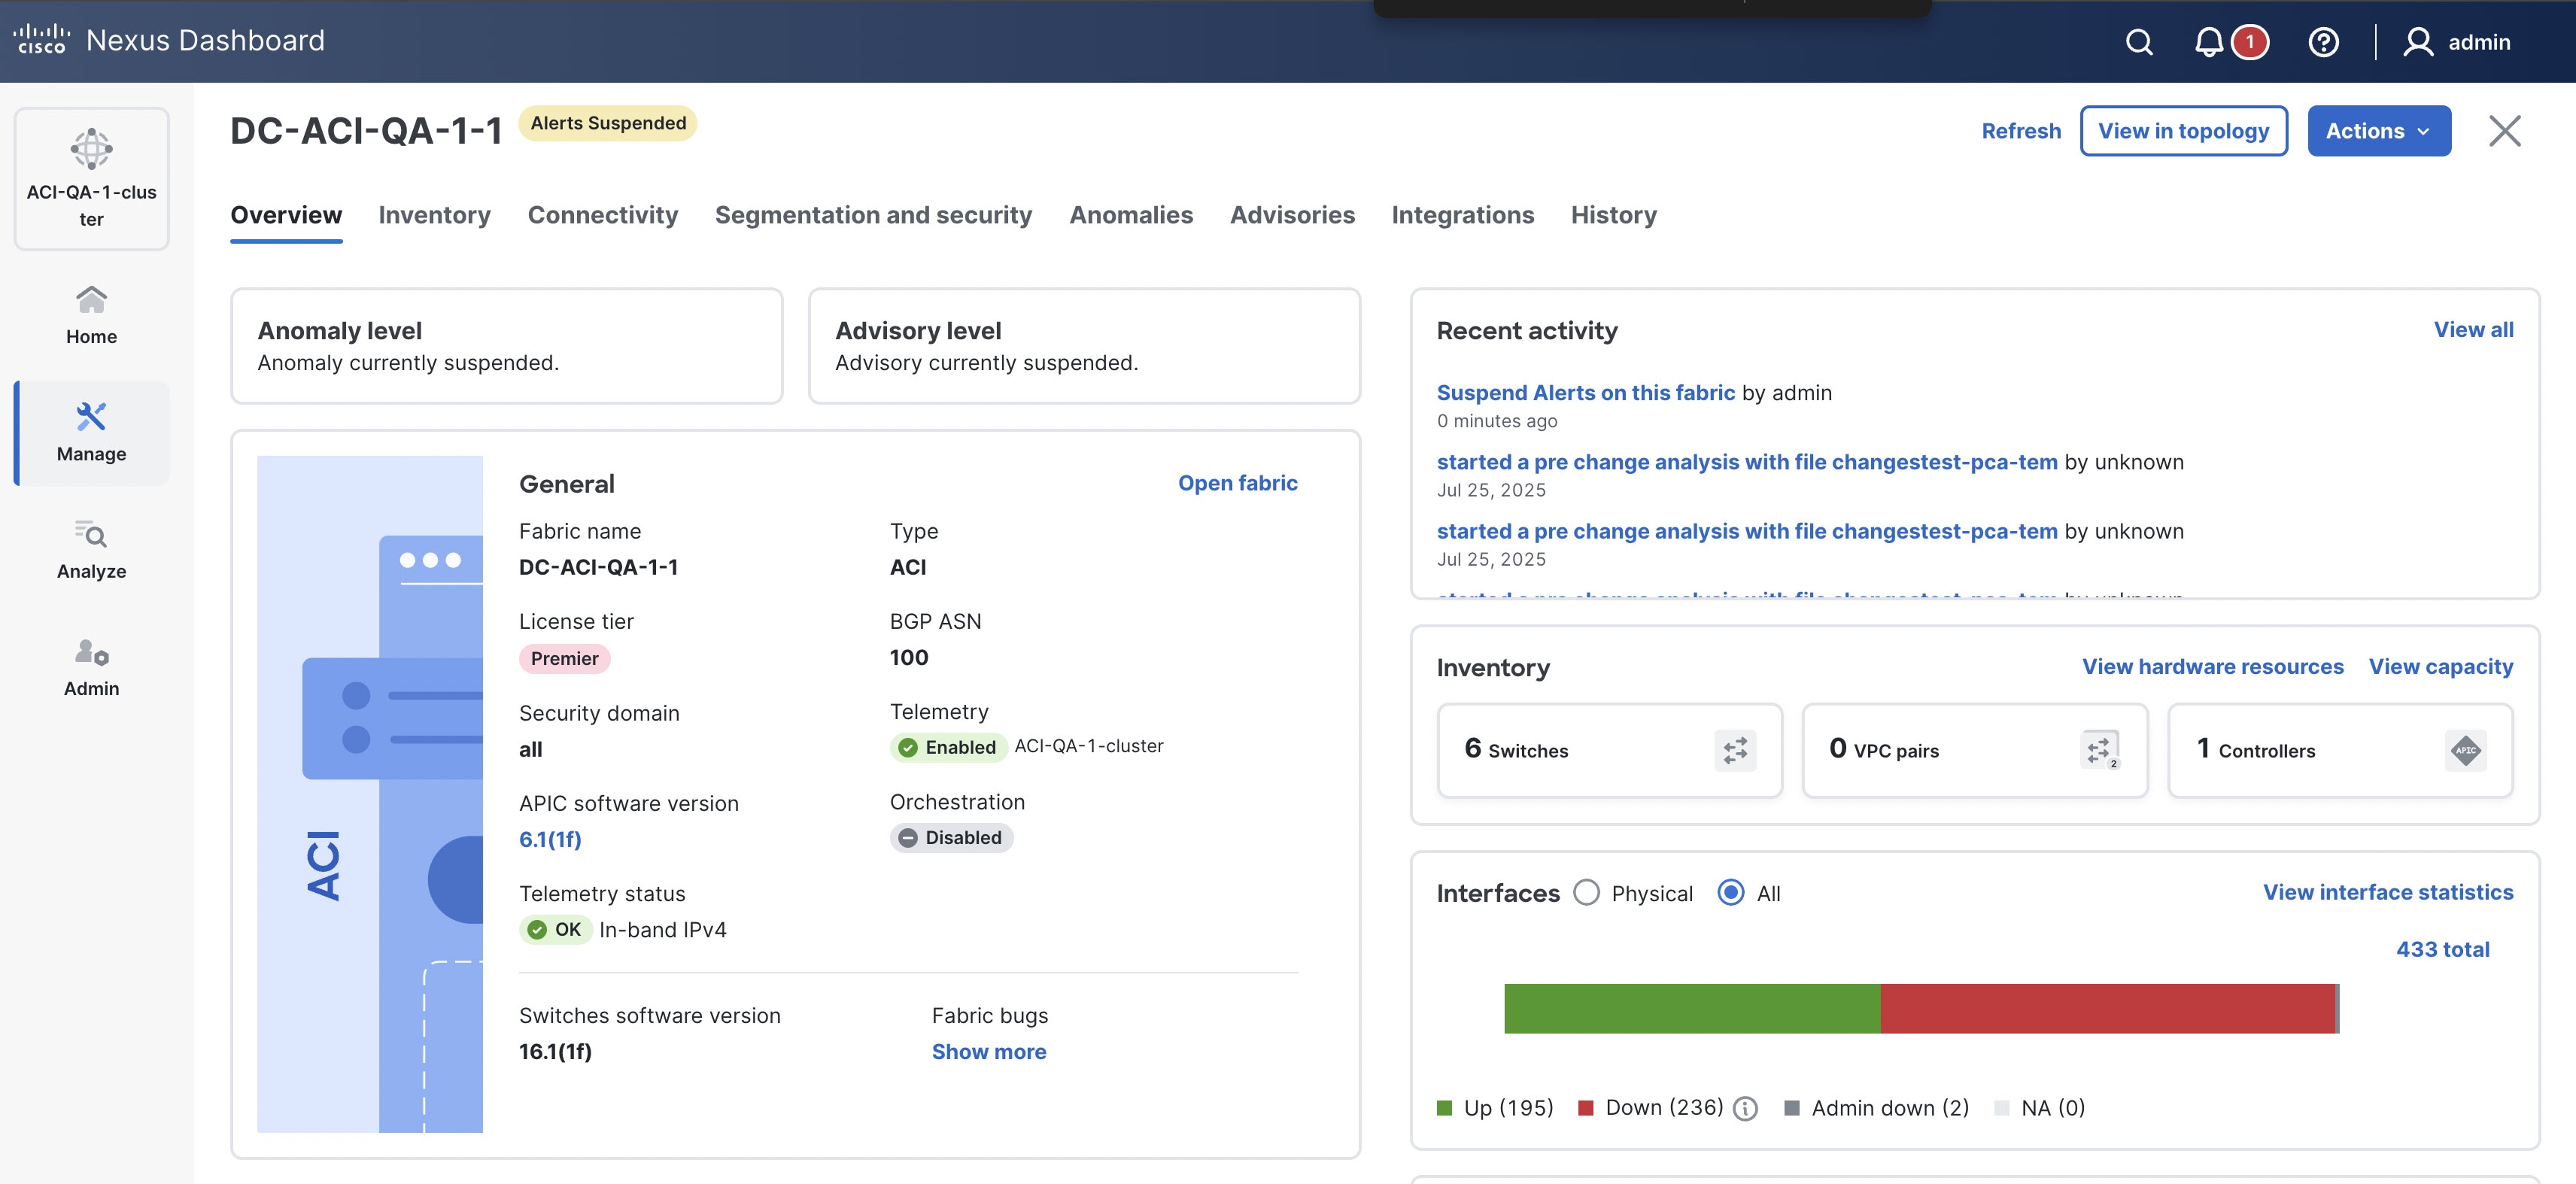
You will see an Alerts Suspended label next to the fabric name in the Fabric Overview page.
The Anomaly level and Advisory level cards display no data in the Alerts suspend mode.
-
To resume suspended alerts, from the Actions drop-down list, choose Maintenance > Resume alerts.
The Anomaly level and Advisory level pie charts and data in the Overview page (Home > Overview) display only pre-existing anomalies from suspended fabrics, along with all anomalies from non-suspended fabrics. Once alerts are resumed for a fabric, all anomalies from that fabric are displayed in the Overview page .
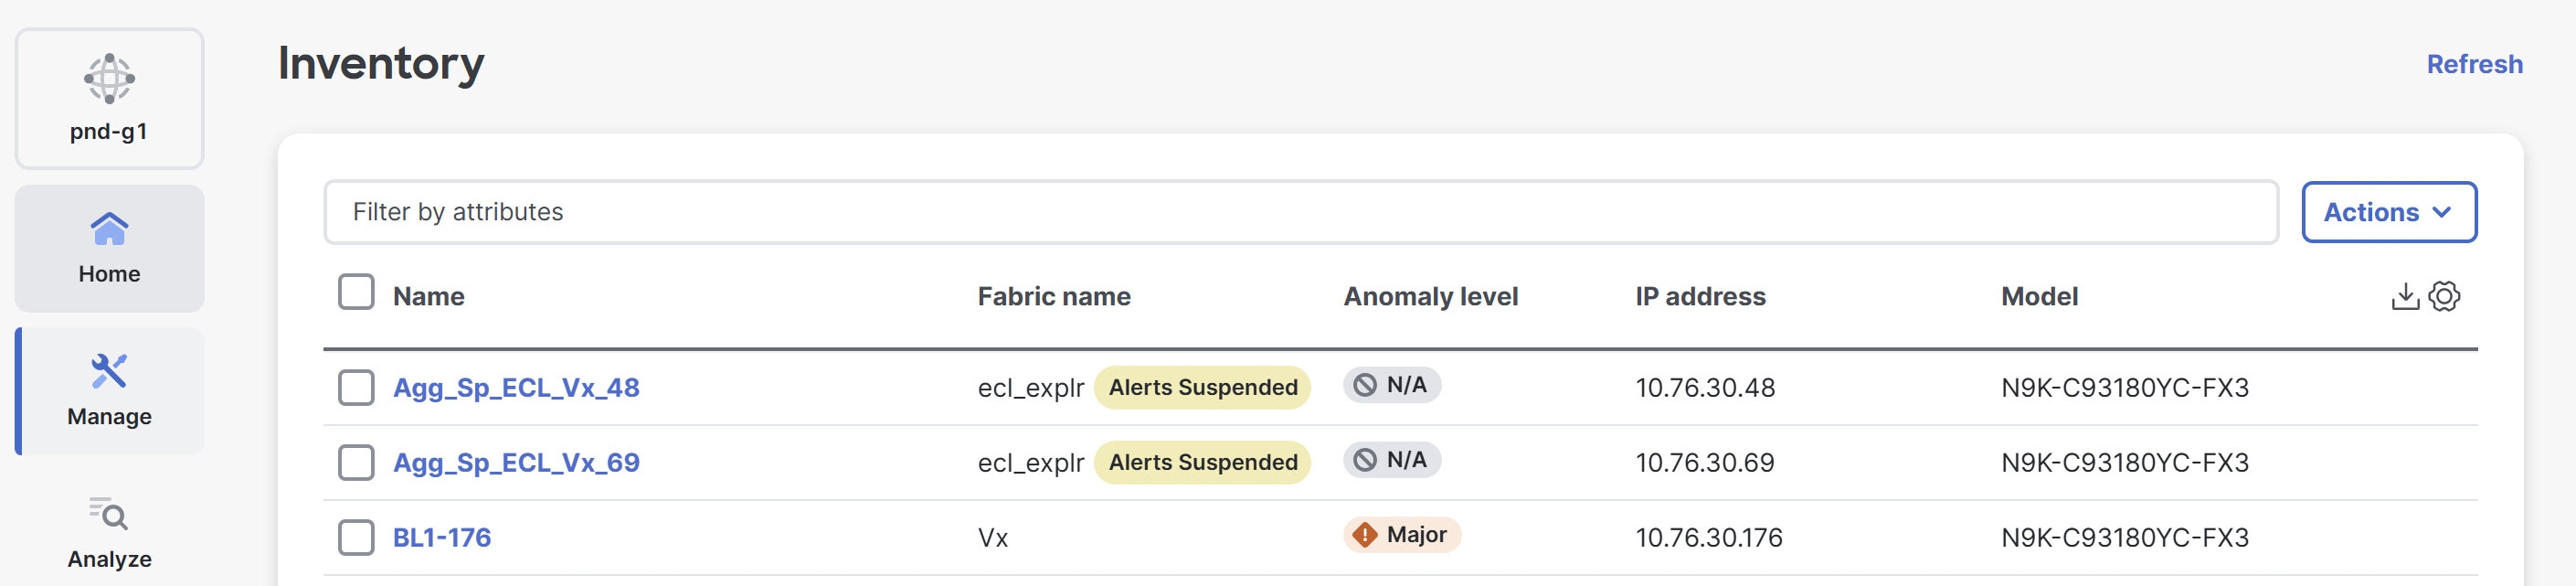
When you place a fabric in Alerts suspend mode, all the switches within the fabric also suspend their alerts. Navigate to Manage > Inventory, to view the switches in Alerts suspend mode.
Include suspended alerts in anomalies and advisories
You can view the anomalies and advisories for the specific fabric that you placed in Alerts suspend mode.
Follow these steps to include the suspended alerts in anomalies.
-
Navigate to the Fabrics page.
Go to Manage > Fabrics.
-
Choose the fabric for which you want to include suspended alerts.
The Fabric Overview page displays.
-
Click the Anomalies tab.
-
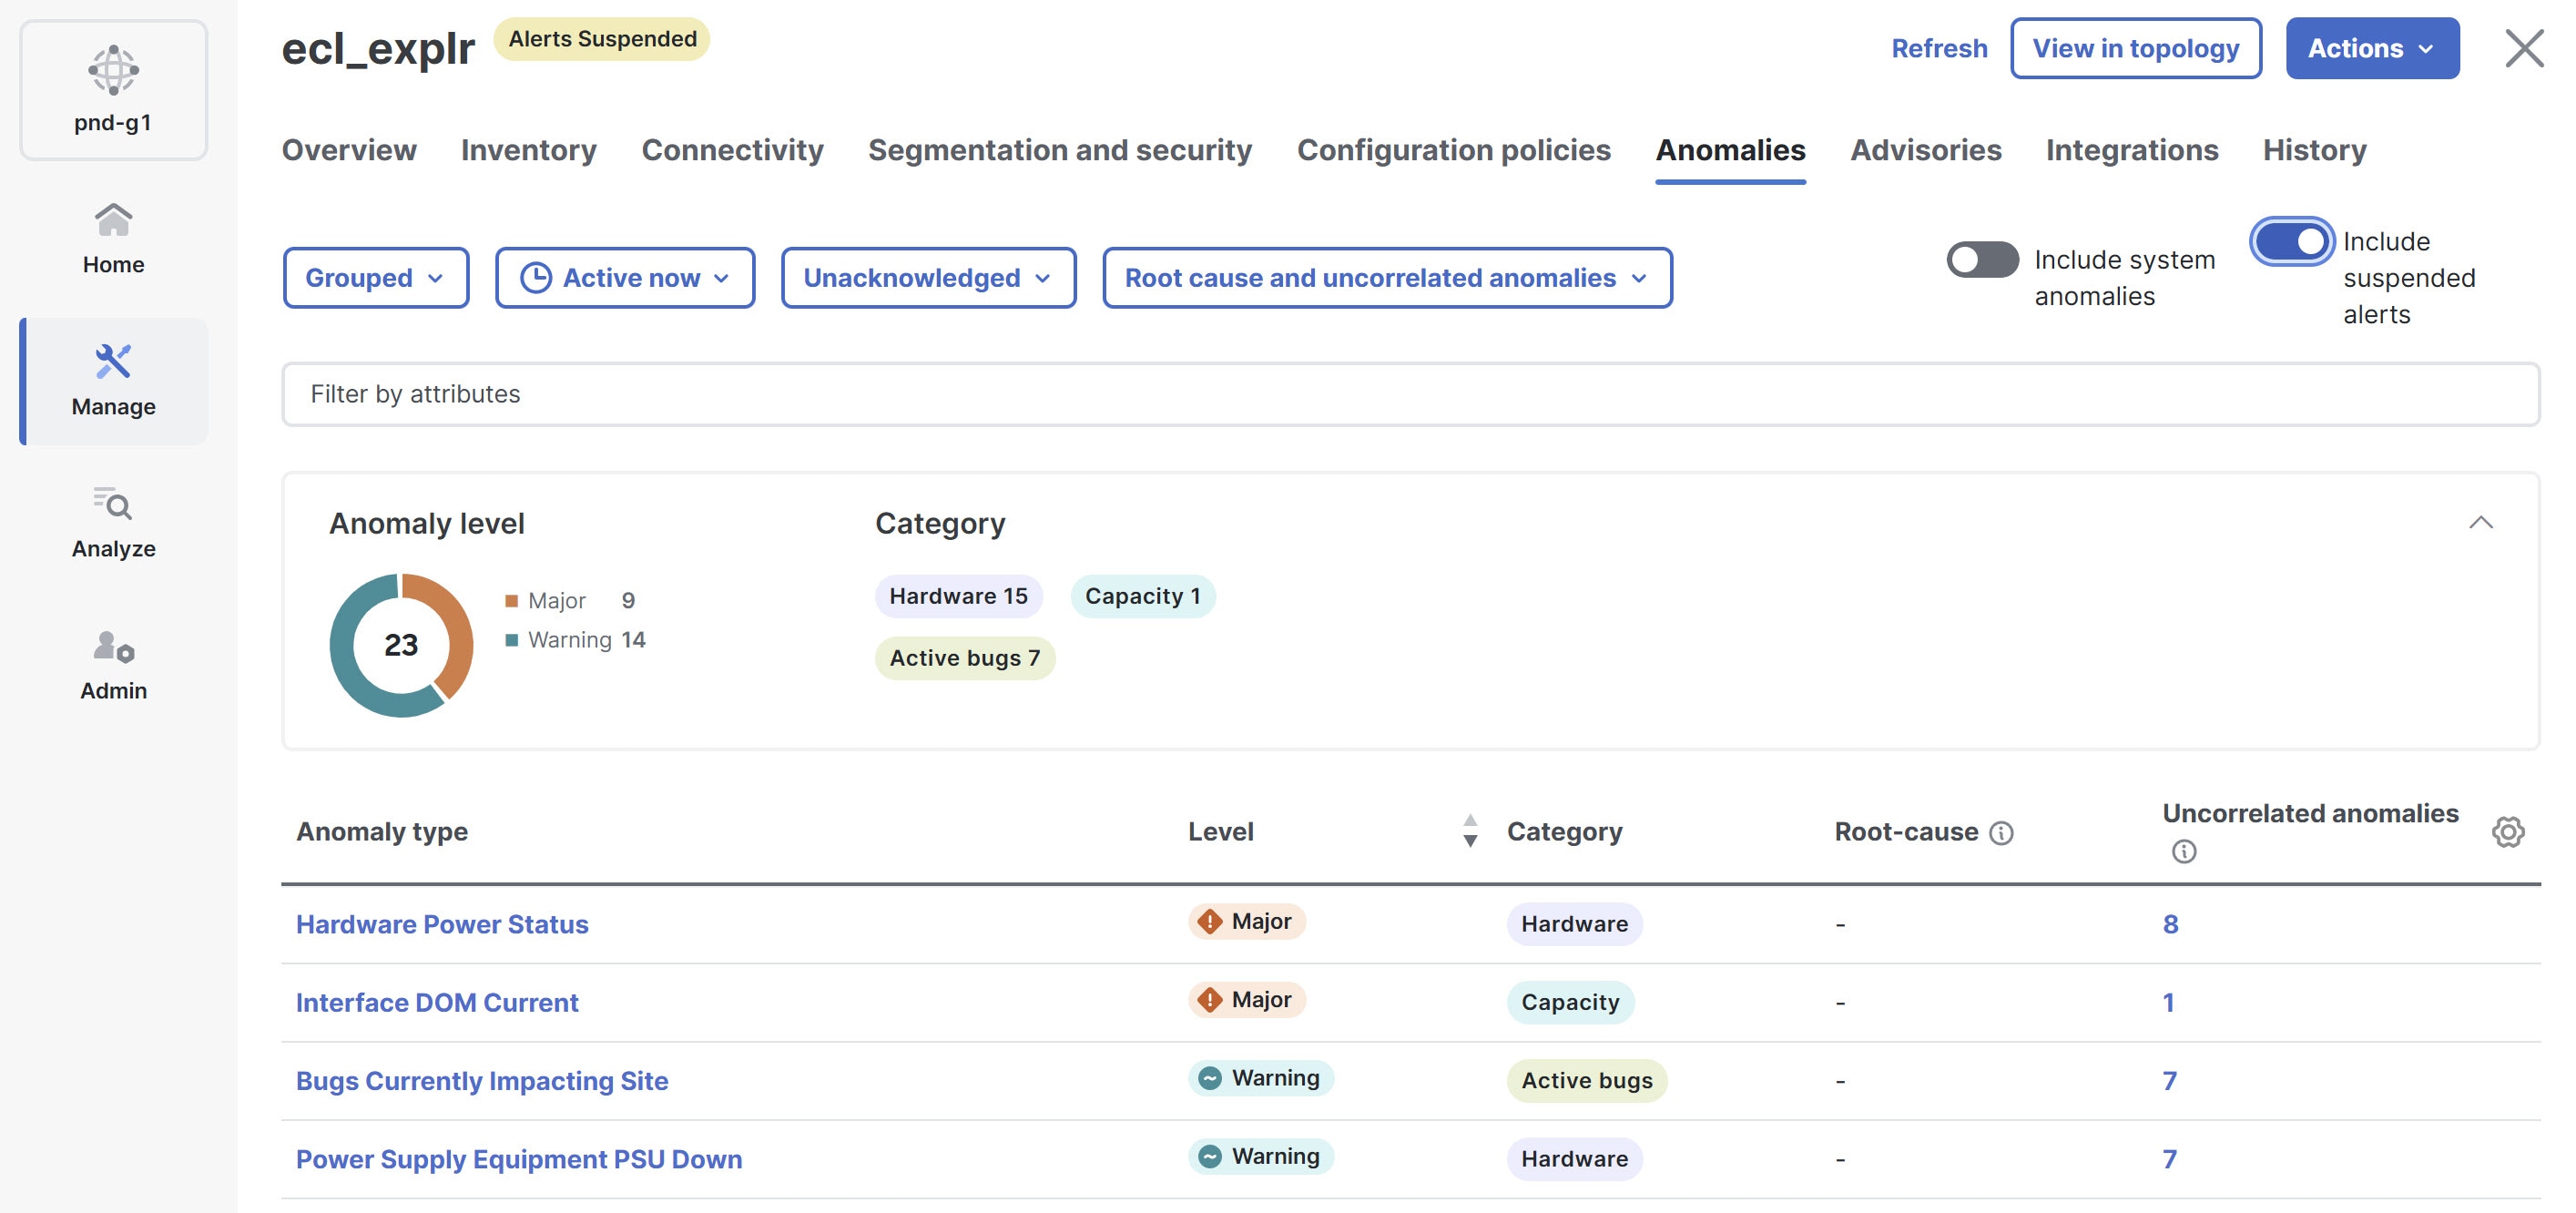
In the top-right corner, click the Include suspended alerts toggle button to display suspended alerts.
Suspended alerts display along with active anomalies on this page. If any alerts are suspended, the Anomaly level card displays a Suspended alerts label and indicates the number of suspended alerts. Click the Suspended alerts label to view only the anomalies generated after the fabric was placed in Alerts suspend mode.
Follow these steps to include the suspended alerts in advisories.
-
Navigate to the Fabrics page.
Go to Manage > Fabrics.
-
Choose the fabric for which you want to include suspended alerts.
The Fabric Overview page displays.
-
Click the Advisories tab.
-
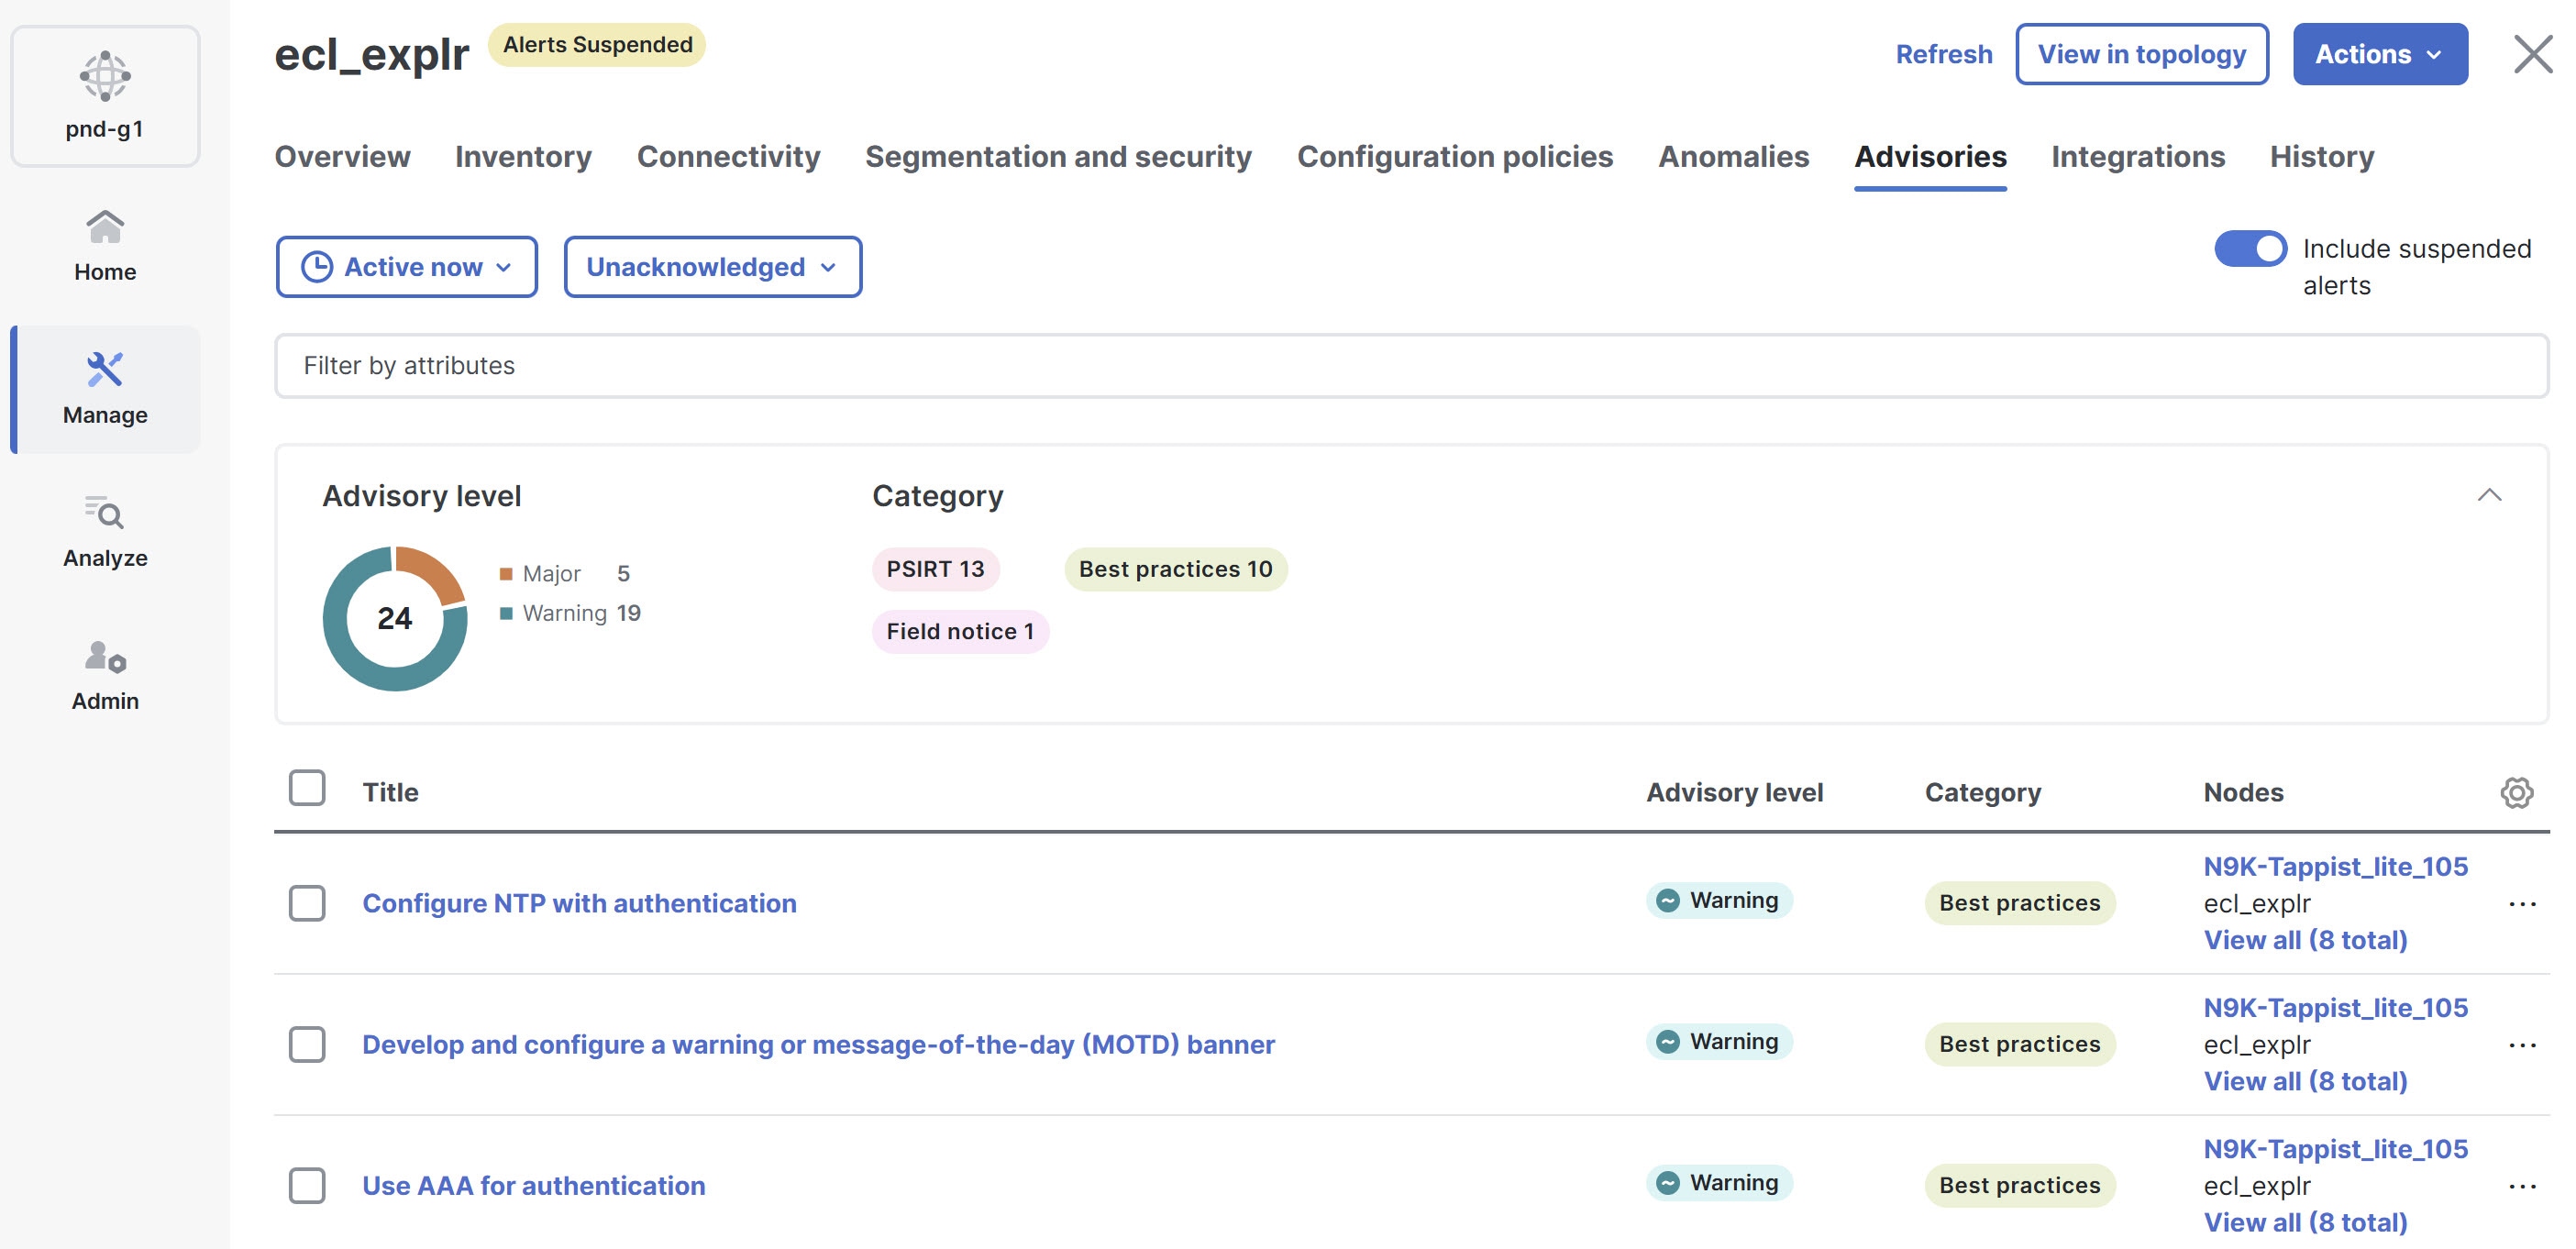
In the top-right corner, click the Include suspended alerts toggle button to display suspended alerts.
Suspended alerts display along with active advisories on this page. If any alerts are suspended, the Advisory level card displays a Suspended alerts label and indicates the number of suspended alerts. Click the Suspended alerts label to view only the advisories generated after the fabric was placed in Alerts suspend mode.
You can also include suspended alerts and view the anomalies and advisories by navigating to Analyze > Anomalies and Analyze > Advisories.
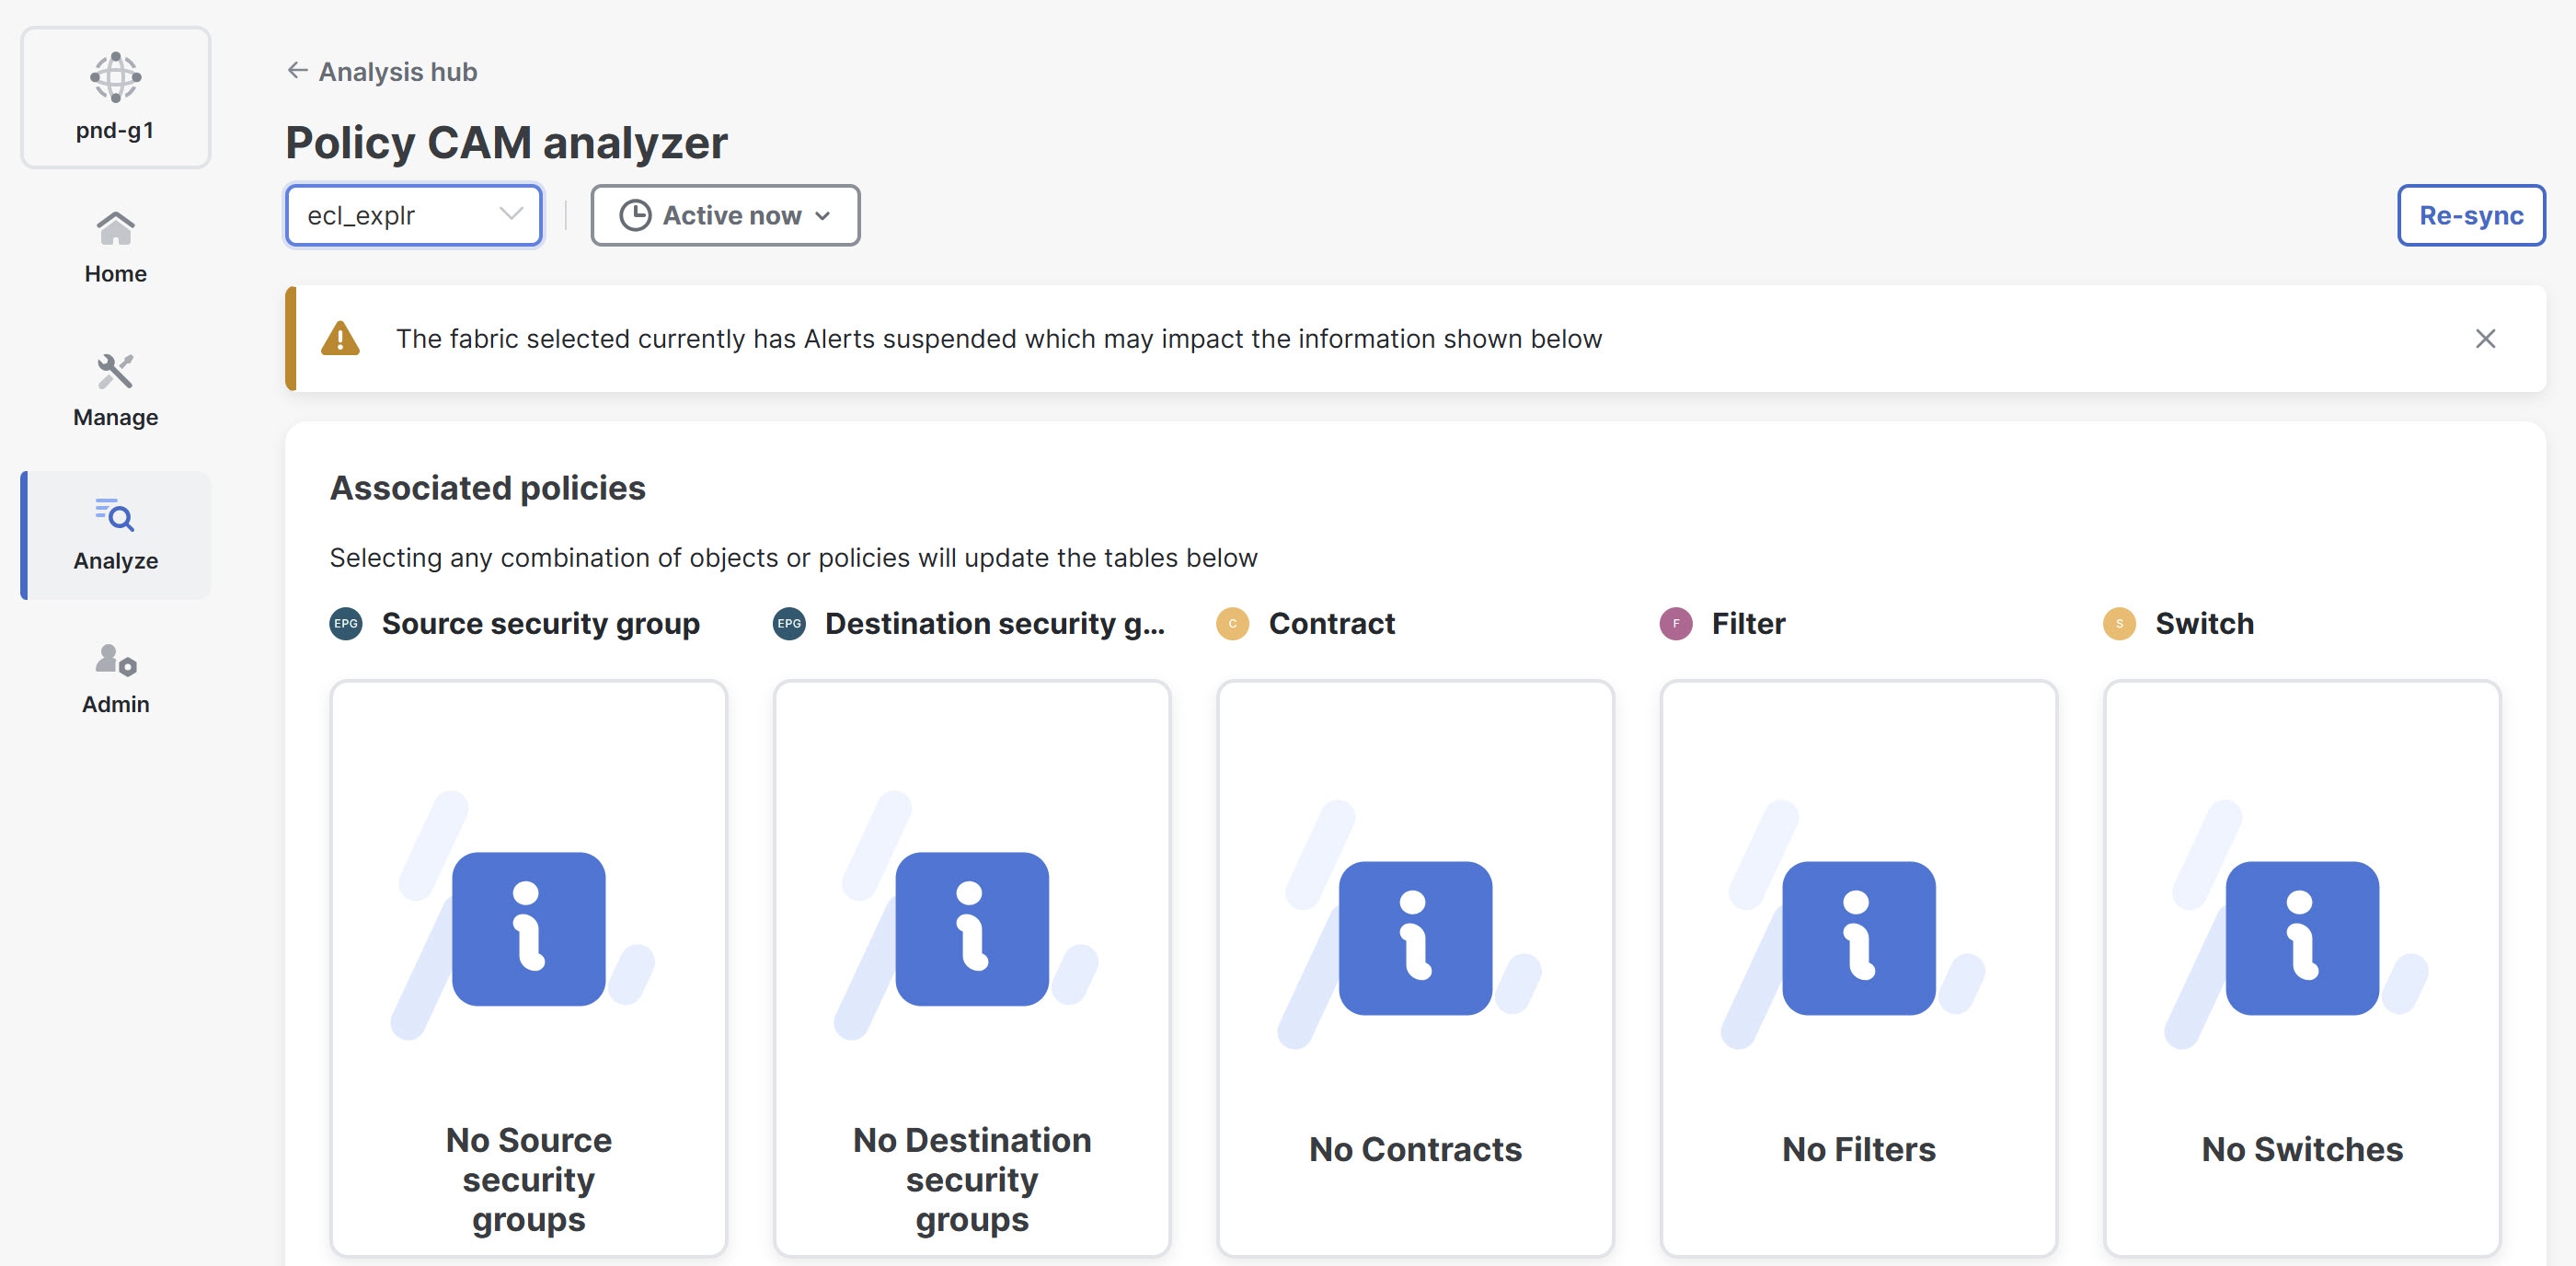
Alerts suspend mode notification
When you choose fabrics that are currently in Alerts suspend mode within the Analyze > Analysis Hub under the Policy CAM, Compliance, and Conformance sections, a banner appears on the respective page. The banner displays the following message.
The fabric selected currently has Alerts suspended which may impact the information shown below.
Guidelines and limitations
-
The Alerts suspend mode feature is available only for fabrics with Advantage and Premier license tiers.
-
You can configure the Alerts suspend mode for a fabric from the primary cluster of the fabric.
-
The Alerts suspend mode feature supports co-located NX-OS and ACI fabrics but does not support snapshot fabrics.
-
The Alerts suspend mode feature is specific to fabric management and telemetry anomalies.
-
Alerts suspend mode does not apply to the following features:
-
Root Cause Analysis
-
Analysis Hub
-
Delta Analysis
-
Policy CAM
-